Analysis Summary
Notes:
- 1) No attempt has been made to eliminate the non-significant decimal places.
- 2) This batgrbproduct analysis is done using the HEASARC data.
- 3) This batgrbproduct analysis is using the flight position for the mask-weighting calculation.
======================================================================
BAT GRB EVENT DATA PROCESSING REPORT
Process Script Ver: batgrbproduct v2.46
Process Start Time: Thu May 31 10:58:23 EDT 2018
Host Name: bat1
Current Working Dir: /local/data/bat1/alien/Swift_3rdBATcatalog/event/batevent_reproc/trigger817345
======================================================================
Trigger: 00817345 Segment: 000
BAT Trigger Time: 543559050.304 [s; MET]
Trigger Stop: 543559050.816 [s; MET]
UTC: 2018-03-24T04:37:09.631100 [includes UTCF correction]
Where From?: TDRSS position message
BAT
RA: 76.5845390141635 Dec: 56.7246966581087 [deg; J2000]
Catalogged Source?: NO
Point Source?: YES
GRB Indicated?: YES [ by BAT flight software ]
Image S/N Ratio: 18.63
Image Trigger?: NO
Rate S/N Ratio: 73.9864852523757 [ if not an image trigger ]
Image S/N Ratio: 18.63
Analysis Position: [ source = BAT ]
RA: 76.5845390141635 Dec: 56.7246966581087 [deg; J2000]
Refined Position: [ source = BAT pre-slew burst ]
RA: 76.5810188019364 Dec: 56.7435464022776 [deg; J2000]
{ 05h 06m 19.4s , +56d 44' 36.8" }
+/- 1.37917894234048 [arcmin] (estimated 90% radius based on SNR)
+/- 0.533598528397135 [arcmin] (formal 1-sigma fit error)
SNR: 19.2158834006703
Angular difference between the analysis and refined position is 1.136903 arcmin
Partial Coding Fraction: 0.78125 [ including projection effects ]
Duration
T90: 7.21599996089935 +/- 1.30228724554167
Measured from: -4.7720000743866
to: 2.44399988651276 [s; relative to TRIGTIME]
T50: 0.543999910354614 +/- 0.199719810945016
Measured from: 0.0199999809265137
to: 0.563999891281128 [s; relative to TRIGTIME]
Fluence
Peak Flux (peak 1 second)
Measured from: -0.128000020980835
to: 0.871999979019165 [s; relative to TRIGTIME]
Total Fluence
Measured from: -5.36000001430511
to: 3.6599999666214 [s; relative to TRIGTIME]
Band 1 Band 2 Band 3 Band 4
15-25 25-50 50-100 100-350 keV
Total 0.256556 0.332722 0.256455 0.070931
0.022602 0.023943 0.021125 0.017669 [error]
Peak 0.128798 0.185553 0.206617 0.050883
0.009892 0.011137 0.010747 0.007490 [error]
[ fluence units of on-axis counts / fully illuminated detector ]
======================================================================
====== Table of the duration information =============================
Value tstart tstop
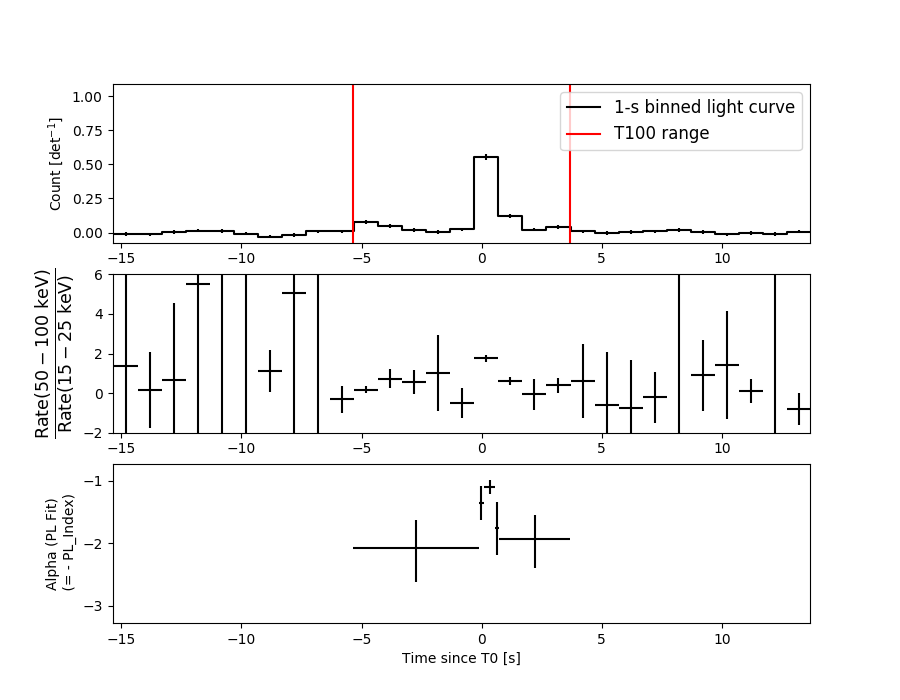
T100 9.020 -5.360 3.660
T90 7.216 -4.772 2.444
T50 0.544 0.020 0.564
Peak 1.000 -0.128 0.872
====== Spectral Analysis Summary =====================================
Model : spectral model: simple power-law (PL) and cutoff power-law (CPL)
Ph_index : photon index: E^{Ph_index}
Ph_90err : 90% error of the photon index
Epeak : Epeak in keV
Epeak_90err: 90% error of Epeak
Norm : normalization at 50 keV in both the PL model and CPL model
Nomr_90err : 90% error of the normalization
chi2 : Chi-Squared
dof : degree of freedo
=== Time-averaged spectral analysis ===
(Best model with acceptable fit: PL)
Model Ph_index Ph_90err_low Ph_90err_hi Epeak Epeak_90err_low Epeak_90err_hi Norm Nomr_90err_low Norm_90err_hi chi2 dof
PL -1.453 -0.144 0.143 - - - 6.54e-03 -5.19e-04 5.16e-04 63.970 57
CPL -1.425 -0.172 0.407 981.118 -981.118 -981.118 6.76e-03 N/A N/A 64.060 56
=== 1-s peak spectral analysis ===
(Best model with acceptable fit: PL)
Model Ph_index Ph_90err_low Ph_90err_hi Epeak Epeak_90err_low Epeak_90err_hi Norm Nomr_90err_low Norm_90err_hi chi2 dof
PL -1.165 -0.104 0.104 - - - 3.74e-02 -2.20e-03 2.20e-03 57.770 57
CPL -0.851 -0.357 0.451 207.953 -90.405 -207.953 5.18e-02 -1.60e-02 2.97e-02 56.100 56
=== Fluence/Peak Flux Summary ===
Model Band1 Band2 Band3 Band4 Band5 Total
15-25 25-50 50-100 100-350 15-150 15-350 keV
Fluence PL 7.20e-08 1.36e-07 1.99e-07 6.21e-07 5.64e-07 1.03e-06 erg/cm2
90%_error_low -9.78e-09 -1.12e-08 -2.10e-08 -1.32e-07 -4.99e-08 -1.49e-07 erg/cm2
90%_error_hi 1.02e-08 1.11e-08 2.08e-08 1.55e-07 5.05e-08 1.69e-07 erg/cm2
Peak flux PL 1.12e+00 1.37e+00 1.22e+00 1.88e+00 4.36e+00 5.60e+00 ph/cm2/s
90%_error_low -1.26e-01 -9.60e-02 -8.39e-02 -2.64e-01 -2.64e-01 -3.53e-01 ph/cm2/s
90%_error_hi 1.32e-01 9.53e-02 8.33e-02 2.89e-01 2.64e-01 3.58e-01 ph/cm2/s
Fluence CPL 6.35e-08 8.42e-08 8.57e-08 1.92e-07 2.84e-07 4.23e-07 erg/cm2
90%_error_low -1.15e-08 -1.73e-08 -1.63e-08 N/A -5.58e-08 -7.62e-08 erg/cm2
90%_error_hi 1.00e-08 7.35e-09 1.47e-08 N/A 5.24e-08 7.05e-08 erg/cm2
Peak flux CPL 1.03e+00 1.40e+00 1.27e+00 1.38e+00 4.31e+00 5.08e+00 ph/cm2/s
90%_error_low -1.64e-01 -1.03e-01 -1.03e-01 -4.47e-01 -2.75e-01 -5.42e-01 ph/cm2/s
90%_error_hi 1.71e-01 1.04e-01 1.05e-01 3.88e-01 2.75e-01 6.95e-01 ph/cm2/s
======================================================================
Image
Pre-slew 15.0-350.0 keV image (Event data)
#   RAcent    DECcent   POSerr    Theta     Phi              Peak Cts       SNR   Name
   76.5810    56.7435   0.0100    18.0357   121.7817         0.9300770     19.216 TRIG_00817345

Foreground time interval of the image:
 -5.360   3.660 (delta_t =   9.020 [sec])
Background time interval of the image:
-239.304  -5.360 (delta_t = 233.944 [sec])
Light Curves
Note: The mask-weighted lightcurves have units of either count/det or counts/sec/det, where a det is 0.4 x 0.4 = 0.16 sq cm.
Full-time range; 1 s binning
Other quick-look light curves:
- 64 ms binning (zoomed)
- 16 ms binning (zoomed)
- 8 ms binning (zoomed)
- 2 ms binning (zoomed)
- SN=5 or 10 s binning (full-time range)
- Raw light curve
Spectra
- 64 ms binning (zoomed)
- 16 ms binning (zoomed)
- 8 ms binning (zoomed)
- 2 ms binning (zoomed)
- SN=5 or 10 s binning (full-time range)
- Raw light curve
Spectra
Notes:
- 1) The fitting includes the systematic errors.
- 2) When the burst includes telescope slew time periods, the fitting uses an average response file made from multiple 5-s response files through out the slew time plus single time preiod for the non-slew times, and weighted by the total counts in the corresponding time period using addrmf. An average response file is needed becuase a spectral fit using the pre-slew DRM will introduce some errors in both a spectral shape and a normalization if the PHA file contains a lot of the slew/post-slew time interval.
- 3) For fits to more complicated models (e.g. a power-law over a cutoff power-law), the BAT team has decided to require a chi-square improvement of more than 6 for each extra dof.
Time averaged spectrum fit using the average DRM
Power-law model

Time interval is from   -5.360 sec. to    3.660 sec.

Spectral model in power-law:
------------------------------------------------------------
Parameters  : value       lower 90%   higher 90%
Photon index: -1.45328     ( -0.144205   0.143026 )
Norm@50keV  : 6.53552E-03    ( -0.000518919   0.000516363 )
------------------------------------------------------------
#Fit statistic : Chi-Squared =          63.97 using 59 PHA bins.
# Reduced chi-squared =          1.122 for     57 degrees of freedom
# Null hypothesis probability =   2.451820e-01

Photon flux (15-150 keV)    in 9.02 sec: 0.806086 ( -0.063405  0.063514 ) ph/cm2/s
Energy fluence (15-150 keV)             : 5.63841e-07 ( -4.99436e-08  5.04533e-08 ) ergs/cm2
Cutoff power-law model
Time interval is from   -5.360 sec. to    3.660 sec.
Spectral model in the cutoff power-law:
------------------------------------------------------------
Parameters  : value       lower 90%   higher 90%
Photon index: -1.45054     ( -0.172422   0.406981 )
Epeak [keV] : 1.00000E+04      ( -10000 -10000 )
Norm@50keV  : 6.55672E-03    (     )
------------------------------------------------------------
#Fit statistic : Chi-Squared =          63.98 using 59 PHA bins.
# Reduced chi-squared =          1.142 for     56 degrees of freedom
# Null hypothesis probability =   2.168197e-01

Photon flux (15-150 keV)    in 9.02 sec: 0.810758 (    ) ph/cm2/s
Energy fluence (15-150 keV)             : 2.84267e-07 ( -5.57932e-08  5.23891e-08 ) ergs/cm2
1-s peak spectrum fit
Power-law model
Time interval is from   -0.128 sec. to    0.872 sec.

Spectral model in power-law:
------------------------------------------------------------
Parameters  : value       lower 90%   higher 90%
Photon index: -1.16529     ( -0.103986   0.104072 )
Norm@50keV  : 3.73536E-02    ( -0.0022006   0.00220057 )
------------------------------------------------------------
#Fit statistic : Chi-Squared =          57.77 using 59 PHA bins.
# Reduced chi-squared =          1.014 for     57 degrees of freedom
# Null hypothesis probability =   4.465488e-01

Photon flux (15-150 keV)    in 1 sec: 4.36435 ( -0.2638  0.26407 ) ph/cm2/s
Energy fluence (15-150 keV)             : 3.82825e-07 ( -2.52394e-08  2.53534e-08 ) ergs/cm2
Cutoff power-law model
Time interval is from   -0.128 sec. to    0.872 sec.
Spectral model in the cutoff power-law:
------------------------------------------------------------
Parameters  : value       lower 90%   higher 90%
Photon index: -0.85126     ( -0.356632   0.451377 )
Epeak [keV] : 207.953      ( -90.4041 -207.952 )
Norm@50keV  : 5.17807E-02    ( -0.0159741   0.0297232 )
------------------------------------------------------------
#Fit statistic : Chi-Squared =          56.10 using 59 PHA bins.
# Reduced chi-squared =          1.002 for     56 degrees of freedom
# Null hypothesis probability =   4.709507e-01

Photon flux (15-150 keV)    in 1 sec: 4.30539 ( -0.27491  0.27477 ) ph/cm2/s
Energy fluence (15-150 keV)             : 1.13493e-07 ( -1.63078e-08  1.02983e-08 ) ergs/cm2
Time-resolved spectra
Distribution
T90 vs. Hardness ratio plot
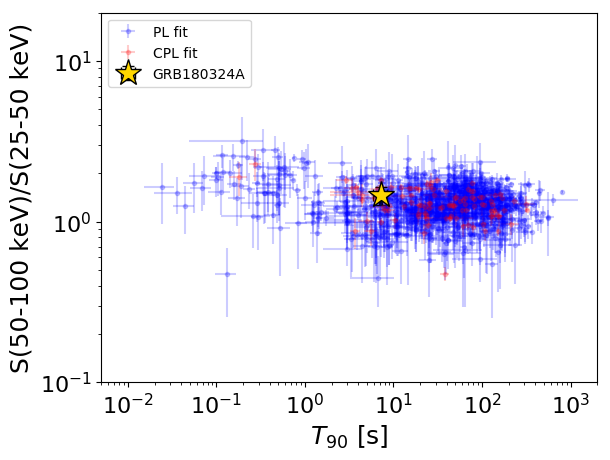
T90                                   = 7.216 sec.
Hardness ratio (energy fluence ratio) = 1.4607970015
S(15-50 keV) vs. S(50-150 keV) plot
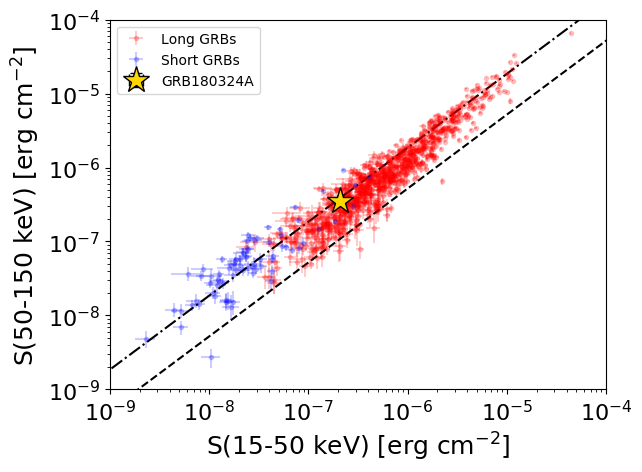
S(15-50 keV)  = 2.0827687e-07
S(50-150 keV) = 3.555672e-07
The dash-dotted line and the dashed line traces the fluences calculated from the Band function with Epeak = 15 and 150 keV, respectively. Both lines assume a canonical values of alpha = -1 and beta = -2.5.
Mask shadow pattern
IMX = -1.714929497662583E-01, IMY = -2.767866785381028E-01
Spacecraft aspect plot
Bright source in the pre-burst/pre-slew/post-slew images
Pre-burst image of 15-350 keV band
Time interval of the image:
-239.304000 -5.360000

# RAcent  DECcent POSerr Theta    Phi  PeakCts   SNR AngSep     Name
#  [deg]    [deg]    ['] [deg]  [deg]                   [']
 83.6455  22.0182    1.0  47.0  163.2   8.0494  11.8    0.7	Crab
308.1017  40.9598   66.8  57.9  -23.2  -0.2298  -0.2    0.6	Cyg X-3
326.2182  38.2015   14.4  51.3  -38.6  -0.8337  -0.8    7.5	Cyg X-2
118.1776  52.2226    3.5  40.9  104.5   2.9312   3.3 ------	UNKNOWN
 91.1039  33.8570    2.9  40.5  146.0   2.0111   4.0 ------	UNKNOWN
 71.6522  80.6977    2.7  23.3   51.0   1.1344   4.2 ------	UNKNOWN
277.7115  56.0604    2.8  56.9    6.4   5.5741   4.1 ------	UNKNOWN
324.6723  56.6447    2.3  39.2  -18.8   1.6104   5.0 ------	UNKNOWN
340.1037  34.2856    3.3  47.2  -53.3   3.7729   3.5 ------	UNKNOWN
Pre-slew background subtracted image of 15-350 keV band
Time interval of the image:
-5.360000 3.660000

# RAcent  DECcent POSerr Theta    Phi  PeakCts   SNR AngSep     Name
#  [deg]    [deg]    ['] [deg]  [deg]                   [']
 83.6356  22.0076    8.5  47.0  163.2  -0.1487  -1.4    0.4	Crab
308.0509  40.9359    4.5  57.9  -23.2   0.6079   2.6    2.9	Cyg X-3
326.0041  38.2950    5.5  51.3  -38.4   0.3482   2.1    8.0	Cyg X-2
 76.5810  56.7435    0.6  18.0  121.8   0.9301  19.2 ------	UNKNOWN
 33.9040  43.4999    2.1  16.4 -117.6   0.2474   5.5 ------	UNKNOWN
Post-slew image of 15-350 keV band
Time interval of the image:
51.996600 962.821800

# RAcent  DECcent POSerr Theta    Phi  PeakCts   SNR AngSep     Name
#  [deg]    [deg]    ['] [deg]  [deg]                   [']
 83.6341  22.0071    0.3  35.1 -178.0  36.3286  39.6    0.4	Crab
194.8543  66.2356    3.1  48.7   41.7  12.6939   3.7 ------	UNKNOWN
114.8286  20.6707    3.5  45.7  139.4   8.7845   3.2 ------	UNKNOWN
 48.9930  13.5949    2.8  48.0 -129.3  14.3885   4.1 ------	UNKNOWN
 31.9798  29.6497    5.8  41.1  -98.5   8.5091   2.0 ------	UNKNOWN
357.4774  46.5498    3.3  47.3  -53.4  14.2289   3.5 ------	UNKNOWN