Analysis Summary
Notes:
- 1) No attempt has been made to eliminate the non-significant decimal places.
- 2) This batgrbproduct analysis is done using the HEASARC data.
- 3) This batgrbproduct analysis is using the flight position for the mask-weighting calculation.
======================================================================
                  BAT GRB EVENT DATA PROCESSING REPORT
    Process Script Ver: batgrbproduct v2.46
    Process Start Time: Thu May 31 09:04:50 EDT 2018
             Host Name: bat1
   Current Working Dir: /local/data/bat1/alien/Swift_3rdBATcatalog/event/batevent_reproc/trigger817564
======================================================================

  Trigger: 00817564      Segment: 000

  BAT Trigger Time: 543635603.52   [s; MET]
      Trigger Stop: 543635604.032   [s; MET]
               UTC: 2018-03-25T01:53:02.842480    [includes UTCF correction]
       Where From?: TDRSS position message

  BAT
    RA: 157.431990917944   Dec: 24.4392523978687  [deg; J2000]

     Catalogged Source?: NO
     Point Source?:      YES
     GRB Indicated?:     YES    [ by BAT flight software ]
     Image S/N Ratio:    10.22
     Image Trigger?:     NO
     Rate S/N Ratio:     19.6468827043885  [ if not an image trigger ]
     Image S/N Ratio:    10.22

  Analysis Position:   [ source = BAT ]
    RA: 157.431990917944   Dec: 24.4392523978687  [deg; J2000]

  Refined Position:   [ source = BAT pre-slew burst ]
    RA: 157.416106976261   Dec: 24.4610275428613  [deg; J2000]
        { 10h 29m 39.9s , +24d 27' 39.7" }
         +/- 1.13616704732073 [arcmin] (estimated 90% radius based on SNR)
         +/- 0.456153674740327 [arcmin] (formal 1-sigma fit error)
    SNR: 25.3463397901683

  Angular difference between the analysis and refined position is 1.568325 arcmin

  Partial Coding Fraction: 0.8984375    [ including projection effects ]

  Duration
     T90: 92.8279999494553 +/- 1.51999085311522
        Measured from: 1.75199997425079
                   to: 94.5799999237061     [s; relative to TRIGTIME]
     T50: 5.0479998588562 +/- 0.488016404579719
        Measured from: 78.5960000753403
                   to: 83.6439999341965     [s; relative to TRIGTIME]


  Fluence
     Peak Flux  (peak 1 second)
        Measured from: 80.7519999742508
                   to: 81.7519999742508     [s; relative to TRIGTIME]
     Total Fluence
        Measured from: -0.00800001621246338
                   to: 107.888000011444     [s; relative to TRIGTIME]

             Band 1     Band 2     Band 3     Band 4
              15-25      25-50     50-100    100-350     keV
 Total     2.016937   3.416420   3.178550   0.875909
           0.068329   0.073198   0.065948   0.055128 [error]
 Peak      0.213220   0.406674   0.461865   0.171989
           0.010047   0.012983   0.013887   0.010496 [error]

     [ fluence units of on-axis counts / fully illuminated detector ]

======================================================================


====== Table of the duration information =============================

        Value   tstart    tstop
T100  107.896   -0.008  107.888
T90    92.828    1.752   94.580
T50     5.048   78.596   83.644
Peak    1.000   80.752   81.752


====== Spectral Analysis Summary =====================================

Model      : spectral model: simple power-law (PL) and cutoff power-law (CPL)
Ph_index   : photon index: E^{Ph_index}
Ph_90err   : 90% error of the photon index
Epeak      : Epeak in keV
Epeak_90err: 90% error of Epeak
Norm       : normalization at 50 keV in both the PL model and CPL model
Nomr_90err : 90% error of the normalization
chi2       : Chi-Squared
dof        : degree of freedo

=== Time-averaged spectral analysis ===
(Best model with acceptable fit: PL)

Model Ph_index Ph_90err_low Ph_90err_hi  Epeak  Epeak_90err_low  Epeak_90err_hi  Norm       Nomr_90err_low    Norm_90err_hi    chi2    dof
PL      -1.203    -0.046      0.047       -           -               -         5.84e-03     -1.47e-04          1.47e-04      68.730   57
CPL     -0.974    -0.181      0.189      257.581     -89.999       653.615      7.37e-03     -1.21e-03          1.50e-03      64.040   56


=== 1-s peak spectral analysis ===
(Best model with acceptable fit: N/A)

Model Ph_index Ph_90err_low Ph_90err_hi  Epeak  Epeak_90err_low  Epeak_90err_hi  Norm       Nomr_90err_low    Norm_90err_hi    chi2    dof
PL      -0.895     -0.061     0.061       -           -               -         8.14e-02     -2.78e-03          2.78e-03      42.450   57
CPL     -0.845     -0.076     0.243      999.724    -999.724      -999.724      8.73e-02     -8.12e-03          2.04e-02      42.590   56


=== Fluence/Peak Flux Summary ===

              Model    Band1     Band2     Band3     Band4     Band5     Total
                       15-25     25-50    50-100    100-350    15-150    15-350    keV
Fluence         PL   6.10e-07  1.35e-06  2.34e-06  9.44e-06  6.39e-06  1.37e-05   erg/cm2
      90%_error_low -3.21e-08 -4.17e-08 -6.62e-08 -6.16e-07 -1.69e-07 -6.46e-07   erg/cm2
      90%_error_hi   3.28e-08  4.15e-08  6.61e-08  6.46e-07  1.69e-07  6.72e-07   erg/cm2
Peak flux       PL   1.07e-03  1.09e-02  1.19e-01  1.29e+01  5.32e-01  1.27e+01   ph/cm2/s
      90%_error_low     N/A       N/A       N/A       N/A       N/A       N/A     ph/cm2/s
      90%_error_hi      N/A       N/A       N/A       N/A       N/A       N/A     ph/cm2/s

Fluence        CPL   5.74e-07  1.36e-06  2.39e-06  7.01e-06  6.31e-06  1.13e-05   erg/cm2
      90%_error_low -4.16e-08 -4.40e-08 -7.75e-08 -1.41e-06 -1.82e-07 -1.41e-06   erg/cm2
      90%_error_hi   4.24e-08  4.42e-08  7.81e-08  1.85e-06  1.82e-07  1.83e-06   erg/cm2
Peak flux      CPL   1.86e+00  2.74e+00  2.96e+00  5.87e+00  9.33e+00  1.30e+01   ph/cm2/s
      90%_error_low -2.03e-01 -1.42e-01 -1.39e-01 -1.55e+00 -3.53e-01 -1.15e+00   ph/cm2/s
      90%_error_hi   1.51e-01  1.08e-01  1.24e-01  4.46e-01  3.34e-01  8.93e-01   ph/cm2/s

======================================================================
Image
Pre-slew 15.0-350.0 keV image (Event data)
#   RAcent    DECcent   POSerr    Theta     Phi              Peak Cts       SNR   Name
  157.4161    24.4610   0.0076    15.5980   138.0259         1.1542966     25.346 TRIG_00817564

Foreground time interval of the image:
 -0.008  10.981 (delta_t =  10.989 [sec])
Background time interval of the image:
-239.520  -0.008 (delta_t = 239.512 [sec])
Light Curves
Note: The mask-weighted lightcurves have units of either count/det or counts/sec/det, where a det is 0.4 x 0.4 = 0.16 sq cm.
Full-time range; 1 s binning
Other quick-look light curves:
- 64 ms binning (zoomed)
- 16 ms binning (zoomed)
- 8 ms binning (zoomed)
- 2 ms binning (zoomed)
- SN=5 or 10 s binning (full-time range)
- Raw light curve
Spectra
- 64 ms binning (zoomed)
- 16 ms binning (zoomed)
- 8 ms binning (zoomed)
- 2 ms binning (zoomed)
- SN=5 or 10 s binning (full-time range)
- Raw light curve
Spectra
Notes:
- 1) The fitting includes the systematic errors.
- 2) When the burst includes telescope slew time periods, the fitting uses an average response file made from multiple 5-s response files through out the slew time plus single time preiod for the non-slew times, and weighted by the total counts in the corresponding time period using addrmf. An average response file is needed becuase a spectral fit using the pre-slew DRM will introduce some errors in both a spectral shape and a normalization if the PHA file contains a lot of the slew/post-slew time interval.
- 3) For fits to more complicated models (e.g. a power-law over a cutoff power-law), the BAT team has decided to require a chi-square improvement of more than 6 for each extra dof.
Time averaged spectrum fit using the average DRM
Power-law model
Time interval is from   -0.008 sec. to  107.888 sec.

Spectral model in power-law:
------------------------------------------------------------
Parameters  : value       lower 90%   higher 90%
Photon index: -1.20313     ( -0.0463018   0.0465214 )
Norm@50keV  : 5.84403E-03    ( -0.000146609   0.000146519 )
------------------------------------------------------------
#Fit statistic : Chi-Squared =          68.73 using 59 PHA bins.
# Reduced chi-squared =          1.206 for     57 degrees of freedom
# Null hypothesis probability =   1.373264e-01

Photon flux (15-150 keV)    in 107.9 sec: 0.686277 ( -0.018442  0.018479 ) ph/cm2/s
Energy fluence (15-150 keV)             : 6.39251e-06 ( -1.68774e-07  1.68961e-07 ) ergs/cm2
Cutoff power-law model
Time interval is from   -0.008 sec. to  107.888 sec.
Spectral model in the cutoff power-law:
------------------------------------------------------------
Parameters  : value       lower 90%   higher 90%
Photon index: -0.974174     ( -0.181311   0.189091 )
Epeak [keV] : 257.581      ( -89.9997 653.615 )
Norm@50keV  : 7.36735E-03    ( -0.00120593   0.00150441 )
------------------------------------------------------------
#Fit statistic : Chi-Squared =          64.04 using 59 PHA bins.
# Reduced chi-squared =          1.144 for     56 degrees of freedom
# Null hypothesis probability =   2.152852e-01

Photon flux (15-150 keV)    in 107.9 sec: 0.676321 ( -0.019905  0.019952 ) ph/cm2/s
Energy fluence (15-150 keV)             : 6.30786e-06 ( -1.82498e-07  1.81946e-07 ) ergs/cm2
1-s peak spectrum fit
Power-law model
Time interval is from   80.752 sec. to   81.752 sec.

Spectral model in power-law:
------------------------------------------------------------
Parameters  : value       lower 90%   higher 90%
Photon index: -0.894609     ( -0.0610197   0.0614754 )
Norm@50keV  : 8.13693E-02    ( -0.00278375   0.002778 )
------------------------------------------------------------
#Fit statistic : Chi-Squared =          42.45 using 59 PHA bins.
# Reduced chi-squared =         0.7448 for     57 degrees of freedom
# Null hypothesis probability =   9.244453e-01

Photon flux (15-150 keV)    in 1 sec: 0.532126 (    ) ph/cm2/s
Energy fluence (15-150 keV)             : 9.15208e-07 ( -3.46256e-08  3.46966e-08 ) ergs/cm2
Cutoff power-law model

Time interval is from   80.752 sec. to   81.752 sec.
Spectral model in the cutoff power-law:
------------------------------------------------------------
Parameters  : value       lower 90%   higher 90%
Photon index: -0.888047     ( -0.0755213   0.242769 )
Epeak [keV] : 9998.05      ( -9997.94 -9997.94 )
Norm@50keV  : 8.19098E-02    ( -0.00275941   0.0257647 )
------------------------------------------------------------
#Fit statistic : Chi-Squared =          42.42 using 59 PHA bins.
# Reduced chi-squared =         0.7575 for     56 degrees of freedom
# Null hypothesis probability =   9.099090e-01

Photon flux (15-150 keV)    in 1 sec: 9.32553 ( -0.35272  0.33363 ) ph/cm2/s
Energy fluence (15-150 keV)             : 9.13755e-07 ( -3.64108e-08  3.42268e-08 ) ergs/cm2
Time-resolved spectra
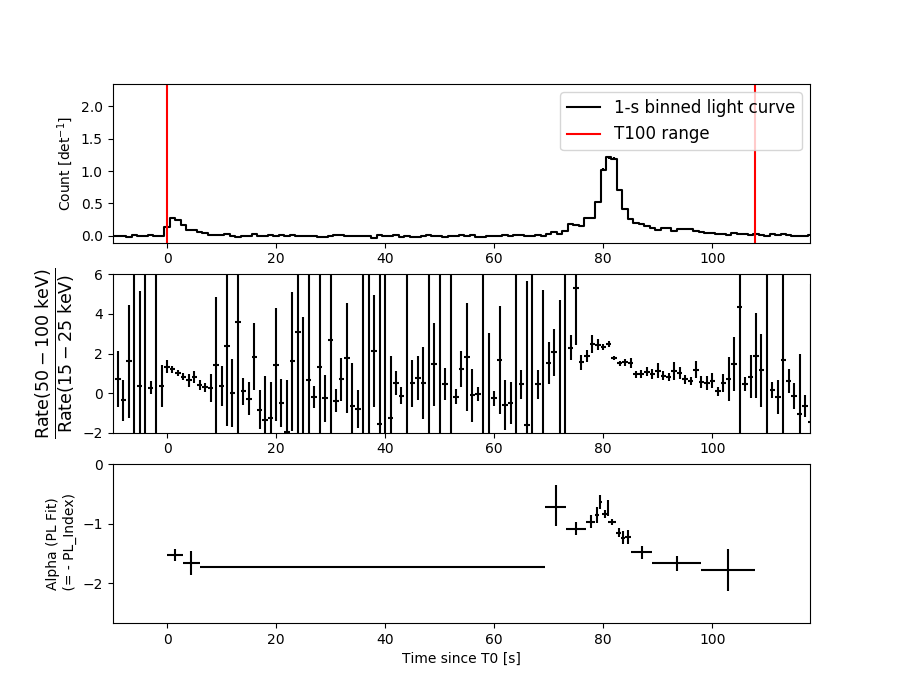
Distribution
T90 vs. Hardness ratio plot
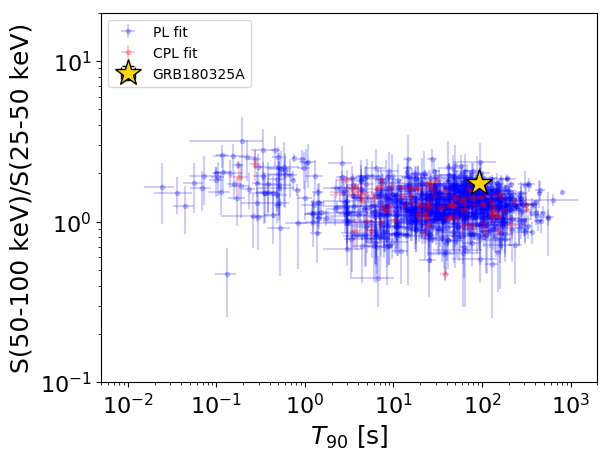
T90                                   = 92.828 sec.
Hardness ratio (energy fluence ratio) = 1.73735998805
S(15-50 keV) vs. S(50-150 keV) plot
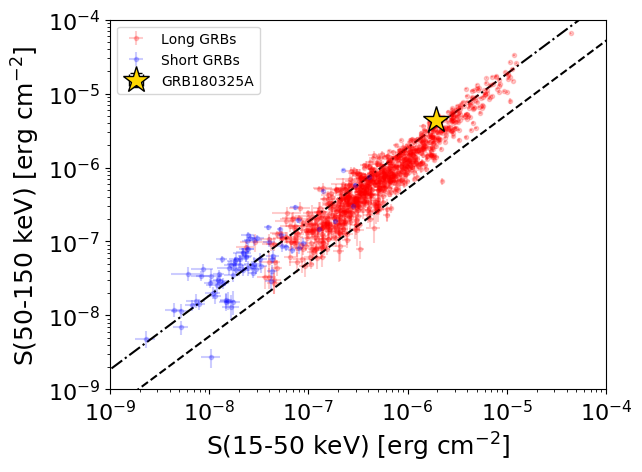
S(15-50 keV)  = 1.9552536e-06
S(50-150 keV) = 4.437218e-06
The dash-dotted line and the dashed line traces the fluences calculated from the Band function with Epeak = 15 and 150 keV, respectively. Both lines assume a canonical values of alpha = -1 and beta = -2.5.
Mask shadow pattern
IMX = -2.075458038916739E-01, IMY = -1.867052018994906E-01
Spacecraft aspect plot
Bright source in the pre-burst/pre-slew/post-slew images
Pre-burst image of 15-350 keV band
Time interval of the image:
-239.520000 -0.008000

# RAcent  DECcent POSerr Theta    Phi  PeakCts   SNR AngSep     Name
#  [deg]    [deg]    ['] [deg]  [deg]                   [']
172.5223  -2.1378    2.5  40.8   97.4   4.8228   4.6 ------	UNKNOWN
167.3886   2.8551    2.9  35.4  105.0   1.8984   3.9 ------	UNKNOWN
164.2872   2.5492    2.9  35.7  110.4   2.1429   4.0 ------	UNKNOWN
230.7105  24.4635    3.7  55.7   11.4   4.1768   3.1 ------	UNKNOWN
203.8386  30.3898    3.2  31.9   19.9   1.1230   3.7 ------	UNKNOWN
213.1964  45.9116    3.3  35.3  -10.8   1.0209   3.6 ------	UNKNOWN
105.6313  15.1720    2.7  57.6 -168.8   6.4512   4.2 ------	UNKNOWN
152.4292  56.1749    2.8  20.2  -95.2   1.1304   4.1 ------	UNKNOWN
113.9956  39.1014    3.2  40.1 -144.6   1.4519   3.5 ------	UNKNOWN
107.4718  61.6884    2.9  42.4 -109.7   4.3102   4.0 ------	UNKNOWN
102.1544  53.7584    2.5  45.4 -121.0   5.2230   4.7 ------	UNKNOWN
Pre-slew background subtracted image of 15-350 keV band
Time interval of the image:
-0.008000 10.980600

# RAcent  DECcent POSerr Theta    Phi  PeakCts   SNR AngSep     Name
#  [deg]    [deg]    ['] [deg]  [deg]                   [']
157.4161  24.4610    0.5  15.6  138.0   1.1543  25.3 ------	UNKNOWN
Post-slew image of 15-350 keV band
Time interval of the image:
61.380600 602.560000

# RAcent  DECcent POSerr Theta    Phi  PeakCts   SNR AngSep     Name
#  [deg]    [deg]    ['] [deg]  [deg]                   [']
217.8901  40.9316    3.1  52.4   14.6   4.1199   3.7 ------	UNKNOWN
157.4512  24.4745    0.4   0.0   18.3   8.5206  28.3 ------	UNKNOWN
128.6968   0.2678    2.2  36.9 -168.2   2.1008   5.3 ------	UNKNOWN
135.0109  47.2885    3.8  29.0  -73.7   1.4824   3.1 ------	UNKNOWN
111.7425  39.6340    5.7  41.1  -98.4   2.8500   2.1 ------	UNKNOWN