Analysis Summary
Notes:
- 1) No attempt has been made to eliminate the non-significant decimal places.
- 2) This batgrbproduct analysis is done using the HEASARC data.
- 3) This batgrbproduct analysis is using the flight position for the mask-weighting calculation.
======================================================================
BAT GRB EVENT DATA PROCESSING REPORT
Process Script Ver: batgrbproduct v2.46
Process Start Time: Wed May 30 16:01:48 EDT 2018
Host Name: bat1
Current Working Dir: /local/data/bat1/alien/Swift_3rdBATcatalog/event/batevent_reproc/trigger819301
======================================================================
Trigger: 00819301 Segment: 000
BAT Trigger Time: 543977901.504 [s; MET]
Trigger Stop: 543977909.696 [s; MET]
UTC: 2018-03-29T00:58:00.805800 [includes UTCF correction]
Where From?: TDRSS position message
BAT
RA: 329.297998471192 Dec: -15.0707756964668 [deg; J2000]
Catalogged Source?: NO
Point Source?: YES
GRB Indicated?: YES [ by BAT flight software ]
Image S/N Ratio: 6.9
Image Trigger?: NO
Rate S/N Ratio: 9.59166304662544 [ if not an image trigger ]
Image S/N Ratio: 6.9
Analysis Position: [ source = BAT ]
RA: 329.297998471192 Dec: -15.0707756964668 [deg; J2000]
Refined Position: [ source = BAT pre-slew burst ]
RA: 329.296632171678 Dec: -15.1056178798433 [deg; J2000]
{ 21h 57m 11.2s , -15d 06' 20.2" }
+/- 2.49942751046552 [arcmin] (estimated 90% radius based on SNR)
+/- 1.29312659436897 [arcmin] (formal 1-sigma fit error)
SNR: 8.21816285739399
Angular difference between the analysis and refined position is 2.092029 arcmin
Partial Coding Fraction: 0.8125 [ including projection effects ]
Duration
T90: 36 +/- 7.28010988928052
Measured from: -0.503999948501587
to: 35.4960000514984 [s; relative to TRIGTIME]
T50: 19 +/- 11.1803398874989
Measured from: 2.49600005149841
to: 21.4960000514984 [s; relative to TRIGTIME]
Fluence
Peak Flux (peak 1 second)
Measured from: 0.496000051498413
to: 1.49600005149841 [s; relative to TRIGTIME]
Total Fluence
Measured from: -0.503999948501587
to: 39.4960000514984 [s; relative to TRIGTIME]
Band 1 Band 2 Band 3 Band 4
15-25 25-50 50-100 100-350 keV
Total 0.232054 0.205690 0.119308 0.023484
0.040123 0.041141 0.035310 0.029233 [error]
Peak 0.029043 0.001151 0.023561 0.006947
0.006402 0.006748 0.006034 0.004835 [error]
[ fluence units of on-axis counts / fully illuminated detector ]
======================================================================
====== Table of the duration information =============================
Value tstart tstop
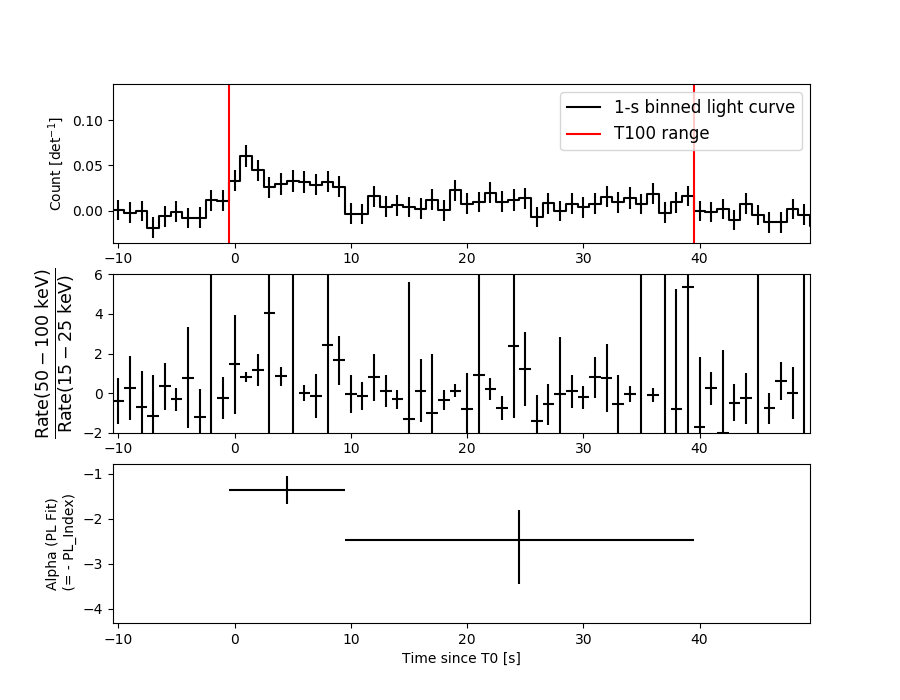
T100 40.000 -0.504 39.496
T90 36.000 -0.504 35.496
T50 19.000 2.496 21.496
Peak 1.000 0.496 1.496
====== Spectral Analysis Summary =====================================
Model : spectral model: simple power-law (PL) and cutoff power-law (CPL)
Ph_index : photon index: E^{Ph_index}
Ph_90err : 90% error of the photon index
Epeak : Epeak in keV
Epeak_90err: 90% error of Epeak
Norm : normalization at 50 keV in both the PL model and CPL model
Nomr_90err : 90% error of the normalization
chi2 : Chi-Squared
dof : degree of freedo
=== Time-averaged spectral analysis ===
(Best model with acceptable fit: PL)
Model Ph_index Ph_90err_low Ph_90err_hi Epeak Epeak_90err_low Epeak_90err_hi Norm Nomr_90err_low Norm_90err_hi chi2 dof
PL -1.898 -0.382 0.344 - - - 8.73e-04 -2.20e-04 2.11e-04 42.810 57
CPL -1.064 -1.220 1.935 48.313 N/A N/A 2.60e-03 N/A N/A 41.830 56
=== 1-s peak spectral analysis ===
(Best model with acceptable fit: N/A)
Model Ph_index Ph_90err_low Ph_90err_hi Epeak Epeak_90err_low Epeak_90err_hi Norm Nomr_90err_low Norm_90err_hi chi2 dof
PL -0.997 -0.844 0.948 - - - 3.77e-03 -1.57e-03 1.31e-03 64.020 57
CPL -1.049 -0.797 1.177 9999.360 -9999.360 -9999.360 3.82e-03 N/A N/A 64.060 56
=== Fluence/Peak Flux Summary ===
Model Band1 Band2 Band3 Band4 Band5 Total
15-25 25-50 50-100 100-350 15-150 15-350 keV
Fluence PL 6.49e-08 9.36e-08 1.00e-07 2.01e-07 3.21e-07 4.60e-07 erg/cm2
90%_error_low -1.72e-08 -1.86e-08 -3.30e-08 -1.05e-07 -7.68e-08 -1.48e-07 erg/cm2
90%_error_hi 1.79e-08 1.85e-08 3.41e-08 1.61e-07 7.98e-08 1.92e-07 erg/cm2
Peak flux PL 9.56e-02 1.30e-01 1.31e-01 2.39e-01 4.34e-01 5.95e-01 ph/cm2/s
90%_error_low -7.14e-02 -7.30e-02 -5.42e-02 -1.72e-01 -1.63e-01 -2.12e-01 ph/cm2/s
90%_error_hi 1.06e-01 6.34e-02 4.65e-02 3.56e-01 1.62e-01 2.64e-01 ph/cm2/s
Fluence CPL 6.01e-08 1.04e-07 9.91e-08 5.74e-08 3.00e-07 3.21e-07 erg/cm2
90%_error_low -2.04e-08 -2.17e-08 -3.91e-08 -5.07e-08 -7.73e-08 -9.65e-08 erg/cm2
90%_error_hi 1.99e-08 2.67e-08 3.79e-08 1.83e-07 8.68e-08 2.06e-07 erg/cm2
Peak flux CPL N/A N/A N/A N/A N/A N/A ph/cm2/s
90%_error_low -7.14e-02 -7.30e-02 -5.42e-02 -1.72e-01 -1.63e-01 -2.12e-01 ph/cm2/s
90%_error_hi 1.06e-01 6.34e-02 4.65e-02 3.56e-01 1.62e-01 2.64e-01 ph/cm2/s
======================================================================
Image
Pre-slew 15.0-350.0 keV image (Event data)
#   RAcent    DECcent   POSerr    Theta     Phi              Peak Cts       SNR   Name
  329.2966   -15.1056   0.0235    23.1353   -48.1885         0.6218219      8.218 TRIG_00819301

Foreground time interval of the image:
 -0.504  39.496 (delta_t =  40.000 [sec])
Background time interval of the image:
-239.504  -0.504 (delta_t = 239.000 [sec])
Light Curves
Note: The mask-weighted lightcurves have units of either count/det or counts/sec/det, where a det is 0.4 x 0.4 = 0.16 sq cm.
Full-time range; 1 s binning
Other quick-look light curves:
- 64 ms binning (zoomed)
- 16 ms binning (zoomed)
- 8 ms binning (zoomed)
- 2 ms binning (zoomed)
- SN=5 or 10 s binning (full-time range)
- Raw light curve
Spectra
- 64 ms binning (zoomed)
- 16 ms binning (zoomed)
- 8 ms binning (zoomed)
- 2 ms binning (zoomed)
- SN=5 or 10 s binning (full-time range)
- Raw light curve
Spectra
Notes:
- 1) The fitting includes the systematic errors.
- 2) When the burst includes telescope slew time periods, the fitting uses an average response file made from multiple 5-s response files through out the slew time plus single time preiod for the non-slew times, and weighted by the total counts in the corresponding time period using addrmf. An average response file is needed becuase a spectral fit using the pre-slew DRM will introduce some errors in both a spectral shape and a normalization if the PHA file contains a lot of the slew/post-slew time interval.
- 3) For fits to more complicated models (e.g. a power-law over a cutoff power-law), the BAT team has decided to require a chi-square improvement of more than 6 for each extra dof.
Time averaged spectrum fit using the average DRM
Power-law model
Time interval is from   -0.504 sec. to   39.496 sec.

Spectral model in power-law:
------------------------------------------------------------
Parameters  : value       lower 90%   higher 90%
Photon index: -1.89774     ( -0.381705   0.343775 )
Norm@50keV  : 8.72934E-04    ( -0.000219859   0.000211032 )
------------------------------------------------------------
#Fit statistic : Chi-Squared =          42.81 using 59 PHA bins.
# Reduced chi-squared =         0.7510 for     57 degrees of freedom
# Null hypothesis probability =   9.185110e-01

Photon flux (15-150 keV)    in 40 sec: 0.125163 ( -0.024613  0.024613 ) ph/cm2/s
Energy fluence (15-150 keV)             : 3.2107e-07 ( -7.68056e-08  7.97504e-08 ) ergs/cm2
Cutoff power-law model
Time interval is from   -0.504 sec. to   39.496 sec.
Spectral model in the cutoff power-law:
------------------------------------------------------------
Parameters  : value       lower 90%   higher 90%
Photon index: -1.06359     ( -1.22045   1.93535 )
Epeak [keV] : 48.3132      (   )
Norm@50keV  : 2.60101E-03    (     )
------------------------------------------------------------
#Fit statistic : Chi-Squared =          41.83 using 59 PHA bins.
# Reduced chi-squared =         0.7469 for     56 degrees of freedom
# Null hypothesis probability =   9.204591e-01

Photon flux (15-150 keV)    in 40 sec: 0.122164 ( -0.0250855  0.025115 ) ph/cm2/s
Energy fluence (15-150 keV)             : 2.99509e-07 ( -7.72756e-08  8.68488e-08 ) ergs/cm2
1-s peak spectrum fit
Power-law model
Time interval is from    0.496 sec. to    1.496 sec.

Spectral model in power-law:
------------------------------------------------------------
Parameters  : value       lower 90%   higher 90%
Photon index: -0.99674     ( -0.846271   0.945271 )
Norm@50keV  : 3.77292E-03    ( -0.00157285   0.00131531 )
------------------------------------------------------------
#Fit statistic : Chi-Squared =          64.02 using 59 PHA bins.
# Reduced chi-squared =          1.123 for     57 degrees of freedom
# Null hypothesis probability =   2.436615e-01

Photon flux (15-150 keV)    in 1 sec: 0.433911 ( -0.162848  0.162363 ) ph/cm2/s
Energy fluence (15-150 keV)             : 4.08846e-08 ( -1.53676e-08  1.501e-08 ) ergs/cm2
Cutoff power-law model

Time interval is from    0.496 sec. to    1.496 sec.
Spectral model in the cutoff power-law:
------------------------------------------------------------
Parameters  : value       lower 90%   higher 90%
Photon index: -0.998506     ( -0.799157   1.17462 )
Epeak [keV] : 1.00000E+04      ( -10000 -10000 )
Norm@50keV  : 3.79667E-03    (     )
------------------------------------------------------------
#Fit statistic : Chi-Squared =          64.04 using 59 PHA bins.
# Reduced chi-squared =          1.144 for     56 degrees of freedom
# Null hypothesis probability =   2.151987e-01

Photon flux (15-150 keV)    in 1 sec:  (    ) ph/cm2/s
Energy fluence (15-150 keV)             : 1.23575e-08 ( 0  0 ) ergs/cm2
Time-resolved spectra
Distribution
T90 vs. Hardness ratio plot
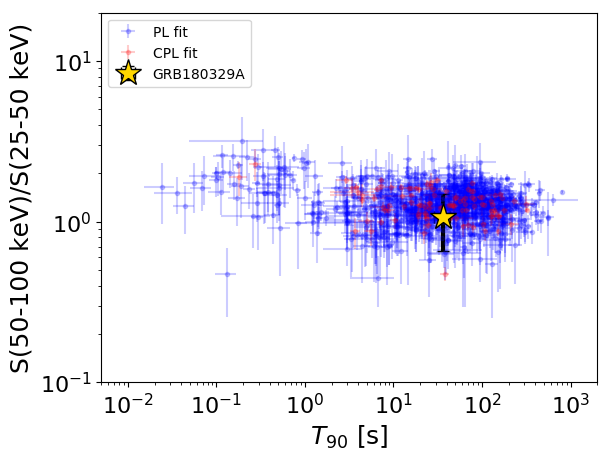
T90                                   = 36.0 sec.
Hardness ratio (energy fluence ratio) = 1.07349472359
S(15-50 keV) vs. S(50-150 keV) plot
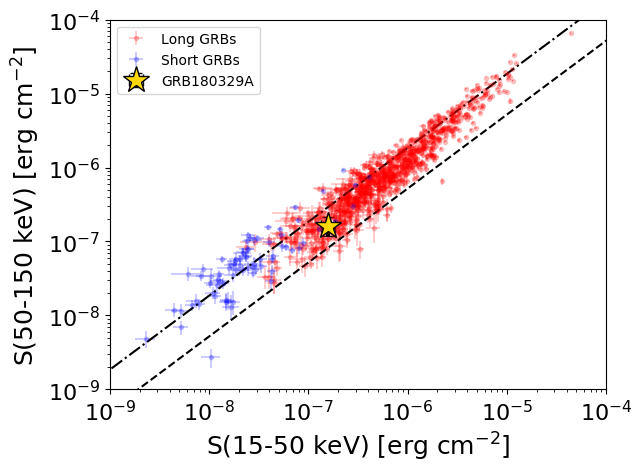
S(15-50 keV)  = 1.584446e-07
S(50-150 keV) = 1.626255e-07
The dash-dotted line and the dashed line traces the fluences calculated from the Band function with Epeak = 15 and 150 keV, respectively. Both lines assume a canonical values of alpha = -1 and beta = -2.5.
Mask shadow pattern
IMX = 2.848493244959475E-01, IMY = 3.184577990928796E-01
Spacecraft aspect plot
Bright source in the pre-burst/pre-slew/post-slew images
Pre-burst image of 15-350 keV band
Time interval of the image:
-239.504000 -0.504000

# RAcent  DECcent POSerr Theta    Phi  PeakCts   SNR AngSep     Name
#  [deg]    [deg]    ['] [deg]  [deg]                   [']
273.9977 -14.0885   13.5  40.1   66.7  -1.5418  -0.8    3.2	GX 17+2
276.0729 -30.4943    4.2  45.8   43.9  -4.4142  -2.7   10.8	H1820-303
285.0360 -24.9205 2700.0  36.2   43.2  -0.0005  -0.0    0.0	HT1900.1-2455
288.7148  10.9219    1.8  25.3  114.9   3.3431   6.3    5.1	GRS 1915+105
299.5858  35.2041    1.1  36.7  162.5   5.8794  10.1    0.3	Cyg X-1
307.9628  40.9547 2700.0  40.8  174.9   0.0010   0.0    6.7	Cyg X-3
326.1125  38.3611    6.4  40.3 -163.3   0.8958   1.8    3.7	Cyg X-2
275.0826   7.1837    0.5  37.3  100.8  34.6773  23.8 ------	UNKNOWN
337.2062 -55.6681    4.3  59.6  -16.9   4.9553   2.7 ------	UNKNOWN
352.6176   1.2571    2.6  40.8  -92.3   5.2772   4.5  449.3	UNKNOWN
352.9959  27.7661    2.7  48.0 -129.1   5.9014   4.2 ------	UNKNOWN
Pre-slew background subtracted image of 15-350 keV band
Time interval of the image:
-0.504000 39.496000

# RAcent  DECcent POSerr Theta    Phi  PeakCts   SNR AngSep     Name
#  [deg]    [deg]    ['] [deg]  [deg]                   [']
273.8572 -13.8841    0.0  40.2   67.1   0.9387   3.0   12.6	GX 17+2
275.9278 -30.3688  107.6  45.9   44.1   0.0349   0.1    0.2	H1820-303
285.1844 -25.0124    5.2  36.1   42.9  -0.3394  -2.2    9.8	HT1900.1-2455
288.8161  11.0854    3.6  25.3  115.4  -0.3553  -3.3    8.5	GRS 1915+105
299.6301  35.2576   12.8  36.8  162.6  -0.1052  -0.9    3.9	Cyg X-1
308.0701  40.9307    4.4  40.8  175.0   0.3601   2.6    2.2	Cyg X-3
326.3067  38.2681    9.1  40.2 -163.0   0.1473   1.3    7.1	Cyg X-2
277.8713  31.1553    2.7  44.6  136.4   1.3756   4.2 ------	UNKNOWN
329.2966 -15.1058    1.4  23.1  -48.2   0.6217   8.2 ------	UNKNOWN
342.7921 -28.4462    1.8  41.3  -44.0   0.7754   6.3 ------	UNKNOWN
Post-slew image of 15-350 keV band
Time interval of the image:
546.796590 778.279400
779.496000 939.196600

# RAcent  DECcent POSerr Theta    Phi  PeakCts   SNR AngSep     Name
#  [deg]    [deg]    ['] [deg]  [deg]                   [']
 83.6411  21.9998    0.4  37.6  167.5  14.8735  28.1    1.0	Crab
 62.7865  67.5427    2.9  13.8   38.2   1.2818   4.0 ------	UNKNOWN
335.4271  75.8857    2.9  36.5    5.7   1.8113   4.0 ------	UNKNOWN
 44.2155   5.4491    3.7  49.7 -133.0   5.8015   3.1 ------	UNKNOWN