Analysis Summary
Notes:
- 1) No attempt has been made to eliminate the non-significant decimal places.
- 2) This batgrbproduct analysis is done using the HEASARC data.
- 3) This batgrbproduct analysis is using the flight position for the mask-weighting calculation.
======================================================================
                  BAT GRB EVENT DATA PROCESSING REPORT
    Process Script Ver: batgrbproduct v2.46
    Process Start Time: Wed May 30 15:56:01 EDT 2018
             Host Name: bat1
   Current Working Dir: /local/data/bat1/alien/Swift_3rdBATcatalog/event/batevent_reproc/trigger820347
======================================================================

  Trigger: 00820347      Segment: 000

  BAT Trigger Time: 544162516.416   [s; MET]
      Trigger Stop: 544162524.608   [s; MET]
               UTC: 2018-03-31T04:14:55.706640    [includes UTCF correction]
       Where From?: TDRSS position message

  BAT
    RA: 66.0170123130039   Dec: 13.3978789028324  [deg; J2000]

     Catalogged Source?: NO
     Point Source?:      YES
     GRB Indicated?:     YES    [ by BAT flight software ]
     Image S/N Ratio:    8.89
     Image Trigger?:     NO
     Rate S/N Ratio:     10.9087121146357  [ if not an image trigger ]
     Image S/N Ratio:    8.89

  Analysis Position:   [ source = BAT ]
    RA: 66.0170123130039   Dec: 13.3978789028324  [deg; J2000]

  Refined Position:   [ source = BAT pre-slew burst ]
    RA: 66.0054627531874   Dec: 13.3860368829264  [deg; J2000]
        { 04h 24m 01.3s , +13d 23' 09.7" }
         +/- 1.93529991572351 [arcmin] (estimated 90% radius based on SNR)
         +/- 0.736452311016497 [arcmin] (formal 1-sigma fit error)
    SNR: 11.8434432467337

  Angular difference between the analysis and refined position is 0.979435 arcmin

  Partial Coding Fraction: 0.8125    [ including projection effects ]

  Duration
     T90: 48 +/- 22.6274169979695
        Measured from: 0.583999991416931
                   to: 48.5839999914169     [s; relative to TRIGTIME]
     T50: 32 +/- 16
        Measured from: 0.583999991416931
                   to: 32.5839999914169     [s; relative to TRIGTIME]


  Fluence
     Peak Flux  (peak 1 second)
        Measured from: 8.08399999141693
                   to: 9.08399999141693     [s; relative to TRIGTIME]
     Total Fluence
        Measured from: 0.583999991416931
                   to: 48.5839999914169     [s; relative to TRIGTIME]

             Band 1     Band 2     Band 3     Band 4
              15-25      25-50     50-100    100-350     keV
 Total     0.224202   0.456051   0.290528   0.052106
           0.042613   0.044133   0.038707   0.034724 [error]
 Peak      0.008201   0.027548   0.024281   0.000195
           0.005956   0.006561   0.005766   0.005023 [error]

     [ fluence units of on-axis counts / fully illuminated detector ]

======================================================================


====== Table of the duration information =============================

        Value   tstart    tstop
T100   48.000    0.584   48.584
T90    48.000    0.584   48.584
T50    32.000    0.584   32.584
Peak    1.000    8.084    9.084


====== Spectral Analysis Summary =====================================

Model      : spectral model: simple power-law (PL) and cutoff power-law (CPL)
Ph_index   : photon index: E^{Ph_index}
Ph_90err   : 90% error of the photon index
Epeak      : Epeak in keV
Epeak_90err: 90% error of Epeak
Norm       : normalization at 50 keV in both the PL model and CPL model
Nomr_90err : 90% error of the normalization
chi2       : Chi-Squared
dof        : degree of freedo

=== Time-averaged spectral analysis ===
(Best model with acceptable fit: PL)

Model Ph_index Ph_90err_low Ph_90err_hi  Epeak  Epeak_90err_low  Epeak_90err_hi  Norm       Nomr_90err_low    Norm_90err_hi    chi2    dof
PL      -1.471    -0.195      0.193       -           -               -         1.50e-03     -1.83e-04          1.82e-04      64.300   57
CPL     -0.176    -0.910      1.165       66.415     -13.606        48.098      7.20e-03     -7.20e-03          2.19e-02      57.910   56


=== 1-s peak spectral analysis ===
(Best model with acceptable fit: PL)

Model Ph_index Ph_90err_low Ph_90err_hi  Epeak  Epeak_90err_low  Epeak_90err_hi  Norm       Nomr_90err_low    Norm_90err_hi    chi2    dof
PL      -1.132     -0.417     0.441       -           -               -         4.68e-03     -1.24e-03          1.24e-03      51.310   57
CPL      0.814     -2.067     3.939       77.179     -22.835       -77.179      3.84e-02     -3.84e-02          1.82e+00      48.910   56


=== Fluence/Peak Flux Summary ===

              Model    Band1     Band2     Band3     Band4     Band5     Total
                       15-25     25-50    50-100    100-350    15-150    15-350    keV
Fluence         PL   8.94e-08  1.67e-07  2.41e-07  7.39e-07  6.86e-07  1.24e-06   erg/cm2
      90%_error_low -1.66e-08 -2.04e-08 -3.75e-08 -2.13e-07 -9.14e-08 -2.50e-07   erg/cm2
      90%_error_hi   1.73e-08  2.03e-08  3.75e-08  2.65e-07  9.27e-08  2.92e-07   erg/cm2
Peak flux       PL   1.36e-01  1.70e-01  1.55e-01  2.47e-01  5.45e-01  7.07e-01   ph/cm2/s
      90%_error_low -6.11e-02 -5.38e-02 -4.52e-02 -1.19e-01 -1.48e-01 -1.92e-01   ph/cm2/s
      90%_error_hi   7.15e-02  5.27e-02  4.46e-02  1.74e-01  1.49e-01  2.00e-01   ph/cm2/s

Fluence        CPL   7.45e-08  1.92e-07  2.49e-07  1.47e-07  6.15e-07  6.63e-07   erg/cm2
      90%_error_low -1.97e-08 -2.70e-08 -4.56e-08 -9.57e-08 -9.86e-08 -1.36e-07   erg/cm2
      90%_error_hi   2.02e-08  2.84e-08  4.42e-08  2.68e-07  1.04e-07  2.75e-07   erg/cm2
Peak flux      CPL   8.72e-02  1.92e-01  1.82e-01  5.87e-02  5.08e-01  5.20e-01   ph/cm2/s
      90%_error_low -6.69e-02 -6.74e-02 -5.69e-02 -5.87e-02 -1.55e-01 -1.66e-01   ph/cm2/s
      90%_error_hi   8.72e-02  6.96e-02  5.99e-02  2.37e-01  1.56e-01  2.53e-01   ph/cm2/s

======================================================================
Image
Pre-slew 15.0-350.0 keV image (Event data)
#   RAcent    DECcent   POSerr    Theta     Phi              Peak Cts       SNR   Name
   66.0055    13.3860   0.0163    24.6400  -141.1272         1.0734494     11.843 TRIG_00820347

Foreground time interval of the image:
  0.584  48.584 (delta_t =  48.000 [sec])
Background time interval of the image:
-200.115   0.584 (delta_t = 200.699 [sec])
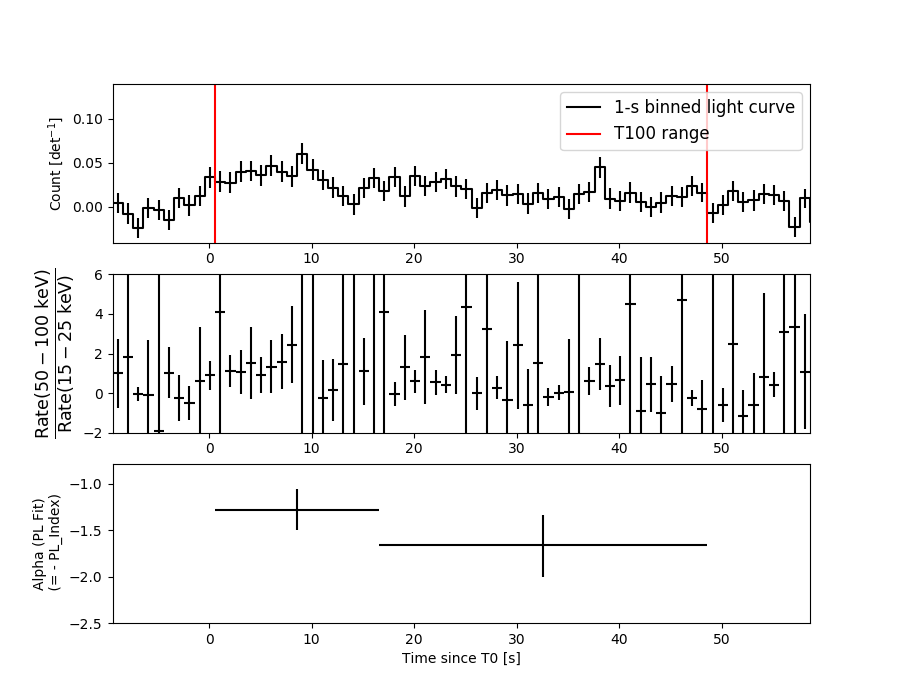
Light Curves
Note: The mask-weighted lightcurves have units of either count/det or counts/sec/det, where a det is 0.4 x 0.4 = 0.16 sq cm.
Full-time range; 1 s binning
Other quick-look light curves:
- 64 ms binning (zoomed)
- 16 ms binning (zoomed)
- 8 ms binning (zoomed)
- 2 ms binning (zoomed)
- SN=5 or 10 s binning (full-time range)
- Raw light curve
Spectra
- 64 ms binning (zoomed)
- 16 ms binning (zoomed)
- 8 ms binning (zoomed)
- 2 ms binning (zoomed)
- SN=5 or 10 s binning (full-time range)
- Raw light curve
Spectra
Notes:
- 1) The fitting includes the systematic errors.
- 2) When the burst includes telescope slew time periods, the fitting uses an average response file made from multiple 5-s response files through out the slew time plus single time preiod for the non-slew times, and weighted by the total counts in the corresponding time period using addrmf. An average response file is needed becuase a spectral fit using the pre-slew DRM will introduce some errors in both a spectral shape and a normalization if the PHA file contains a lot of the slew/post-slew time interval.
- 3) For fits to more complicated models (e.g. a power-law over a cutoff power-law), the BAT team has decided to require a chi-square improvement of more than 6 for each extra dof.
Time averaged spectrum fit using the average DRM
Power-law model
Time interval is from    0.584 sec. to   48.584 sec.

Spectral model in power-law:
------------------------------------------------------------
Parameters  : value       lower 90%   higher 90%
Photon index: -1.47119     ( -0.195189   0.193431 )
Norm@50keV  : 1.49925E-03    ( -0.00018279   0.000181745 )
------------------------------------------------------------
#Fit statistic : Chi-Squared =          64.30 using 59 PHA bins.
# Reduced chi-squared =          1.128 for     57 degrees of freedom
# Null hypothesis probability =   2.362582e-01

Photon flux (15-150 keV)    in 48 sec: 0.185757 ( -0.022057  0.02208 ) ph/cm2/s
Energy fluence (15-150 keV)             : 6.86122e-07 ( -9.1417e-08  9.27058e-08 ) ergs/cm2
Cutoff power-law model
Time interval is from    0.584 sec. to   48.584 sec.
Spectral model in the cutoff power-law:
------------------------------------------------------------
Parameters  : value       lower 90%   higher 90%
Photon index: -0.176427     ( -0.90959   1.16458 )
Epeak [keV] : 66.4153      ( -13.6063 48.0973 )
Norm@50keV  : 7.19515E-03    ( -0.00719516   0.0218728 )
------------------------------------------------------------
#Fit statistic : Chi-Squared =          57.91 using 59 PHA bins.
# Reduced chi-squared =          1.034 for     56 degrees of freedom
# Null hypothesis probability =   4.047856e-01

Photon flux (15-150 keV)    in 48 sec: 0.176622 ( -0.022965  0.022981 ) ph/cm2/s
Energy fluence (15-150 keV)             : 6.1453e-07 ( -9.85632e-08  1.03779e-07 ) ergs/cm2
1-s peak spectrum fit
Power-law model
Time interval is from    8.084 sec. to    9.084 sec.

Spectral model in power-law:
------------------------------------------------------------
Parameters  : value       lower 90%   higher 90%
Photon index: -1.13157     ( -0.416511   0.441217 )
Norm@50keV  : 4.68292E-03    ( -0.00124039   0.00123826 )
------------------------------------------------------------
#Fit statistic : Chi-Squared =          51.31 using 59 PHA bins.
# Reduced chi-squared =         0.9002 for     57 degrees of freedom
# Null hypothesis probability =   6.874071e-01

Photon flux (15-150 keV)    in 1 sec: 0.544997 ( -0.147859  0.148862 ) ph/cm2/s
Energy fluence (15-150 keV)             : 4.84808e-08 ( -1.36326e-08  1.3841e-08 ) ergs/cm2
Cutoff power-law model
Time interval is from    8.084 sec. to    9.084 sec.
Spectral model in the cutoff power-law:
------------------------------------------------------------
Parameters  : value       lower 90%   higher 90%
Photon index: 0.81354     ( -2.06794   3.93784 )
Epeak [keV] : 77.1786      ( -22.8128 -77.1569 )
Norm@50keV  : 3.84366E-02    ( -0.0385034   1.81629 )
------------------------------------------------------------
#Fit statistic : Chi-Squared =          48.91 using 59 PHA bins.
# Reduced chi-squared =         0.8733 for     56 degrees of freedom
# Null hypothesis probability =   7.380184e-01

Photon flux (15-150 keV)    in 1 sec: 0.507751 ( -0.154901  0.155902 ) ph/cm2/s
Energy fluence (15-150 keV)             : 4.33611e-08 ( -1.41277e-08  1.52041e-08 ) ergs/cm2
Time-resolved spectra
Distribution
T90 vs. Hardness ratio plot
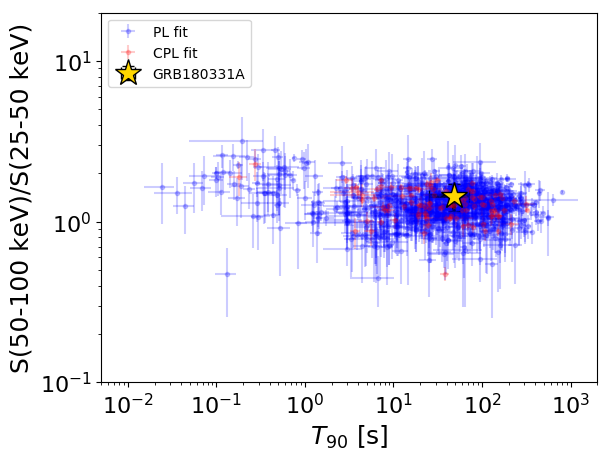
T90                                   = 48.0 sec.
Hardness ratio (energy fluence ratio) = 1.44284610859
S(15-50 keV) vs. S(50-150 keV) plot
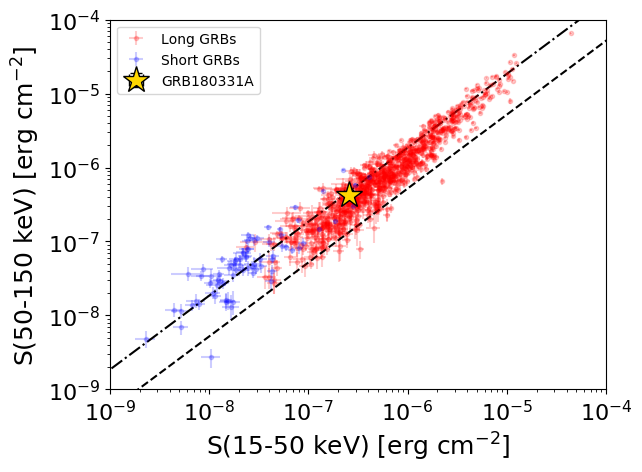
S(15-50 keV)  = 2.5671109e-07
S(50-150 keV) = 4.294217e-07
The dash-dotted line and the dashed line traces the fluences calculated from the Band function with Epeak = 15 and 150 keV, respectively. Both lines assume a canonical values of alpha = -1 and beta = -2.5.
Mask shadow pattern
IMX = -3.571011420068040E-01, IMY = 2.878646867855455E-01
Spacecraft aspect plot
Bright source in the pre-burst/pre-slew/post-slew images
Pre-burst image of 15-350 keV band
Time interval of the image:
-200.115380 0.584000

# RAcent  DECcent POSerr Theta    Phi  PeakCts   SNR AngSep     Name
#  [deg]    [deg]    ['] [deg]  [deg]                   [']
 83.6408  22.0107    0.3  10.5  172.6   8.3606  45.1    0.5	Crab
 95.2752  42.1239    3.4  13.7   37.8   0.6630   3.4 ------	UNKNOWN
164.6997  83.9114    2.8  56.8    3.1   4.1710   4.1 ------	UNKNOWN
 76.3691 -25.4649    3.1  58.3 -177.1   5.2201   3.7 ------	UNKNOWN
Pre-slew background subtracted image of 15-350 keV band
Time interval of the image:
0.584000 48.584000

# RAcent  DECcent POSerr Theta    Phi  PeakCts   SNR AngSep     Name
#  [deg]    [deg]    ['] [deg]  [deg]                   [']
 83.8048  22.1529    0.0  10.4  171.7   0.1676   2.1   12.7	Crab
 66.0055  13.3860    1.0  24.6 -141.1   1.0734  11.8 ------	UNKNOWN
 45.7553  10.6568    2.7  40.6 -118.1   0.9187   4.2 ------	UNKNOWN
Post-slew image of 15-350 keV band
Time interval of the image:
96.284600 962.656000

# RAcent  DECcent POSerr Theta    Phi  PeakCts   SNR AngSep     Name
#  [deg]    [deg]    ['] [deg]  [deg]                   [']
 83.6356  22.0202    0.2  18.8   64.5  36.6020  53.0    0.4	Crab
 88.2150   0.8449    2.7  25.3  122.1   3.3263   4.3 ------	UNKNOWN
 83.2427   0.8658    2.7  21.2  129.1   3.0647   4.3 ------	UNKNOWN
 82.4525  56.7788    3.0  45.2   16.8   4.6619   3.8 ------	UNKNOWN
 66.9857 -42.3533    2.3  55.8 -176.7  13.1556   4.9 ------	UNKNOWN
 56.2557  26.8622    2.5  16.3  -28.6   2.8021   4.7 ------	UNKNOWN
 48.9573  41.7804    3.6  32.0  -20.2   2.2381   3.2 ------	UNKNOWN
 30.8887 -19.9060    2.7  48.0 -129.1  16.2222   4.2 ------	UNKNOWN