Analysis Summary
Notes:
- 1) No attempt has been made to eliminate the non-significant decimal places.
- 2) This batgrbproduct analysis is done using the HEASARC data.
- 3) This batgrbproduct analysis is using the flight position for the mask-weighting calculation.
======================================================================
BAT GRB EVENT DATA PROCESSING REPORT
Process Script Ver: batgrbproduct v2.46
Process Start Time: Wed May 30 15:52:41 EDT 2018
Host Name: bat1
Current Working Dir: /local/data/bat1/alien/Swift_3rdBATcatalog/event/batevent_reproc/trigger820513
======================================================================
Trigger: 00820513 Segment: 000
BAT Trigger Time: 544203540.032 [s; MET]
Trigger Stop: 544203542.08 [s; MET]
UTC: 2018-03-31T15:38:39.320160 [includes UTCF correction]
Where From?: TDRSS position message
BAT
RA: 196.819900496289 Dec: 61.7250399854159 [deg; J2000]
Catalogged Source?: NO
Point Source?: YES
GRB Indicated?: YES [ by BAT flight software ]
Image S/N Ratio: 9.48
Image Trigger?: NO
Rate S/N Ratio: 21.6794833886788 [ if not an image trigger ]
Image S/N Ratio: 9.48
Analysis Position: [ source = BAT ]
RA: 196.819900496289 Dec: 61.7250399854159 [deg; J2000]
Refined Position: [ source = BAT pre-slew burst ]
RA: 196.799942170466 Dec: 61.7253167959102 [deg; J2000]
{ 13h 07m 12.0s , +61d 43' 31.1" }
+/- 1.68461575624069 [arcmin] (estimated 90% radius based on SNR)
+/- 0.532222162632814 [arcmin] (formal 1-sigma fit error)
SNR: 14.4392862205162
Angular difference between the analysis and refined position is 0.567500 arcmin
Partial Coding Fraction: 0.3046875 [ including projection effects ]
Duration
T90: 78.0320000648499 +/- 4.7389450045999
Measured from: -20.1679999828339
to: 57.864000082016 [s; relative to TRIGTIME]
T50: 20.432000041008 +/- 7.35756471371748
Measured from: -13.3679999113083
to: 7.06400012969971 [s; relative to TRIGTIME]
Fluence
Peak Flux (peak 1 second)
Measured from: 0.98800003528595
to: 1.98800003528595 [s; relative to TRIGTIME]
Total Fluence
Measured from: -21.3839999437332
to: 62.4240000247955 [s; relative to TRIGTIME]
Band 1 Band 2 Band 3 Band 4
15-25 25-50 50-100 100-350 keV
Total 1.361262 1.236563 0.520607 0.070868
0.089865 0.092563 0.079495 0.068487 [error]
Peak 0.121067 0.128716 0.065386 0.003289
0.012308 0.012621 0.010284 0.007660 [error]
[ fluence units of on-axis counts / fully illuminated detector ]
======================================================================
====== Table of the duration information =============================
Value tstart tstop
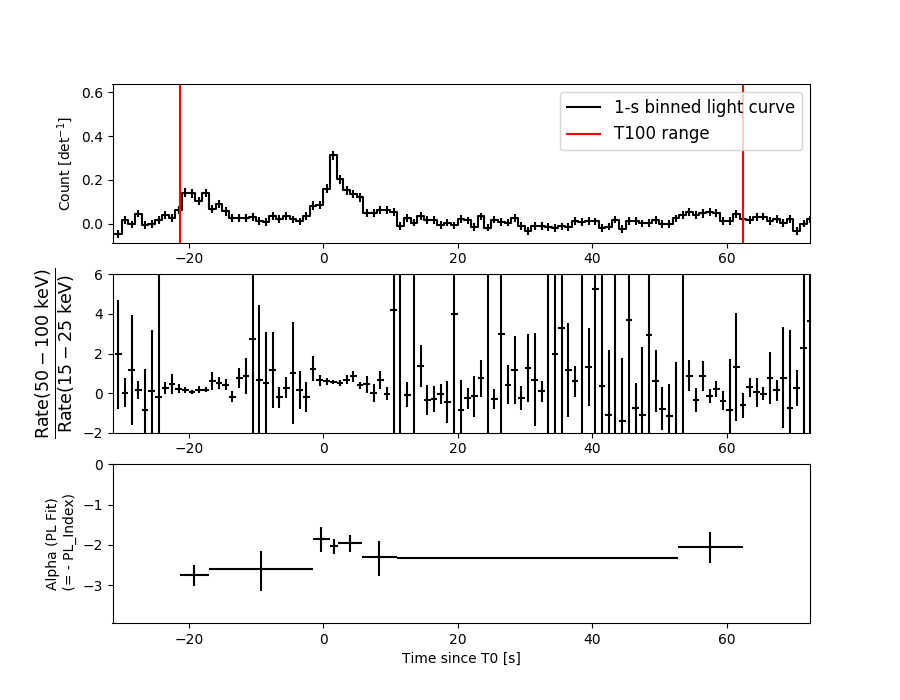
T100 83.808 -21.384 62.424
T90 78.032 -20.168 57.864
T50 20.432 -13.368 7.064
Peak 1.000 0.988 1.988
====== Spectral Analysis Summary =====================================
Model : spectral model: simple power-law (PL) and cutoff power-law (CPL)
Ph_index : photon index: E^{Ph_index}
Ph_90err : 90% error of the photon index
Epeak : Epeak in keV
Epeak_90err: 90% error of Epeak
Norm : normalization at 50 keV in both the PL model and CPL model
Nomr_90err : 90% error of the normalization
chi2 : Chi-Squared
dof : degree of freedo
=== Time-averaged spectral analysis ===
(Best model with acceptable fit: PL)
Model Ph_index Ph_90err_low Ph_90err_hi Epeak Epeak_90err_low Epeak_90err_hi Norm Nomr_90err_low Norm_90err_hi chi2 dof
PL -2.265 -0.185 0.174 - - - 2.07e-03 -2.57e-04 2.52e-04 41.560 57
CPL -1.916 -0.086 0.816 9.531 -7.961 30.885 3.34e-03 N/A N/A 40.860 56
=== 1-s peak spectral analysis ===
(Best model with acceptable fit: PL)
Model Ph_index Ph_90err_low Ph_90err_hi Epeak Epeak_90err_low Epeak_90err_hi Norm Nomr_90err_low Norm_90err_hi chi2 dof
PL -2.058 -0.203 0.190 - - - 1.84e-02 -2.57e-03 2.52e-03 67.840 57
CPL -0.969 -0.894 1.192 38.850 -18.437 13.386 7.99e-02 -7.99e-02 3.35e-01 63.520 56
=== Fluence/Peak Flux Summary ===
Model Band1 Band2 Band3 Band4 Band5 Total
15-25 25-50 50-100 100-350 15-150 15-350 keV
Fluence PL 4.58e-07 5.30e-07 4.41e-07 6.18e-07 1.65e-06 2.05e-06 erg/cm2
90%_error_low -5.41e-08 -4.72e-08 -7.40e-08 -1.81e-07 -1.68e-07 -2.78e-07 erg/cm2
90%_error_hi 5.52e-08 4.69e-08 7.63e-08 2.27e-07 1.72e-07 3.11e-07 erg/cm2
Peak flux PL 1.30e+00 9.39e-01 4.51e-01 3.06e-01 2.83e+00 2.99e+00 ph/cm2/s
90%_error_low -1.98e-01 -1.05e-01 -8.06e-02 -9.19e-02 -3.19e-01 -3.36e-01 ph/cm2/s
90%_error_hi 2.04e-01 1.05e-01 8.14e-02 1.12e-01 3.19e-01 3.36e-01 ph/cm2/s
Fluence CPL N/A N/A N/A N/A N/A N/A erg/cm2
90%_error_low -5.41e-08 -4.72e-08 -7.40e-08 -1.81e-07 -1.68e-07 -2.78e-07 erg/cm2
90%_error_hi 5.52e-08 4.69e-08 7.63e-08 2.27e-07 1.72e-07 3.11e-07 erg/cm2
Peak flux CPL 1.18e+00 1.07e+00 4.41e-01 8.37e-02 2.76e+00 2.77e+00 ph/cm2/s
90%_error_low -2.27e-01 -1.51e-01 -1.06e-01 -8.37e-02 -3.25e-01 -3.34e-01 ph/cm2/s
90%_error_hi 2.28e-01 1.58e-01 9.73e-02 1.62e-01 3.25e-01 3.43e-01 ph/cm2/s
======================================================================
Image
Pre-slew 15.0-350.0 keV image (Event data)
#   RAcent    DECcent   POSerr    Theta     Phi              Peak Cts       SNR   Name
  196.7999    61.7253   0.0133    34.3464   -67.5790         3.2061141     14.439 TRIG_00820513

Foreground time interval of the image:
-21.384  62.424 (delta_t =  83.808 [sec])
Background time interval of the image:
-169.731 -21.384 (delta_t = 148.347 [sec])
Light Curves
Note: The mask-weighted lightcurves have units of either count/det or counts/sec/det, where a det is 0.4 x 0.4 = 0.16 sq cm.
Full-time range; 1 s binning
Other quick-look light curves:
- 64 ms binning (zoomed)
- 16 ms binning (zoomed)
- 8 ms binning (zoomed)
- 2 ms binning (zoomed)
- SN=5 or 10 s binning (full-time range)
- Raw light curve
Spectra
- 64 ms binning (zoomed)
- 16 ms binning (zoomed)
- 8 ms binning (zoomed)
- 2 ms binning (zoomed)
- SN=5 or 10 s binning (full-time range)
- Raw light curve
Spectra
Notes:
- 1) The fitting includes the systematic errors.
- 2) When the burst includes telescope slew time periods, the fitting uses an average response file made from multiple 5-s response files through out the slew time plus single time preiod for the non-slew times, and weighted by the total counts in the corresponding time period using addrmf. An average response file is needed becuase a spectral fit using the pre-slew DRM will introduce some errors in both a spectral shape and a normalization if the PHA file contains a lot of the slew/post-slew time interval.
- 3) For fits to more complicated models (e.g. a power-law over a cutoff power-law), the BAT team has decided to require a chi-square improvement of more than 6 for each extra dof.
Time averaged spectrum fit using the average DRM
Power-law model
Time interval is from  -21.384 sec. to   62.424 sec.

Spectral model in power-law:
------------------------------------------------------------
Parameters  : value       lower 90%   higher 90%
Photon index: -2.26531     ( -0.184784   0.174355 )
Norm@50keV  : 2.07414E-03    ( -0.000256724   0.000251502 )
------------------------------------------------------------
#Fit statistic : Chi-Squared =          41.56 using 59 PHA bins.
# Reduced chi-squared =         0.7291 for     57 degrees of freedom
# Null hypothesis probability =   9.380130e-01

Photon flux (15-150 keV)    in 83.81 sec: 0.355650 ( -0.030641  0.030655 ) ph/cm2/s
Energy fluence (15-150 keV)             : 1.65138e-06 ( -1.68189e-07  1.71663e-07 ) ergs/cm2
Cutoff power-law model
Time interval is from  -21.384 sec. to   62.424 sec.
Spectral model in the cutoff power-law:
------------------------------------------------------------
Parameters  : value       lower 90%   higher 90%
Photon index: -1.91626     ( -0.0836657   0.818365 )
Epeak [keV] : 9.53149      ( -7.58427 31.2619 )
Norm@50keV  : 3.34389E-03    (     )
------------------------------------------------------------
#Fit statistic : Chi-Squared =          40.86 using 59 PHA bins.
# Reduced chi-squared =         0.7296 for     56 degrees of freedom
# Null hypothesis probability =   9.357758e-01

Photon flux (15-150 keV)    in 83.81 sec: 0.355296 ( -0.030507  0.016061 ) ph/cm2/s
Energy fluence (15-150 keV)             : 0 ( 0  0 ) ergs/cm2
1-s peak spectrum fit
Power-law model
Time interval is from    0.988 sec. to    1.988 sec.

Spectral model in power-law:
------------------------------------------------------------
Parameters  : value       lower 90%   higher 90%
Photon index: -2.05842     ( -0.202656   0.190234 )
Norm@50keV  : 1.83529E-02    ( -0.00257374   0.00251763 )
------------------------------------------------------------
#Fit statistic : Chi-Squared =          67.84 using 59 PHA bins.
# Reduced chi-squared =          1.190 for     57 degrees of freedom
# Null hypothesis probability =   1.542529e-01

Photon flux (15-150 keV)    in 1 sec: 2.82977 ( -0.31871  0.31881 ) ph/cm2/s
Energy fluence (15-150 keV)             : 1.6993e-07 ( -2.19544e-08  2.22464e-08 ) ergs/cm2
Cutoff power-law model
Time interval is from    0.988 sec. to    1.988 sec.
Spectral model in the cutoff power-law:
------------------------------------------------------------
Parameters  : value       lower 90%   higher 90%
Photon index: -0.968682     ( -0.894361   1.19233 )
Epeak [keV] : 38.8503      ( -18.4369 13.3863 )
Norm@50keV  : 7.98876E-02    ( -0.079896   0.335271 )
------------------------------------------------------------
#Fit statistic : Chi-Squared =          63.52 using 59 PHA bins.
# Reduced chi-squared =          1.134 for     56 degrees of freedom
# Null hypothesis probability =   2.286706e-01

Photon flux (15-150 keV)    in 1 sec: 2.75883 ( -0.32484  0.32492 ) ph/cm2/s
Energy fluence (15-150 keV)             : 0 ( 0  0 ) ergs/cm2
Time-resolved spectra
Distribution
T90 vs. Hardness ratio plot
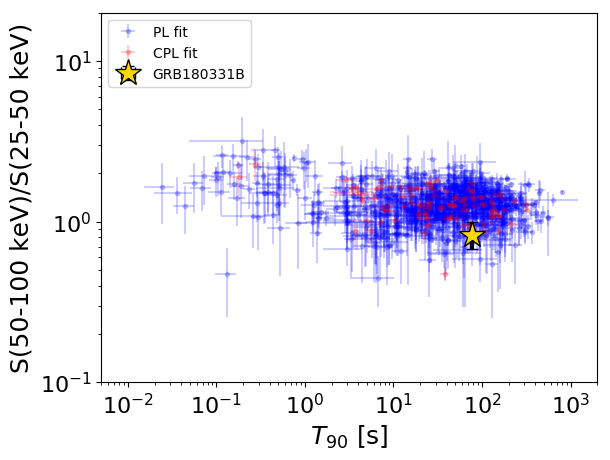
T90                                   = 78.032 sec.
Hardness ratio (energy fluence ratio) = 0.832051212129
S(15-50 keV) vs. S(50-150 keV) plot
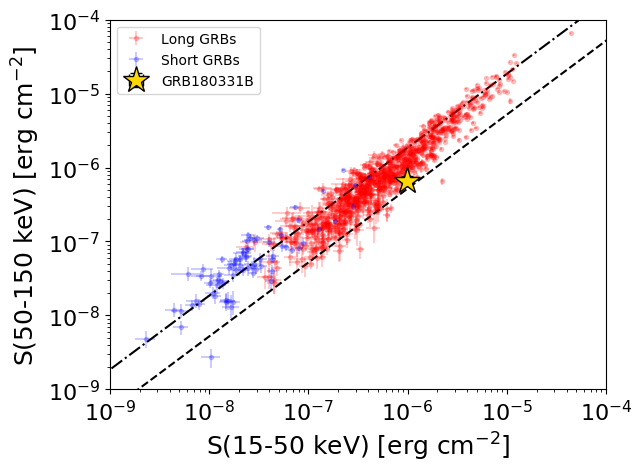
S(15-50 keV)  = 9.877745e-07
S(50-150 keV) = 6.63614e-07
The dash-dotted line and the dashed line traces the fluences calculated from the Band function with Epeak = 15 and 150 keV, respectively. Both lines assume a canonical values of alpha = -1 and beta = -2.5.
Mask shadow pattern
IMX = 2.606323414161451E-01, IMY = 6.316842637770844E-01
Spacecraft aspect plot
Bright source in the pre-burst/pre-slew/post-slew images
Pre-burst image of 15-350 keV band
Time interval of the image:
-169.731400 -21.384000

# RAcent  DECcent POSerr Theta    Phi  PeakCts   SNR AngSep     Name
#  [deg]    [deg]    ['] [deg]  [deg]                   [']
120.2998  35.7109    2.8  49.9 -148.0   1.8475   4.2 ------	UNKNOWN
132.0041  51.5873    2.7  41.7 -125.6   1.4333   4.3 ------	UNKNOWN
Pre-slew background subtracted image of 15-350 keV band
Time interval of the image:
-21.384000 62.424000

# RAcent  DECcent POSerr Theta    Phi  PeakCts   SNR AngSep     Name
#  [deg]    [deg]    ['] [deg]  [deg]                   [']
141.4936  -2.3870    2.3  48.5  154.2   1.7816   4.9 ------	UNKNOWN
207.3811  58.1850    2.2  34.6  -56.3   1.0002   5.3 ------	UNKNOWN
196.7999  61.7253    0.8  34.3  -67.6   3.2060  14.4 ------	UNKNOWN
207.6000  68.9213    2.1  42.8  -67.5   2.5563   5.6 ------	UNKNOWN
Post-slew image of 15-350 keV band
Time interval of the image:
647.768590 963.032000

# RAcent  DECcent POSerr Theta    Phi  PeakCts   SNR AngSep     Name
#  [deg]    [deg]    ['] [deg]  [deg]                   [']
254.3056  35.3271    3.9  44.2    2.0   1.2648   3.0    7.5	Her X-1
212.1788  50.8815    3.9  13.7   37.9   0.7515   2.9 ------	UNKNOWN
141.4465  45.2632    3.2  35.4  171.3   1.2845   3.6 ------	UNKNOWN
261.6202  36.4052    2.3  46.8   -5.6   2.4015   5.0 ------	UNKNOWN
279.2533  49.2096    6.1  45.0  -30.8   0.8610   1.9 ------	UNKNOWN
 71.2542  85.0536    2.8  31.4 -105.0   1.8934   4.2 ------	UNKNOWN
 75.4986  62.6501    2.9  48.0 -129.1   6.1071   4.0 ------	UNKNOWN