Analysis Summary
Notes:
- 1) No attempt has been made to eliminate the non-significant decimal places.
- 2) This batgrbproduct analysis is done using the HEASARC data.
- 3) This batgrbproduct analysis is using the flight position for the mask-weighting calculation.
======================================================================
BAT GRB EVENT DATA PROCESSING REPORT
Process Script Ver: batgrbproduct v2.46
Process Start Time: Wed May 30 15:50:02 EDT 2018
Host Name: bat1
Current Working Dir: /local/data/bat1/alien/Swift_3rdBATcatalog/event/batevent_reproc/trigger821103
======================================================================
Trigger: 00821103 Segment: 000
BAT Trigger Time: 544355120 [s; MET]
Trigger Stop: 544355120.256 [s; MET]
UTC: 2018-04-02T09:44:59.279000 [includes UTCF correction]
Where From?: TDRSS position message
BAT
RA: 251.90471404867 Dec: -14.9635136172067 [deg; J2000]
Catalogged Source?: NO
Point Source?: YES
GRB Indicated?: YES [ by BAT flight software ]
Image S/N Ratio: 9.19
Image Trigger?: NO
Rate S/N Ratio: 50.5074251966976 [ if not an image trigger ]
Image S/N Ratio: 9.19
Analysis Position: [ source = BAT ]
RA: 251.90471404867 Dec: -14.9635136172067 [deg; J2000]
Refined Position: [ source = BAT pre-slew burst ]
RA: 251.923245940902 Dec: -14.9282173716536 [deg; J2000]
{ 16h 47m 41.6s , -14d 55' 41.6" }
+/- 1.9521785474164 [arcmin] (estimated 90% radius based on SNR)
+/- 1.29543885010673 [arcmin] (formal 1-sigma fit error)
SNR: 11.6974304440306
Angular difference between the analysis and refined position is 2.374676 arcmin
Partial Coding Fraction: 0.3789062 [ including projection effects ]
Duration
T90: 0.179999947547913 +/- 0.0312411001733173
Measured from: 0.0679999589920044
to: 0.247999906539917 [s; relative to TRIGTIME]
T50: 0.0999999046325684 +/- 0.0226273785602007
Measured from: 0.120000004768372
to: 0.21999990940094 [s; relative to TRIGTIME]
Fluence
Peak Flux (peak 1 second)
Measured from: -0.340000033378601
to: 0.659999966621399 [s; relative to TRIGTIME]
Total Fluence
Measured from: 0.0520000457763672
to: 0.264000058174133 [s; relative to TRIGTIME]
Band 1 Band 2 Band 3 Band 4
15-25 25-50 50-100 100-350 keV
Total 0.028493 0.040215 0.067162 0.034500
0.006277 0.007629 0.008051 0.007692 [error]
Peak 0.042393 0.063604 0.093849 0.025930
0.012298 0.012956 0.011833 0.010835 [error]
[ fluence units of on-axis counts / fully illuminated detector ]
======================================================================
====== Table of the duration information =============================
Value tstart tstop
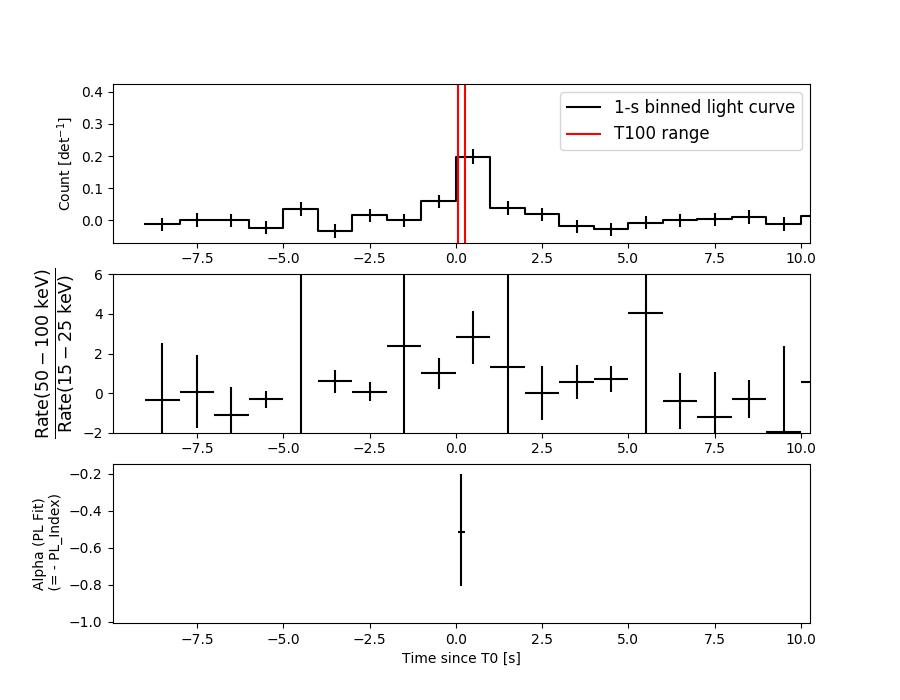
T100 0.212 0.052 0.264
T90 0.180 0.068 0.248
T50 0.100 0.120 0.220
Peak 1.000 -0.340 0.660
====== Spectral Analysis Summary =====================================
Model : spectral model: simple power-law (PL) and cutoff power-law (CPL)
Ph_index : photon index: E^{Ph_index}
Ph_90err : 90% error of the photon index
Epeak : Epeak in keV
Epeak_90err: 90% error of Epeak
Norm : normalization at 50 keV in both the PL model and CPL model
Nomr_90err : 90% error of the normalization
chi2 : Chi-Squared
dof : degree of freedo
=== Time-averaged spectral analysis ===
(Best model with acceptable fit: N/A)
Model Ph_index Ph_90err_low Ph_90err_hi Epeak Epeak_90err_low Epeak_90err_hi Norm Nomr_90err_low Norm_90err_hi chi2 dof
PL -0.516 -0.289 0.317 - - - 4.96e-02 -8.50e-03 8.09e-03 55.800 57
CPL -0.413 -0.401 0.731 967.554 -967.554 -967.554 5.46e-02 -1.23e-02 3.64e-02 56.130 56
=== 1-s peak spectral analysis ===
(Best model with acceptable fit: PL)
Model Ph_index Ph_90err_low Ph_90err_hi Epeak Epeak_90err_low Epeak_90err_hi Norm Nomr_90err_low Norm_90err_hi chi2 dof
PL -0.878 -0.300 0.324 - - - 1.58e-02 -2.75e-03 2.68e-03 69.870 57
CPL -0.768 -0.407 1.182 681.428 -681.428 -681.428 1.76e-02 -4.22e-03 3.10e-02 69.910 56
=== Fluence/Peak Flux Summary ===
Model Band1 Band2 Band3 Band4 Band5 Total
15-25 25-50 50-100 100-350 15-150 15-350 keV
Fluence PL 5.39e-09 1.82e-08 5.10e-08 4.31e-07 1.40e-07 5.05e-07 erg/cm2
90%_error_low -1.92e-09 -4.14e-09 -7.43e-09 -1.43e-07 -2.16e-08 -1.46e-07 erg/cm2
90%_error_hi 2.25e-09 4.02e-09 7.37e-09 1.99e-07 2.17e-08 1.98e-07 erg/cm2
Peak flux PL 3.60e-01 5.26e-01 5.73e-01 1.17e+00 1.82e+00 2.63e+00 ph/cm2/s
90%_error_low -1.28e-01 -1.23e-01 -9.54e-02 -3.90e-01 -3.09e-01 -4.56e-01 ph/cm2/s
90%_error_hi 1.49e-01 1.20e-01 9.45e-02 5.19e-01 3.11e-01 4.92e-01 ph/cm2/s
Fluence CPL N/A N/A N/A N/A N/A N/A erg/cm2
90%_error_low -1.92e-09 -4.14e-09 -7.43e-09 -1.43e-07 -2.16e-08 -1.46e-07 erg/cm2
90%_error_hi 2.25e-09 4.02e-09 7.37e-09 1.99e-07 2.17e-08 1.98e-07 erg/cm2
Peak flux CPL 3.62e-01 5.26e-01 5.72e-01 1.19e+00 1.82e+00 2.66e+00 ph/cm2/s
90%_error_low -1.77e-01 -1.23e-01 -9.46e-02 N/A -3.21e-01 -8.93e-01 ph/cm2/s
90%_error_hi 1.47e-01 1.20e-01 1.22e-01 N/A 3.08e-01 4.22e-01 ph/cm2/s
======================================================================
Image
Pre-slew 15.0-350.0 keV image (Event data)
#   RAcent    DECcent   POSerr    Theta     Phi              Peak Cts       SNR   Name
  251.9232   -14.9282   0.0164    31.9225    58.4326         0.1788433     11.697 TRIG_00821103

Foreground time interval of the image:
  0.052   0.264 (delta_t =   0.212 [sec])
Background time interval of the image:
-239.000 -149.576 (delta_t =  89.424 [sec])
-149.000   0.052 (delta_t = 149.052 [sec])
Light Curves
Note: The mask-weighted lightcurves have units of either count/det or counts/sec/det, where a det is 0.4 x 0.4 = 0.16 sq cm.
Full-time range; 1 s binning
Other quick-look light curves:
- 64 ms binning (zoomed)
- 16 ms binning (zoomed)
- 8 ms binning (zoomed)
- 2 ms binning (zoomed)
- SN=5 or 10 s binning (full-time range)
- Raw light curve
Spectra
- 64 ms binning (zoomed)
- 16 ms binning (zoomed)
- 8 ms binning (zoomed)
- 2 ms binning (zoomed)
- SN=5 or 10 s binning (full-time range)
- Raw light curve
Spectra
Notes:
- 1) The fitting includes the systematic errors.
- 2) When the burst includes telescope slew time periods, the fitting uses an average response file made from multiple 5-s response files through out the slew time plus single time preiod for the non-slew times, and weighted by the total counts in the corresponding time period using addrmf. An average response file is needed becuase a spectral fit using the pre-slew DRM will introduce some errors in both a spectral shape and a normalization if the PHA file contains a lot of the slew/post-slew time interval.
- 3) For fits to more complicated models (e.g. a power-law over a cutoff power-law), the BAT team has decided to require a chi-square improvement of more than 6 for each extra dof.
Time averaged spectrum fit using the average DRM
Power-law model

Time interval is from    0.052 sec. to    0.264 sec.

Spectral model in power-law:
------------------------------------------------------------
Parameters  : value       lower 90%   higher 90%
Photon index: -0.515526     ( -0.289243   0.316857 )
Norm@50keV  : 4.96249E-02    ( -0.00849594   0.00808563 )
------------------------------------------------------------
#Fit statistic : Chi-Squared =          55.80 using 59 PHA bins.
# Reduced chi-squared =         0.9789 for     57 degrees of freedom
# Null hypothesis probability =   5.202372e-01

Photon flux (15-150 keV)    in 0.212 sec: 0.597222 ( -0.279627  0.658038 ) ph/cm2/s
Energy fluence (15-150 keV)             : 1.40254e-07 ( -2.15663e-08  2.16605e-08 ) ergs/cm2
Cutoff power-law model
Time interval is from    0.052 sec. to    0.264 sec.
Spectral model in the cutoff power-law:
------------------------------------------------------------
Parameters  : value       lower 90%   higher 90%
Photon index: -0.505138     ( -0.400524   0.731149 )
Epeak [keV] : 9999.36      ( -9999.36 -9999.36 )
Norm@50keV  : 5.00373E-02    ( -0.00778375   0.0409585 )
------------------------------------------------------------
#Fit statistic : Chi-Squared =          55.83 using 59 PHA bins.
# Reduced chi-squared =         0.9969 for     56 degrees of freedom
# Null hypothesis probability =   4.813895e-01

Photon flux (15-150 keV)    in 0.212 sec: 5.86152 ( -0.86043  0.86049 ) ph/cm2/s
Energy fluence (15-150 keV)             : 0 ( 0  0 ) ergs/cm2
1-s peak spectrum fit
Power-law model

Time interval is from   -0.340 sec. to    0.660 sec.

Spectral model in power-law:
------------------------------------------------------------
Parameters  : value       lower 90%   higher 90%
Photon index: -0.878314     ( -0.299732   0.323531 )
Norm@50keV  : 1.58363E-02    ( -0.00274569   0.00267849 )
------------------------------------------------------------
#Fit statistic : Chi-Squared =          69.87 using 59 PHA bins.
# Reduced chi-squared =          1.226 for     57 degrees of freedom
# Null hypothesis probability =   1.176912e-01

Photon flux (15-150 keV)    in 1 sec: 1.81748 ( -0.30862  0.31115 ) ph/cm2/s
Energy fluence (15-150 keV)             : 1.79263e-07 ( -3.03509e-08  3.05247e-08 ) ergs/cm2
Cutoff power-law model
Time interval is from   -0.340 sec. to    0.660 sec.
Spectral model in the cutoff power-law:
------------------------------------------------------------
Parameters  : value       lower 90%   higher 90%
Photon index: -0.871354     ( -0.396917   1.19183 )
Epeak [keV] : 9998.85      ( -9998.85 -9998.85 )
Norm@50keV  : 1.59414E-02    ( -0.00257423   0.0326926 )
------------------------------------------------------------
#Fit statistic : Chi-Squared =          69.87 using 59 PHA bins.
# Reduced chi-squared =          1.248 for     56 degrees of freedom
# Null hypothesis probability =   1.006486e-01

Photon flux (15-150 keV)    in 1 sec: 1.82001 ( -0.32117  0.30841 ) ph/cm2/s
Energy fluence (15-150 keV)             : 1.79461e-07 ( 0  0 ) ergs/cm2
Time-resolved spectra
Distribution
T90 vs. Hardness ratio plot
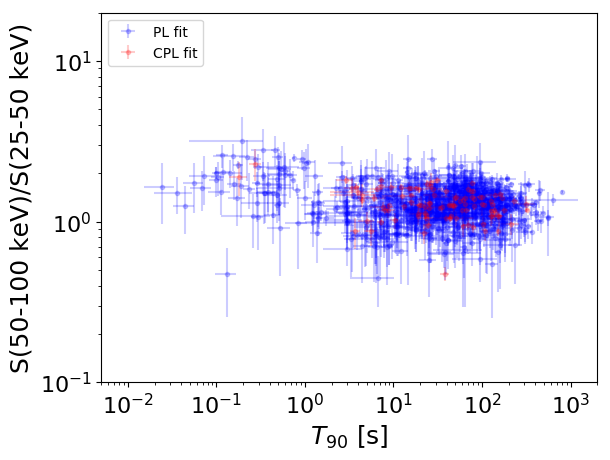
T90                                   = N/A sec.
Hardness ratio (energy fluence ratio) = N/A
S(15-50 keV) vs. S(50-150 keV) plot
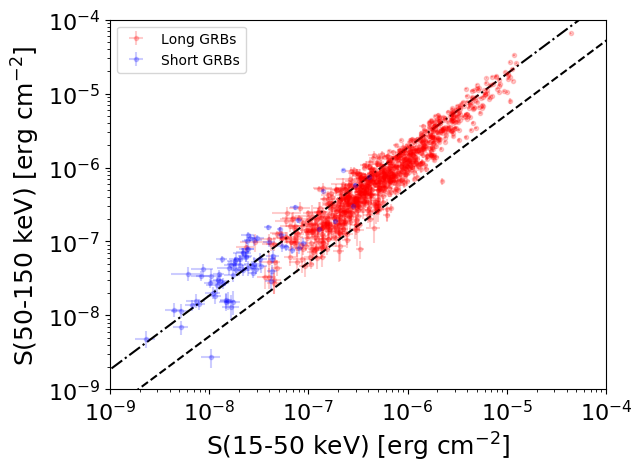
S(15-50 keV)  = N/A
S(50-150 keV) = N/A
The dash-dotted line and the dashed line traces the fluences calculated from the Band function with Epeak = 15 and 150 keV, respectively. Both lines assume a canonical values of alpha = -1 and beta = -2.5.
Mask shadow pattern
IMX = 3.261370498094933E-01, IMY = -5.308038167059512E-01
Spacecraft aspect plot
Bright source in the pre-burst/pre-slew/post-slew images
Pre-burst image of 15-350 keV band
Time interval of the image:
-239.000000 -149.575500
-149.000000 0.052000

# RAcent  DECcent POSerr Theta    Phi  PeakCts   SNR AngSep     Name
#  [deg]    [deg]    ['] [deg]  [deg]                   [']
244.9522 -15.6651    1.7  37.6   64.8   7.5475   6.9    2.2	Sco X-1
254.4379  35.2419    5.4  33.9  161.1   1.2942   2.2    6.1	Her X-1
255.8876 -37.7690   12.5  48.4   32.7   1.5207   0.9    6.5	4U 1700-377
256.6101 -36.4735   13.7  47.0   32.8  -1.1775  -0.8    9.0	GX 349+2
262.9563 -24.6065    7.1  33.9   32.4   1.0247   1.6    8.8	GX 1+4
264.7376 -44.4718    4.7  52.5   21.7   5.0509   2.4    1.3	4U 1735-44
268.3518  -1.4538  120.3  11.0   50.7  -0.0387  -0.1    1.0	SW J1753.5-0127
270.3092 -24.9955   20.0  32.5   20.5   0.2965   0.6    5.2	GX 5-1
270.2632 -25.7402    7.0  33.3   20.4   0.9100   1.7    2.1	GRS 1758-258
273.9911 -14.0096    5.0  21.2   15.4   1.0103   2.3    1.8	GX 17+2
276.1084 -30.4898    0.0  37.7   11.0  -0.1117  -0.2   12.0	H1820-303
284.8996 -24.9367    3.7  33.5   -3.8  -1.6141  -3.1    7.5	HT1900.1-2455
288.8063  10.9550    1.6  14.0  -94.3   3.7874   7.3    0.7	GRS 1915+105
299.5903  35.1746    1.6  35.9 -132.4   4.8912   7.2    1.6	Cyg X-1
308.1035  40.8231    9.1  44.6 -131.8   1.4968   1.3    7.8	Cyg X-3
263.1897 -33.9692    0.0  42.7   27.0   0.5734   0.6   12.8	GX 354-0
277.1914 -45.6625    2.4  52.9   10.5   7.9534   4.8 ------	UNKNOWN
289.3128 -45.6920    2.4  54.4    0.2   7.3049   4.9 ------	UNKNOWN
275.0862   7.1811    0.1   0.1   94.2  36.1748  89.3 ------	UNKNOWN
272.0489  44.7307    3.0  37.6 -171.3   2.3034   3.9 ------	UNKNOWN
295.8386 -31.1340    2.9  43.1  -13.9   2.6980   4.1 ------	UNKNOWN
	UNKNOWN
	UNKNOWN
	UNKNOWN
Pre-slew background subtracted image of 15-350 keV band
Time interval of the image:
0.052000 0.264000

# RAcent  DECcent POSerr Theta    Phi  PeakCts   SNR AngSep     Name
#  [deg]    [deg]    ['] [deg]  [deg]                   [']
244.9451 -15.5175    9.2  37.6   65.0  -0.0309  -1.3    7.6	Sco X-1
254.6503  35.2490    9.7  33.8  161.4  -0.0136  -1.2   11.0	Her X-1
256.1085 -37.8262    3.3  48.4   32.5  -0.1286  -3.5    5.9	4U 1700-377
256.4592 -36.5346    4.2  47.1   32.9   0.0861   2.7    6.8	GX 349+2
263.0433 -24.8863    3.8  34.2   32.1   0.0391   3.0    8.6	GX 1+4
264.5844 -44.4358   43.0  52.5   21.8  -0.0134  -0.3    6.8	4U 1735-44
268.2814  -1.6229    6.0  11.2   50.4   0.0158   1.9   11.5	SW J1753.5-0127
270.0996 -24.9553    0.0  32.5   20.9  -0.0323  -3.0   12.5	GX 5-1
270.3218 -25.8893    7.0  33.4   20.2  -0.0180  -1.6    8.8	GRS 1758-258
273.8896 -13.9118    4.4  21.1   15.7   0.0206   2.6   10.1	GX 17+2
275.7632 -30.3126    6.0  37.5   11.5   0.0238   1.9    9.0	H1820-303
285.2071 -25.0349    0.0  33.7   -4.2  -0.0075  -0.7   11.6	HT1900.1-2455
288.7841  11.0909    6.0  14.0  -94.8  -0.0152  -1.9    8.8	GRS 1915+105
299.5898  35.2019   82.1  35.9 -132.4   0.0015   0.1    0.0	Cyg X-1
308.2766  41.0139    9.2  44.8 -131.9   0.0252   1.3    8.4	Cyg X-3
262.8897 -33.7553    7.5  42.6   27.5  -0.0289  -1.5    6.9	GX 354-0
251.9232 -14.9283    1.0  31.9   58.4   0.1790  11.7 ------	UNKNOWN
251.0619  51.3984    2.4  48.5  172.5   0.1009   4.8 ------	UNKNOWN
308.8560 -30.9901    2.3  50.0  -26.1   0.0826   5.0 ------	UNKNOWN
Post-slew image of 15-350 keV band
Time interval of the image:
63.500600 963.038100

# RAcent  DECcent POSerr Theta    Phi  PeakCts   SNR AngSep     Name
#  [deg]    [deg]    ['] [deg]  [deg]                   [']
244.9792 -15.6423    0.3   6.7   80.7  43.8426  34.1    0.1	Sco X-1
254.5608  35.3551   11.3  50.4 -179.9   3.5423   1.0    5.1	Her X-1
255.8052 -37.9936    0.0  23.3  -10.5  -0.6361  -0.5   12.4	4U 1700-377
256.2642 -36.3530   15.0  21.7  -12.2   0.9934   0.8    9.3	GX 349+2
263.0819 -24.8908   14.6  14.4  -47.5  -1.0363  -0.8    9.6	GX 1+4
264.8746 -44.5874   57.3  31.6  -20.4   0.3319   0.2   10.0	4U 1735-44
268.2179  -1.3020    0.0  21.1 -131.6   2.1296   1.5   12.8	SW J1753.5-0127
270.2447 -25.1414    3.0  20.0  -59.2   5.2132   3.9    4.3	GX 5-1
270.3235 -25.6741   11.9  20.3  -57.9   1.4657   1.1    4.3	GRS 1758-258
273.8590 -14.1831    0.0  21.2  -92.0   1.6557   1.0   12.3	GX 17+2
275.7693 -30.5323    0.0  26.8  -53.2   2.5437   1.5   12.8	H1820-303
285.1808 -24.7594    0.0  32.7  -70.0   0.3771   0.2   12.5	HT1900.1-2455
288.7790  10.9415    2.6  44.8 -126.0  20.8417   4.4    1.2	GRS 1915+105
263.0638 -33.9787    9.1  21.5  -28.6  -1.7245  -1.3    9.4	GX 354-0
207.6754 -35.8224    3.8  44.6   51.0  19.2081   3.0 ------	UNKNOWN
220.8690 -51.0914    3.6  43.9   25.2   8.7014   3.2 ------	UNKNOWN
229.9545 -37.2105    3.1  29.6   34.4   5.9156   3.7 ------	UNKNOWN
235.3151  -8.3776    2.5  17.5  107.6   6.4819   4.6 ------	UNKNOWN
263.7755 -19.6528    3.3  12.2  -68.6   4.3296   3.5 ------	UNKNOWN
265.2154 -66.8190    2.4  52.6   -9.2  16.0901   4.8 ------	UNKNOWN
269.0468   8.0981    2.7  28.6 -145.2   6.3737   4.3 ------	UNKNOWN
	UNKNOWN
	UNKNOWN