Analysis Summary
Notes:
- 1) No attempt has been made to eliminate the non-significant decimal places.
- 2) This batgrbproduct analysis is done using the HEASARC data.
- 3) This batgrbproduct analysis is using the flight position for the mask-weighting calculation.
======================================================================
                  BAT GRB EVENT DATA PROCESSING REPORT
    Process Script Ver: batgrbproduct v2.46
    Process Start Time: Fri May 11 18:19:41 EDT 2018
             Host Name: bat1
   Current Working Dir: /local/data/bat1/alien/Swift_3rdBATcatalog/event/batevent_reproc/trigger821902
======================================================================

  Trigger: 00821902      Segment: 000

  BAT Trigger Time: 544500724.8   [s; MET]
      Trigger Stop: 544500725.824   [s; MET]
               UTC: 2018-04-04T02:11:44.070200    [includes UTCF correction]
       Where From?: TDRSS position message

  BAT
    RA: 53.3839578629457   Dec: -50.1951024002562  [deg; J2000]

     Catalogged Source?: NO
     Point Source?:      YES
     GRB Indicated?:     YES    [ by BAT flight software ]
     Image S/N Ratio:    14.59
     Image Trigger?:     NO
     Rate S/N Ratio:     39.3319208785943  [ if not an image trigger ]
     Image S/N Ratio:    14.59

  Analysis Position:   [ source = BAT ]
    RA: 53.3839578629457   Dec: -50.1951024002562  [deg; J2000]

  Refined Position:   [ source = BAT pre-slew burst ]
    RA: 53.3895541861462   Dec: -50.2139549540475  [deg; J2000]
        { 03h 33m 33.5s , -50d 12' 50.2" }
         +/- 0.519172903699948 [arcmin] (estimated 90% radius based on SNR)
         +/- 0.128237154371242 [arcmin] (formal 1-sigma fit error)
    SNR: 77.591741084974

  Angular difference between the analysis and refined position is 1.151389 arcmin

  Partial Coding Fraction: 0.84375    [ including projection effects ]

  Duration
     T90: 111.707999944687 +/- 6.98886220497745
        Measured from: -0.24399995803833
                   to: 111.463999986649     [s; relative to TRIGTIME]
     T50: 46.8799998760223 +/- 1.4740691571517
        Measured from: 7.89200007915497
                   to: 54.7719999551773     [s; relative to TRIGTIME]


  Fluence
     Peak Flux  (peak 1 second)
        Measured from: 8.87999999523163
                   to: 9.87999999523163     [s; relative to TRIGTIME]
     Total Fluence
        Measured from: -5.90799999237061
                   to: 196.280000090599     [s; relative to TRIGTIME]

             Band 1     Band 2     Band 3     Band 4
              15-25      25-50     50-100    100-350     keV
 Total     4.440281   6.471867   5.546082   1.550622
           0.080382   0.085899   0.078841   0.070587 [error]
 Peak      0.083898   0.218317   0.261606   0.091886
           0.007375   0.009263   0.009803   0.007383 [error]

     [ fluence units of on-axis counts / fully illuminated detector ]

======================================================================


====== Table of the duration information =============================

        Value   tstart    tstop
T100  202.188   -5.908  196.280
T90   111.708   -0.244  111.464
T50    46.880    7.892   54.772
Peak    1.000    8.880    9.880


====== Spectral Analysis Summary =====================================

Model      : spectral model: simple power-law (PL) and cutoff power-law (CPL)
Ph_index   : photon index: E^{Ph_index}
Ph_90err   : 90% error of the photon index
Epeak      : Epeak in keV
Epeak_90err: 90% error of Epeak
Norm       : normalization at 50 keV in both the PL model and CPL model
Nomr_90err : 90% error of the normalization
chi2       : Chi-Squared
dof        : degree of freedo

=== Time-averaged spectral analysis ===
(Best model with acceptable fit: PL)

Model Ph_index Ph_90err_low Ph_90err_hi  Epeak  Epeak_90err_low  Epeak_90err_hi  Norm       Nomr_90err_low    Norm_90err_hi    chi2    dof
PL      -1.334    -0.036      0.036       -           -               -         5.95e-03     -1.11e-04          1.11e-04      31.120   57
CPL     -1.284    -0.064      0.147      835.133    -835.133      -835.133      6.25e-03     -1.58e-04          9.32e-04      30.810   56


=== 1-s peak spectral analysis ===
(Best model with acceptable fit: CPL)

Model Ph_index Ph_90err_low Ph_90err_hi  Epeak  Epeak_90err_low  Epeak_90err_hi  Norm       Nomr_90err_low    Norm_90err_hi    chi2    dof
PL      -0.792     -0.073     0.074       -           -               -         4.49e-02     -2.01e-03          2.00e-03      58.630   57
CPL     -0.321     -0.303     0.327      212.681     -62.798       254.404      7.18e-02     -1.82e-02          2.63e-02      51.310   56


=== Fluence/Peak Flux Summary ===

              Model    Band1     Band2     Band3     Band4     Band5     Total
                       15-25     25-50    50-100    100-350    15-150    15-350    keV
Fluence         PL   1.31e-06  2.68e-06  4.25e-06  1.50e-05  1.18e-05  2.32e-05   erg/cm2
      90%_error_low -5.43e-08 -6.35e-08 -8.92e-08 -7.53e-07 -2.24e-07 -7.83e-07   erg/cm2
      90%_error_hi   5.53e-08  6.34e-08  8.90e-08  7.82e-07  2.24e-07  8.06e-07   erg/cm2
Peak flux       PL   9.43e-01  1.45e+00  1.67e+00  3.71e+00  5.16e+00  7.78e+00   ph/cm2/s
      90%_error_low -8.59e-02 -8.29e-02 -7.54e-02 -3.48e-01 -2.27e-01 -3.91e-01   ph/cm2/s
      90%_error_hi   8.89e-02  8.24e-02  7.52e-02  3.71e-01  2.27e-01  4.00e-01   ph/cm2/s

Fluence        CPL   1.30e-06  2.68e-06  4.27e-06  1.50e-05  1.18e-05  2.23e-05   erg/cm2
      90%_error_low -7.56e-08 -6.03e-08 -8.96e-08 -3.44e-06 -2.46e-07 -2.33e-06   erg/cm2
      90%_error_hi   6.19e-08  6.47e-08  1.06e-07  3.75e-07  2.37e-07  1.11e-06   erg/cm2
Peak flux      CPL   8.27e-01  1.48e+00  1.78e+00  2.39e+00  5.10e+00  6.48e+00   ph/cm2/s
      90%_error_low -1.08e-01 -8.91e-02 -1.00e-01 -5.53e-01 -2.31e-01 -5.90e-01   ph/cm2/s
      90%_error_hi   1.12e-01  8.97e-02  1.01e-01  7.66e-01  2.31e-01  7.74e-01   ph/cm2/s

======================================================================
Image
Pre-slew 15.0-350.0 keV image (Event data)
#   RAcent    DECcent   POSerr    Theta     Phi              Peak Cts       SNR   Name
   53.3896   -50.2140   0.0025    25.1501  -147.2724         7.0760727     77.592 TRIG_00821902

Foreground time interval of the image:
 -5.908  11.901 (delta_t =  17.809 [sec])
Background time interval of the image:
-239.800  -5.908 (delta_t = 233.892 [sec])
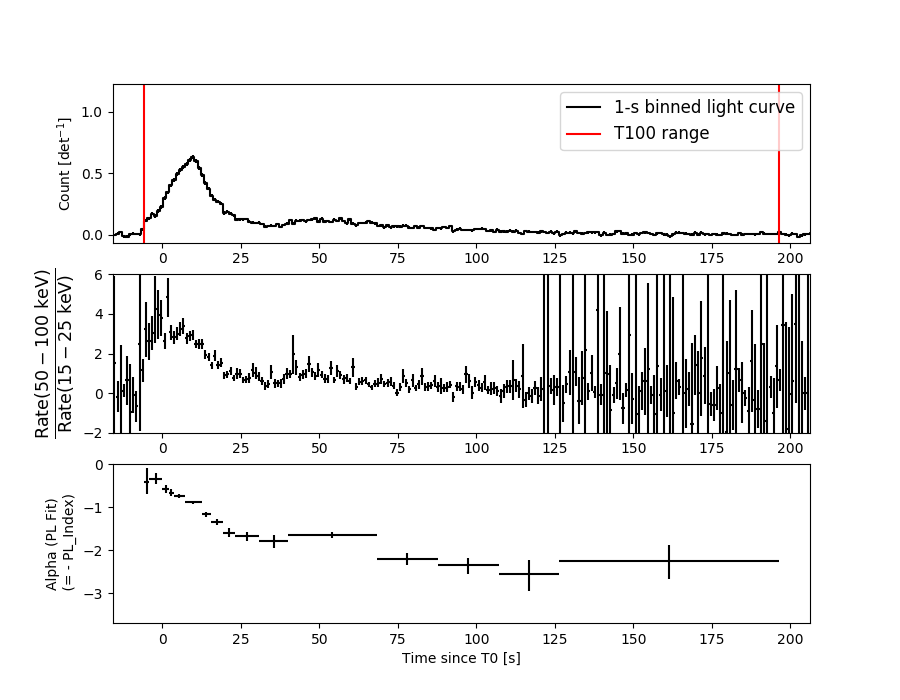
Light Curves
Note: The mask-weighted lightcurves have units of either count/det or counts/sec/det, where a det is 0.4 x 0.4 = 0.16 sq cm.
Full-time range; 1 s binning
Other quick-look light curves:
- 64 ms binning (zoomed)
- 16 ms binning (zoomed)
- 8 ms binning (zoomed)
- 2 ms binning (zoomed)
- SN=5 or 10 s binning (full-time range)
- Raw light curve
Spectra
- 64 ms binning (zoomed)
- 16 ms binning (zoomed)
- 8 ms binning (zoomed)
- 2 ms binning (zoomed)
- SN=5 or 10 s binning (full-time range)
- Raw light curve
Spectra
Notes:
- 1) The fitting includes the systematic errors.
- 2) When the burst includes telescope slew time periods, the fitting uses an average response file made from multiple 5-s response files through out the slew time plus single time preiod for the non-slew times, and weighted by the total counts in the corresponding time period using addrmf. An average response file is needed becuase a spectral fit using the pre-slew DRM will introduce some errors in both a spectral shape and a normalization if the PHA file contains a lot of the slew/post-slew time interval.
- 3) For fits to more complicated models (e.g. a power-law over a cutoff power-law), the BAT team has decided to require a chi-square improvement of more than 6 for each extra dof.
Time averaged spectrum fit using the average DRM
Power-law model
Time interval is from   -5.908 sec. to  196.280 sec.

Spectral model in power-law:
------------------------------------------------------------
Parameters  : value       lower 90%   higher 90%
Photon index: -1.33366     ( -0.0364244   0.0365017 )
Norm@50keV  : 5.95097E-03    ( -0.000110991   0.000110877 )
------------------------------------------------------------
#Fit statistic : Chi-Squared =          31.12 using 59 PHA bins.
# Reduced chi-squared =         0.5459 for     57 degrees of freedom
# Null hypothesis probability =   9.979517e-01

Photon flux (15-150 keV)    in 202.2 sec: 0.714565 ( -0.015113  0.01519 ) ph/cm2/s
Energy fluence (15-150 keV)             : 1.17975e-05 ( -2.24137e-07  2.24027e-07 ) ergs/cm2
Cutoff power-law model

Time interval is from   -5.908 sec. to  196.280 sec.
Spectral model in the cutoff power-law:
------------------------------------------------------------
Parameters  : value       lower 90%   higher 90%
Photon index: -1.28422     ( -0.0626794   0.147458 )
Epeak [keV] : 835.133      ( -873.109 -873.109 )
Norm@50keV  : 6.24554E-03    ( -0.000151065   0.000939427 )
------------------------------------------------------------
#Fit statistic : Chi-Squared =          30.81 using 59 PHA bins.
# Reduced chi-squared =         0.5501 for     56 degrees of freedom
# Null hypothesis probability =   9.975257e-01

Photon flux (15-150 keV)    in 202.2 sec: 0.711628 ( -0.017292  0.015502 ) ph/cm2/s
Energy fluence (15-150 keV)             : 1.17631e-05 ( -2.46039e-07  2.36635e-07 ) ergs/cm2
1-s peak spectrum fit
Power-law model
Time interval is from    8.880 sec. to    9.880 sec.

Spectral model in power-law:
------------------------------------------------------------
Parameters  : value       lower 90%   higher 90%
Photon index: -0.792318     ( -0.0732945   0.0744128 )
Norm@50keV  : 4.49179E-02    ( -0.00201102   0.00200434 )
------------------------------------------------------------
#Fit statistic : Chi-Squared =          58.63 using 59 PHA bins.
# Reduced chi-squared =          1.029 for     57 degrees of freedom
# Null hypothesis probability =   4.153878e-01

Photon flux (15-150 keV)    in 1 sec: 5.16392 ( -0.22699  0.22712 ) ph/cm2/s
Energy fluence (15-150 keV)             : 5.2666e-07 ( -2.45718e-08  2.46299e-08 ) ergs/cm2
Cutoff power-law model
Time interval is from    8.880 sec. to    9.880 sec.
Spectral model in the cutoff power-law:
------------------------------------------------------------
Parameters  : value       lower 90%   higher 90%
Photon index: -0.320594     ( -0.303271   0.326893 )
Epeak [keV] : 212.681      ( -62.798 254.404 )
Norm@50keV  : 7.17533E-02    ( -0.0182277   0.0262939 )
------------------------------------------------------------
#Fit statistic : Chi-Squared =          51.31 using 59 PHA bins.
# Reduced chi-squared =         0.9163 for     56 degrees of freedom
# Null hypothesis probability =   6.525530e-01

Photon flux (15-150 keV)    in 1 sec: 5.10055 ( -0.23063  0.23066 ) ph/cm2/s
Energy fluence (15-150 keV)             : 5.18764e-07 ( -2.57605e-08  2.56133e-08 ) ergs/cm2
Time-resolved spectra
Distribution
T90 vs. Hardness ratio plot
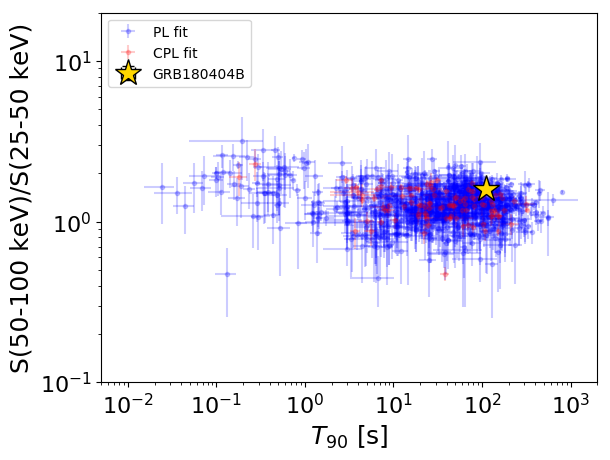
T90                                   = 111.708 sec.
Hardness ratio (energy fluence ratio) = 1.58708431696
S(15-50 keV) vs. S(50-150 keV) plot
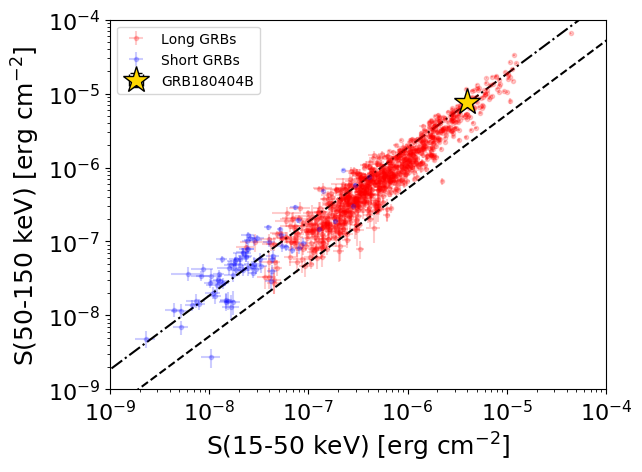
S(15-50 keV)  = 3.990432e-06
S(50-150 keV) = 7.806954e-06
The dash-dotted line and the dashed line traces the fluences calculated from the Band function with Epeak = 15 and 150 keV, respectively. Both lines assume a canonical values of alpha = -1 and beta = -2.5.
Mask shadow pattern
IMX = -3.949684927038987E-01, IMY = 2.538342577597678E-01
Spacecraft aspect plot
Bright source in the pre-burst/pre-slew/post-slew images
Pre-burst image of 15-350 keV band
Time interval of the image:
-239.800000 -5.908000

# RAcent  DECcent POSerr Theta    Phi  PeakCts   SNR AngSep     Name
#  [deg]    [deg]    ['] [deg]  [deg]                   [']
 83.6605  22.0150    1.6  59.2  -16.3   9.3995   7.4    1.5	Crab
135.2994 -40.4930    0.0  39.9   94.9   1.3215   1.4   11.1	Vela X-1
130.6924 -79.0703    2.5  45.9  152.4   2.4676   4.6 ------	UNKNOWN
346.1517 -84.0090    2.8  53.8  171.0   3.3893   4.1 ------	UNKNOWN
 90.0994  -2.0331    3.4  35.6   -5.1   0.9369   3.4 ------	UNKNOWN
 66.3539 -17.7881    2.9  24.6  -59.0   0.9794   4.0 ------	UNKNOWN
Pre-slew background subtracted image of 15-350 keV band
Time interval of the image:
-5.908000 11.900600

# RAcent  DECcent POSerr Theta    Phi  PeakCts   SNR AngSep     Name
#  [deg]    [deg]    ['] [deg]  [deg]                   [']
 83.6193  21.9494    6.2  59.1  -16.3  -1.0493  -1.9    4.0	Crab
135.4658 -40.4494   10.9  40.0   94.9  -0.4245  -1.1    6.9	Vela X-1
111.0214  -5.9492    2.5  40.0   29.1   0.7291   4.6 ------	UNKNOWN
 40.5797 -64.6452    2.5  37.3 -167.6   0.4789   4.6 ------	UNKNOWN
 53.3894 -50.2142    0.1  25.2 -147.3   7.0749  77.6 ------	UNKNOWN
Post-slew image of 15-350 keV band
Time interval of the image:
59.100600 962.228800

# RAcent  DECcent POSerr Theta    Phi  PeakCts   SNR AngSep     Name
#  [deg]    [deg]    ['] [deg]  [deg]                   [']
 90.0037 -22.2732    2.9  39.9   14.3   3.2758   3.9 ------	UNKNOWN
338.1102 -70.7904    2.5  38.8  165.6   4.8453   4.6 ------	UNKNOWN
 53.4336 -50.2020    1.5   0.0   71.9   4.2707   7.7 ------	UNKNOWN
 38.2514 -23.9125    2.8  28.8  -74.7   3.5920   4.1 ------	UNKNOWN
 69.1755   5.7945    3.4  57.6  -26.3  12.9018   3.4 ------	UNKNOWN
 32.8998 -13.8032    4.0  40.0  -76.9   6.0226   2.9 ------	UNKNOWN
  3.3522 -25.6409    3.0  45.3 -121.3  11.2746   3.8 ------	UNKNOWN
356.7331 -27.7389    3.1  48.0 -129.1  12.8246   3.7 ------	UNKNOWN