Analysis Summary
Notes:
- 1) No attempt has been made to eliminate the non-significant decimal places.
- 2) This batgrbproduct analysis is done using the HEASARC data.
- 3) This batgrbproduct analysis is using the flight position for the mask-weighting calculation.
======================================================================
                  BAT GRB EVENT DATA PROCESSING REPORT
    Process Script Ver: batgrbproduct v2.46
    Process Start Time: Fri May 11 18:17:15 EDT 2018
             Host Name: bat1
   Current Working Dir: /local/data/bat1/alien/Swift_3rdBATcatalog/event/batevent_reproc/trigger823001
======================================================================

  Trigger: 00823001      Segment: 000

  BAT Trigger Time: 544758910.528   [s; MET]
      Trigger Stop: 544758914.624   [s; MET]
               UTC: 2018-04-07T01:54:49.782600    [includes UTCF correction]
       Where From?: TDRSS position message

  BAT
    RA: 35.2408716342746   Dec: 33.4989446062235  [deg; J2000]

     Catalogged Source?: NO
     Point Source?:      YES
     GRB Indicated?:     YES    [ by BAT flight software ]
     Image S/N Ratio:    9.45
     Image Trigger?:     NO
     Rate S/N Ratio:     7.74596669241483  [ if not an image trigger ]
     Image S/N Ratio:    9.45

  Analysis Position:   [ source = BAT ]
    RA: 35.2408716342746   Dec: 33.4989446062235  [deg; J2000]

  Refined Position:   [ source = BAT pre-slew burst ]
    RA: 35.2313397464931   Dec: 33.5136117845301  [deg; J2000]
        { 02h 20m 55.5s , +33d 30' 49.0" }
         +/- 1.80268125809312 [arcmin] (estimated 90% radius based on SNR)
         +/- 0.673656164729439 [arcmin] (formal 1-sigma fit error)
    SNR: 13.1075006892778

  Angular difference between the analysis and refined position is 1.000932 arcmin

  Partial Coding Fraction: 0.5234375    [ including projection effects ]

  Duration
     T90: 100.628000020981 +/- 33.9397290559484
        Measured from: -16.1640000343323
                   to: 84.4639999866486     [s; relative to TRIGTIME]
     T50: 31.5279998779297 +/- 8.55009706998901
        Measured from: -0.123999953269958
                   to: 31.4039999246597     [s; relative to TRIGTIME]


  Fluence
     Peak Flux  (peak 1 second)
        Measured from: 2.17200005054474
                   to: 3.17200005054474     [s; relative to TRIGTIME]
     Total Fluence
        Measured from: -20.5720000267029
                   to: 107.108000040054     [s; relative to TRIGTIME]

             Band 1     Band 2     Band 3     Band 4
              15-25      25-50     50-100    100-350     keV
 Total     0.976974   0.966010   0.614106   0.207604
           0.087969   0.091005   0.080501   0.073522 [error]
 Peak      0.035089   0.038146   0.034090   0.010940
           0.008429   0.008590   0.007372   0.006594 [error]

     [ fluence units of on-axis counts / fully illuminated detector ]

======================================================================


====== Table of the duration information =============================

        Value   tstart    tstop
T100  127.680  -20.572  107.108
T90   100.628  -16.164   84.464
T50    31.528   -0.124   31.404
Peak    1.000    2.172    3.172


====== Spectral Analysis Summary =====================================

Model      : spectral model: simple power-law (PL) and cutoff power-law (CPL)
Ph_index   : photon index: E^{Ph_index}
Ph_90err   : 90% error of the photon index
Epeak      : Epeak in keV
Epeak_90err: 90% error of Epeak
Norm       : normalization at 50 keV in both the PL model and CPL model
Nomr_90err : 90% error of the normalization
chi2       : Chi-Squared
dof        : degree of freedo

=== Time-averaged spectral analysis ===
(Best model with acceptable fit: PL)

Model Ph_index Ph_90err_low Ph_90err_hi  Epeak  Epeak_90err_low  Epeak_90err_hi  Norm       Nomr_90err_low    Norm_90err_hi    chi2    dof
PL      -1.908    -0.202      0.193       -           -               -         1.23e-03     -1.56e-04          1.52e-04      67.050   57
CPL     -1.900    -0.688      0.654      517.472      N/A           N/A         1.24e-03        N/A               N/A         67.060   56


=== 1-s peak spectral analysis ===
(Best model with acceptable fit: PL)

Model Ph_index Ph_90err_low Ph_90err_hi  Epeak  Epeak_90err_low  Epeak_90err_hi  Norm       Nomr_90err_low    Norm_90err_hi    chi2    dof
PL      -1.729     -0.411     0.386       -           -               -         6.42e-03     -1.70e-03          1.65e-03      55.890   57
CPL     -1.116     -1.110     1.919       63.663      N/A           N/A         1.42e-02        N/A               N/A         55.280   56


=== Fluence/Peak Flux Summary ===

              Model    Band1     Band2     Band3     Band4     Band5     Total
                       15-25     25-50    50-100    100-350    15-150    15-350    keV
Fluence         PL   2.95e-07  4.23e-07  4.51e-07  8.91e-07  1.44e-06  2.06e-06   erg/cm2
      90%_error_low -4.33e-08 -4.24e-08 -7.82e-08 -2.78e-07 -1.77e-07 -3.66e-07   erg/cm2
      90%_error_hi   4.44e-08  4.23e-08  7.96e-08  3.53e-07  1.81e-07  4.26e-07   erg/cm2
Peak flux       PL   3.29e-01  2.90e-01  1.75e-01  1.59e-01  8.62e-01  9.53e-01   ph/cm2/s
      90%_error_low -1.09e-01 -6.74e-02 -5.79e-02 -8.29e-02 -2.00e-01 -2.24e-01   ph/cm2/s
      90%_error_hi   1.16e-01  6.72e-02  5.84e-02  1.23e-01  2.00e-01  2.26e-01   ph/cm2/s

Fluence        CPL   2.96e-07  4.19e-07  4.51e-07  9.09e-07  1.46e-06  2.06e-06   erg/cm2
      90%_error_low -5.04e-08 -4.08e-08 -9.33e-08 -6.44e-07 -2.07e-07 -6.69e-07   erg/cm2
      90%_error_hi   4.80e-08  5.79e-08  5.34e-08  2.16e-08  1.64e-07  2.16e-07   erg/cm2
Peak flux      CPL   3.09e-01  3.13e-01  1.78e-01  7.36e-02  8.48e-01  8.74e-01   ph/cm2/s
      90%_error_low -1.21e-01 -8.22e-02 -6.94e-02 -7.36e-02 -2.01e-01 -2.19e-01   ph/cm2/s
      90%_error_hi   1.24e-01  9.15e-02  6.51e-02  1.21e-01  2.02e-01  2.51e-01   ph/cm2/s

======================================================================
Image
Pre-slew 15.0-350.0 keV image (Event data)
#   RAcent    DECcent   POSerr    Theta     Phi              Peak Cts       SNR   Name
   35.2313    33.5136   0.0147    25.7356   -98.2474         2.6997254     13.108 TRIG_00823001

Foreground time interval of the image:
-20.572 107.108 (delta_t = 127.680 [sec])
Background time interval of the image:
-239.528 -20.572 (delta_t = 218.956 [sec])
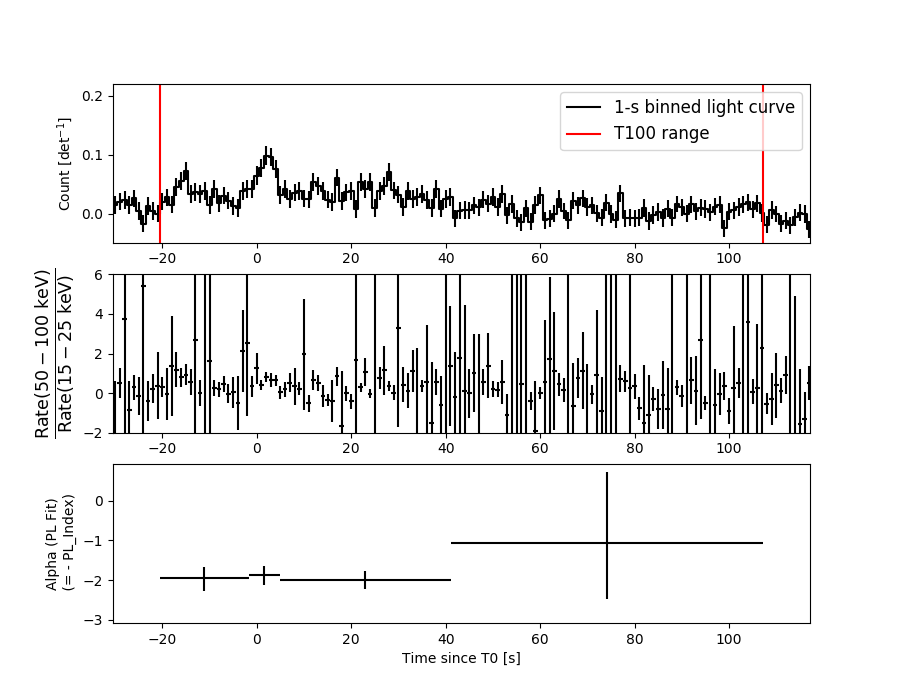
Light Curves
Note: The mask-weighted lightcurves have units of either count/det or counts/sec/det, where a det is 0.4 x 0.4 = 0.16 sq cm.
Full-time range; 1 s binning
Other quick-look light curves:
- 64 ms binning (zoomed)
- 16 ms binning (zoomed)
- 8 ms binning (zoomed)
- 2 ms binning (zoomed)
- SN=5 or 10 s binning (full-time range)
- Raw light curve
Spectra
- 64 ms binning (zoomed)
- 16 ms binning (zoomed)
- 8 ms binning (zoomed)
- 2 ms binning (zoomed)
- SN=5 or 10 s binning (full-time range)
- Raw light curve
Spectra
Notes:
- 1) The fitting includes the systematic errors.
- 2) When the burst includes telescope slew time periods, the fitting uses an average response file made from multiple 5-s response files through out the slew time plus single time preiod for the non-slew times, and weighted by the total counts in the corresponding time period using addrmf. An average response file is needed becuase a spectral fit using the pre-slew DRM will introduce some errors in both a spectral shape and a normalization if the PHA file contains a lot of the slew/post-slew time interval.
- 3) For fits to more complicated models (e.g. a power-law over a cutoff power-law), the BAT team has decided to require a chi-square improvement of more than 6 for each extra dof.
Time averaged spectrum fit using the average DRM
Power-law model
Time interval is from  -20.572 sec. to  107.108 sec.

Spectral model in power-law:
------------------------------------------------------------
Parameters  : value       lower 90%   higher 90%
Photon index: -1.90766     ( -0.201819   0.192923 )
Norm@50keV  : 1.23041E-03    ( -0.000156271   0.000152229 )
------------------------------------------------------------
#Fit statistic : Chi-Squared =          67.05 using 59 PHA bins.
# Reduced chi-squared =          1.176 for     57 degrees of freedom
# Null hypothesis probability =   1.704443e-01

Photon flux (15-150 keV)    in 127.7 sec: 0.177165 ( -0.01776  0.017765 ) ph/cm2/s
Energy fluence (15-150 keV)             : 1.44487e-06 ( -1.7687e-07  1.80753e-07 ) ergs/cm2
Cutoff power-law model
Time interval is from  -20.572 sec. to  107.108 sec.
Spectral model in the cutoff power-law:
------------------------------------------------------------
Parameters  : value       lower 90%   higher 90%
Photon index: -1.90017     ( -0.683771   0.658519 )
Epeak [keV] : 517.472      (   )
Norm@50keV  : 1.24180E-03    (     )
------------------------------------------------------------
#Fit statistic : Chi-Squared =          67.05 using 59 PHA bins.
# Reduced chi-squared =          1.197 for     56 degrees of freedom
# Null hypothesis probability =   1.480748e-01

Photon flux (15-150 keV)    in 127.7 sec: 0.177628 ( -0.019139  0.018098 ) ph/cm2/s
Energy fluence (15-150 keV)             : 1.45579e-06 ( -2.07229e-07  1.6408e-07 ) ergs/cm2
1-s peak spectrum fit
Power-law model
Time interval is from    2.172 sec. to    3.172 sec.

Spectral model in power-law:
------------------------------------------------------------
Parameters  : value       lower 90%   higher 90%
Photon index: -1.72867     ( -0.411029   0.386184 )
Norm@50keV  : 6.42382E-03    ( -0.00170117   0.00164731 )
------------------------------------------------------------
#Fit statistic : Chi-Squared =          55.89 using 59 PHA bins.
# Reduced chi-squared =         0.9805 for     57 degrees of freedom
# Null hypothesis probability =   5.168358e-01

Photon flux (15-150 keV)    in 1 sec: 0.861918 ( -0.199654  0.199752 ) ph/cm2/s
Energy fluence (15-150 keV)             : 5.93622e-08 ( -1.58681e-08  1.63978e-08 ) ergs/cm2
Cutoff power-law model
Time interval is from    2.172 sec. to    3.172 sec.
Spectral model in the cutoff power-law:
------------------------------------------------------------
Parameters  : value       lower 90%   higher 90%
Photon index: -1.1158     ( -1.10907   1.9199 )
Epeak [keV] : 63.6626      (   )
Norm@50keV  : 1.42130E-02    (     )
------------------------------------------------------------
#Fit statistic : Chi-Squared =          55.28 using 59 PHA bins.
# Reduced chi-squared =         0.9871 for     56 degrees of freedom
# Null hypothesis probability =   5.022646e-01

Photon flux (15-150 keV)    in 1 sec: 0.848209 ( -0.201306  0.201721 ) ph/cm2/s
Energy fluence (15-150 keV)             : 5.62005e-08 ( -1.69749e-08  1.77141e-08 ) ergs/cm2
Time-resolved spectra
Distribution
T90 vs. Hardness ratio plot
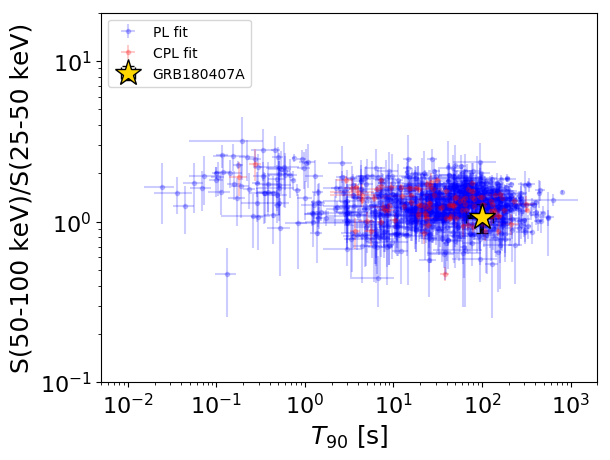
T90                                   = 100.628 sec.
Hardness ratio (energy fluence ratio) = 1.06615413887
S(15-50 keV) vs. S(50-150 keV) plot
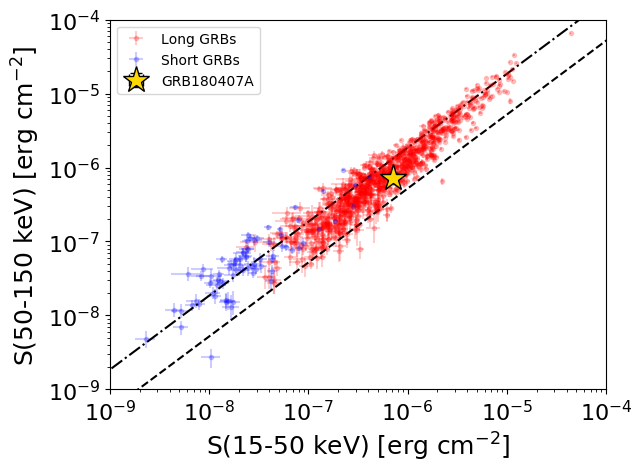
S(15-50 keV)  = 7.171573e-07
S(50-150 keV) = 7.27732e-07
The dash-dotted line and the dashed line traces the fluences calculated from the Band function with Epeak = 15 and 150 keV, respectively. Both lines assume a canonical values of alpha = -1 and beta = -2.5.
Mask shadow pattern
IMX = -6.914670584882650E-02, IMY = 4.770480688083115E-01
Spacecraft aspect plot
Bright source in the pre-burst/pre-slew/post-slew images
Pre-burst image of 15-350 keV band
Time interval of the image:
-239.528000 -20.572000

# RAcent  DECcent POSerr Theta    Phi  PeakCts   SNR AngSep     Name
#  [deg]    [deg]    ['] [deg]  [deg]                   [']
 83.6299  22.0089    0.4  37.6  173.1   8.9112  30.3    0.4	Crab
355.2041  42.7007    3.1  41.4  -44.1   1.5848   3.7 ------	UNKNOWN
 37.7725  12.8448    3.0  43.9 -116.5   3.6802   3.8 ------	UNKNOWN
Pre-slew background subtracted image of 15-350 keV band
Time interval of the image:
-20.572000 107.108000

# RAcent  DECcent POSerr Theta    Phi  PeakCts   SNR AngSep     Name
#  [deg]    [deg]    ['] [deg]  [deg]                   [']
 83.6344  22.1739   32.5  37.4  173.0   0.0771   0.4    9.6	Crab
 74.9323   5.6806    2.4  50.3 -167.6   1.9097   4.7 ------	UNKNOWN
 35.2313  33.5136    0.9  25.7  -98.2   2.6998  13.1 ------	UNKNOWN
Post-slew image of 15-350 keV band
Time interval of the image:
187.772580 962.582900

# RAcent  DECcent POSerr Theta    Phi  PeakCts   SNR AngSep     Name
#  [deg]    [deg]    ['] [deg]  [deg]                   [']
 83.6438  22.0010    0.3  33.5 -124.2  30.1661  34.7    1.0	Crab
160.5950  49.8019    2.7  33.9   27.8   2.9860   4.3 ------	UNKNOWN
131.3099  52.3651    2.9  20.1   -0.2   1.9611   4.1 ------	UNKNOWN
144.3157  66.0224    4.3  35.1   -4.7   1.8759   2.7 ------	UNKNOWN
148.1265  71.1865    2.8  40.0   -8.1   3.2023   4.1 ------	UNKNOWN
 93.2712  31.0351    3.5  22.0 -113.4   1.8460   3.3 ------	UNKNOWN
 75.2707   4.0597    2.4  50.7 -138.7  13.2804   4.7 ------	UNKNOWN
 72.7224  10.7542    2.6  48.4 -129.8  10.8537   4.5 ------	UNKNOWN