Analysis Summary
Notes:
- 1) No attempt has been made to eliminate the non-significant decimal places.
- 2) This batgrbproduct analysis is done using the HEASARC data.
- 3) This batgrbproduct analysis is using the flight position for the mask-weighting calculation.
======================================================================
                  BAT GRB EVENT DATA PROCESSING REPORT
    Process Script Ver: batgrbproduct v2.46
    Process Start Time: Fri May 11 18:09:20 EDT 2018
             Host Name: bat1
   Current Working Dir: /local/data/bat1/alien/Swift_3rdBATcatalog/event/batevent_reproc/trigger824451
======================================================================

  Trigger: 00824451      Segment: 000

  BAT Trigger Time: 545142484.48   [s; MET]
      Trigger Stop: 545142485.504   [s; MET]
               UTC: 2018-04-11T12:27:43.711420    [includes UTCF correction]
       Where From?: TDRSS position message

  BAT
    RA: 356.82917852822   Dec: 66.7906613390428  [deg; J2000]

     Catalogged Source?: NO
     Point Source?:      YES
     GRB Indicated?:     YES    [ by BAT flight software ]
     Image S/N Ratio:    18.13
     Image Trigger?:     NO
     Rate S/N Ratio:     41.3037528561268  [ if not an image trigger ]
     Image S/N Ratio:    18.13

  Analysis Position:   [ source = BAT ]
    RA: 356.82917852822   Dec: 66.7906613390428  [deg; J2000]

  Refined Position:   [ source = BAT pre-slew burst ]
    RA: 356.838617399312   Dec: 66.7913774559664  [deg; J2000]
        { 23h 47m 21.3s , +66d 47' 29.0" }
         +/- 0.583864972386274 [arcmin] (estimated 90% radius based on SNR)
         +/- 0.129710406572692 [arcmin] (formal 1-sigma fit error)
    SNR: 65.6081478780531

  Angular difference between the analysis and refined position is 0.227282 arcmin

  Partial Coding Fraction: 0.9765625    [ including projection effects ]

  Duration
     T90: 77.9759999513626 +/- 1.00622860823171
        Measured from: -1.22399997711182
                   to: 76.7519999742508     [s; relative to TRIGTIME]
     T50: 47.4359999895096 +/- 0.958081354529446
        Measured from: 14.6119999885559
                   to: 62.0479999780655     [s; relative to TRIGTIME]


  Fluence
     Peak Flux  (peak 1 second)
        Measured from: 51.7400000095367
                   to: 52.7400000095367     [s; relative to TRIGTIME]
     Total Fluence
        Measured from: -6.92000007629395
                   to: 100.824000000954     [s; relative to TRIGTIME]

             Band 1     Band 2     Band 3     Band 4
              15-25      25-50     50-100    100-350     keV
 Total     5.207478   7.241304   5.718231   1.484931
           0.064025   0.068458   0.061141   0.048148 [error]
 Peak      0.167794   0.267304   0.266269   0.089502
           0.007795   0.009386   0.009320   0.006834 [error]

     [ fluence units of on-axis counts / fully illuminated detector ]

======================================================================


====== Table of the duration information =============================

        Value   tstart    tstop
T100  107.744   -6.920  100.824
T90    77.976   -1.224   76.752
T50    47.436   14.612   62.048
Peak    1.000   51.740   52.740


====== Spectral Analysis Summary =====================================

Model      : spectral model: simple power-law (PL) and cutoff power-law (CPL)
Ph_index   : photon index: E^{Ph_index}
Ph_90err   : 90% error of the photon index
Epeak      : Epeak in keV
Epeak_90err: 90% error of Epeak
Norm       : normalization at 50 keV in both the PL model and CPL model
Nomr_90err : 90% error of the normalization
chi2       : Chi-Squared
dof        : degree of freedo

=== Time-averaged spectral analysis ===
(Best model with acceptable fit: PL)

Model Ph_index Ph_90err_low Ph_90err_hi  Epeak  Epeak_90err_low  Epeak_90err_hi  Norm       Nomr_90err_low    Norm_90err_hi    chi2    dof
PL      -1.452    -0.030      0.030       -           -               -         1.18e-02     -1.86e-04          1.86e-04      40.210   57
CPL     -1.350    -0.113      0.124      380.400    -173.594      -380.400      1.30e-02     -1.21e-03          1.60e-03      38.120   56


=== 1-s peak spectral analysis ===
(Best model with acceptable fit: PL)

Model Ph_index Ph_90err_low Ph_90err_hi  Epeak  Epeak_90err_low  Epeak_90err_hi  Norm       Nomr_90err_low    Norm_90err_hi    chi2    dof
PL      -1.116     -0.068     0.068       -           -               -         5.10e-02     -1.92e-03          1.92e-03      58.980   57
CPL     -0.991     -0.156     0.264      454.519    -454.519      -454.519      5.82e-02     -8.52e-03          1.78e-02      58.260   56


=== Fluence/Peak Flux Summary ===

              Model    Band1     Band2     Band3     Band4     Band5     Total
                       15-25     25-50    50-100    100-350    15-150    15-350    keV
Fluence         PL   1.55e-06  2.94e-06  4.29e-06  1.34e-05  1.22e-05  2.22e-05   erg/cm2
      90%_error_low -5.43e-08 -5.98e-08 -7.38e-08 -5.46e-07 -1.89e-07 -5.66e-07   erg/cm2
      90%_error_hi   5.51e-08  5.96e-08  7.37e-08  5.63e-07  1.89e-07  5.79e-07   erg/cm2
Peak flux       PL   1.46e+00  1.84e+00  1.70e+00  2.74e+00  5.93e+00  7.74e+00   ph/cm2/s
      90%_error_low -1.10e-01 -8.42e-02 -7.36e-02 -2.51e-01 -2.29e-01 -3.17e-01   ph/cm2/s
      90%_error_hi   1.13e-01  8.38e-02  7.32e-02  2.66e-01  2.30e-01  3.20e-01   ph/cm2/s

Fluence        CPL   1.50e-06  2.94e-06  4.34e-06  1.19e-05  1.21e-05  2.07e-05   erg/cm2
      90%_error_low -7.59e-08 -6.07e-08 -8.93e-08 -1.55e-06 -2.05e-07 -1.55e-06   erg/cm2
      90%_error_hi   7.18e-08  6.07e-08  8.98e-08  1.66e-06  2.05e-07  8.58e-07   erg/cm2
Peak flux      CPL   9.45e-01  7.15e-01  3.78e-01  3.48e-01  2.18e+00  2.39e+00   ph/cm2/s
      90%_error_low -1.66e-01 -1.01e-01 -2.92e-02 -5.19e-02 -2.81e-01 -2.29e-01   ph/cm2/s
      90%_error_hi   1.34e-01  6.98e-02  2.04e-02  4.50e-02  1.92e-01  1.57e-01   ph/cm2/s

======================================================================
Image
Pre-slew 15.0-350.0 keV image (Event data)
#   RAcent    DECcent   POSerr    Theta     Phi              Peak Cts       SNR   Name
  356.8386    66.7914   0.0029    19.4806    17.9168         4.6642698     65.608 TRIG_00824451

Foreground time interval of the image:
 -6.920  12.421 (delta_t =  19.341 [sec])
Background time interval of the image:
-122.379  -6.920 (delta_t = 115.459 [sec])
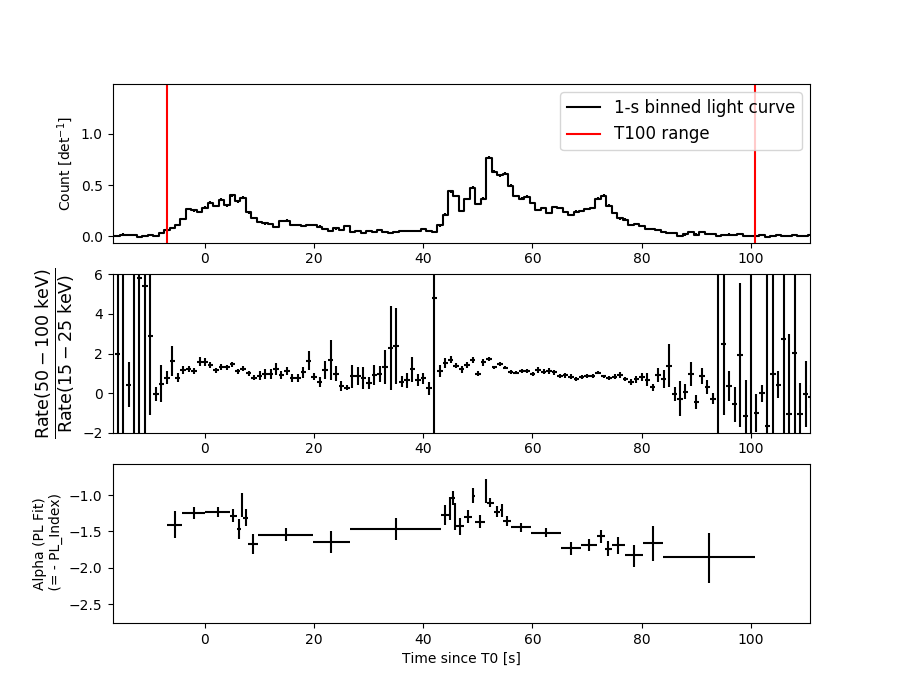
Light Curves
Note: The mask-weighted lightcurves have units of either count/det or counts/sec/det, where a det is 0.4 x 0.4 = 0.16 sq cm.
Full-time range; 1 s binning
Other quick-look light curves:
- 64 ms binning (zoomed)
- 16 ms binning (zoomed)
- 8 ms binning (zoomed)
- 2 ms binning (zoomed)
- SN=5 or 10 s binning (full-time range)
- Raw light curve
Spectra
- 64 ms binning (zoomed)
- 16 ms binning (zoomed)
- 8 ms binning (zoomed)
- 2 ms binning (zoomed)
- SN=5 or 10 s binning (full-time range)
- Raw light curve
Spectra
Notes:
- 1) The fitting includes the systematic errors.
- 2) When the burst includes telescope slew time periods, the fitting uses an average response file made from multiple 5-s response files through out the slew time plus single time preiod for the non-slew times, and weighted by the total counts in the corresponding time period using addrmf. An average response file is needed becuase a spectral fit using the pre-slew DRM will introduce some errors in both a spectral shape and a normalization if the PHA file contains a lot of the slew/post-slew time interval.
- 3) For fits to more complicated models (e.g. a power-law over a cutoff power-law), the BAT team has decided to require a chi-square improvement of more than 6 for each extra dof.
Time averaged spectrum fit using the average DRM
Power-law model
Time interval is from   -6.920 sec. to  100.824 sec.

Spectral model in power-law:
------------------------------------------------------------
Parameters  : value       lower 90%   higher 90%
Photon index: -1.45218     ( -0.0301049   0.0301674 )
Norm@50keV  : 1.18016E-02    ( -0.000186476   0.00018625 )
------------------------------------------------------------
#Fit statistic : Chi-Squared =          40.21 using 59 PHA bins.
# Reduced chi-squared =         0.7054 for     57 degrees of freedom
# Null hypothesis probability =   9.551341e-01

Photon flux (15-150 keV)    in 107.7 sec: 1.45521 ( -0.02748  0.02758 ) ph/cm2/s
Energy fluence (15-150 keV)             : 1.21595e-05 ( -1.88951e-07  1.88997e-07 ) ergs/cm2
Cutoff power-law model
Time interval is from   -6.920 sec. to  100.824 sec.
Spectral model in the cutoff power-law:
------------------------------------------------------------
Parameters  : value       lower 90%   higher 90%
Photon index: -1.34973     ( -0.112562   0.123592 )
Epeak [keV] : 380.400      ( -173.601 -380.407 )
Norm@50keV  : 1.30235E-02    ( -0.00121075   0.00159948 )
------------------------------------------------------------
#Fit statistic : Chi-Squared =          38.12 using 59 PHA bins.
# Reduced chi-squared =         0.6808 for     56 degrees of freedom
# Null hypothesis probability =   9.676482e-01

Photon flux (15-150 keV)    in 107.7 sec: 1.44127 ( -0.03156  0.03178 ) ph/cm2/s
Energy fluence (15-150 keV)             : 1.2091e-05 ( -2.04775e-07  2.04722e-07 ) ergs/cm2
1-s peak spectrum fit
Power-law model

Time interval is from   51.740 sec. to   52.740 sec.

Spectral model in power-law:
------------------------------------------------------------
Parameters  : value       lower 90%   higher 90%
Photon index: -1.1163     ( -0.0676807   0.067927 )
Norm@50keV  : 5.10205E-02    ( -0.00192355   0.00192318 )
------------------------------------------------------------
#Fit statistic : Chi-Squared =          58.98 using 59 PHA bins.
# Reduced chi-squared =          1.035 for     57 degrees of freedom
# Null hypothesis probability =   4.028281e-01

Photon flux (15-150 keV)    in 1 sec: 5.92773 ( -0.22937  0.22954 ) ph/cm2/s
Energy fluence (15-150 keV)             : 5.3075e-07 ( -2.24033e-08  2.24727e-08 ) ergs/cm2
Cutoff power-law model
Time interval is from   51.740 sec. to   52.740 sec.
Spectral model in the cutoff power-law:
------------------------------------------------------------
Parameters  : value       lower 90%   higher 90%
Photon index: -0.990782     ( -0.156109   0.264253 )
Epeak [keV] : 454.519      ( -454.519 -454.519 )
Norm@50keV  : 5.81681E-02    ( -0.00851595   0.0178348 )
------------------------------------------------------------
#Fit statistic : Chi-Squared =          58.26 using 59 PHA bins.
# Reduced chi-squared =          1.040 for     56 degrees of freedom
# Null hypothesis probability =   3.920748e-01

Photon flux (15-150 keV)    in 1 sec: 2.17827 ( -0.28083  0.19236 ) ph/cm2/s
Energy fluence (15-150 keV)             : 1.33052e-07 ( -1.57866e-08  1.00382e-08 ) ergs/cm2
Time-resolved spectra
Distribution
T90 vs. Hardness ratio plot
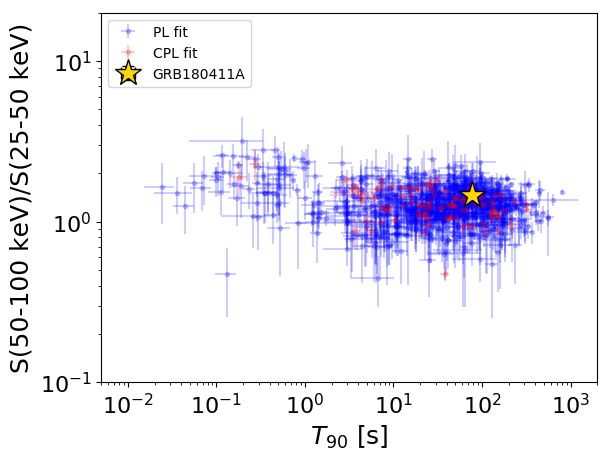
T90                                   = 77.976 sec.
Hardness ratio (energy fluence ratio) = 1.46190824876
S(15-50 keV) vs. S(50-150 keV) plot
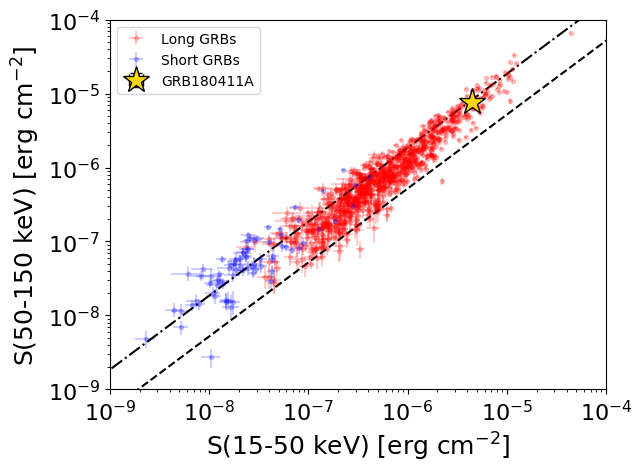
S(15-50 keV)  = 4.488071e-06
S(50-150 keV) = 7.671513e-06
The dash-dotted line and the dashed line traces the fluences calculated from the Band function with Epeak = 15 and 150 keV, respectively. Both lines assume a canonical values of alpha = -1 and beta = -2.5.
Mask shadow pattern
IMX = 3.365826677118053E-01, IMY = -1.088219953013595E-01
Spacecraft aspect plot
Bright source in the pre-burst/pre-slew/post-slew images
Pre-burst image of 15-350 keV band
Time interval of the image:
-122.379410 -6.920000

# RAcent  DECcent POSerr Theta    Phi  PeakCts   SNR AngSep     Name
#  [deg]    [deg]    ['] [deg]  [deg]                   [']
 83.6191  22.0187    0.9  49.1 -163.1   4.1838  12.5    0.8	Crab
308.0378  41.0461  152.8  56.0    7.9   0.0557   0.1    6.5	Cyg X-3
326.0941  38.3984    7.4  49.9   -8.1   0.4020   1.6    5.9	Cyg X-2
163.0052  72.0361    3.1  40.7   96.8   2.1852   3.7 ------	UNKNOWN
 16.2105  70.9032    2.8  13.5   37.5   0.4941   4.2 ------	UNKNOWN
Pre-slew background subtracted image of 15-350 keV band
Time interval of the image:
-6.920000 12.420600

# RAcent  DECcent POSerr Theta    Phi  PeakCts   SNR AngSep     Name
#  [deg]    [deg]    ['] [deg]  [deg]                   [']
 83.6437  22.1413    8.4  49.0 -163.2   0.2254   1.4    7.6	Crab
308.0951  40.7950    4.4  56.2    7.7  -1.1411  -2.9    9.5	Cyg X-3
326.2590  38.2514    5.0  50.0   -8.3   0.3350   2.3    5.9	Cyg X-2
356.8386  66.7914    0.2  19.5   17.9   4.6644  65.6 ------	UNKNOWN
 96.2416  27.2057    2.2  50.0 -179.6   0.9464   5.2 ------	UNKNOWN
Post-slew image of 15-350 keV band
Time interval of the image:
53.220600 962.613200

# RAcent  DECcent POSerr Theta    Phi  PeakCts   SNR AngSep     Name
#  [deg]    [deg]    ['] [deg]  [deg]                   [']
299.5648  35.2302    1.5  45.2   12.2   8.9481   7.9    2.1	Cyg X-1
308.0826  41.0439    2.6  36.9    7.5   3.2410   4.5    5.6	Cyg X-3
326.1546  38.2476   11.0  33.4  -16.5   0.7141   1.0    4.5	Cyg X-2
208.5644  76.9163    3.1  35.0  104.7   4.7281   3.7 ------	UNKNOWN
301.2576  40.5903    3.4  39.9   14.3   2.7659   3.4 ------	UNKNOWN
322.6603  65.6858    3.4  13.6   38.0   1.8989   3.4 ------	UNKNOWN
356.8388  66.7803    0.7   0.0  141.4   8.8087  16.5 ------	UNKNOWN
 40.8513  61.4206    2.1  19.5 -158.5   3.4519   5.4 ------	UNKNOWN
 85.1646  44.0127    3.2  49.7 -172.8   5.1237   3.6 ------	UNKNOWN
 88.4142  36.0789    2.8  57.8 -170.7  16.8553   4.1 ------	UNKNOWN
  6.6644  27.2229    3.4  40.0  -77.0   7.5797   3.4 ------	UNKNOWN
 48.1353  29.6584    2.5  48.0 -129.1  15.0004   4.6 ------	UNKNOWN