Analysis Summary
Notes:
- 1) No attempt has been made to eliminate the non-significant decimal places.
- 2) This batgrbproduct analysis is done using the HEASARC data.
- 3) This batgrbproduct analysis is using the flight position for the mask-weighting calculation.
======================================================================
BAT GRB EVENT DATA PROCESSING REPORT
Process Script Ver: batgrbproduct v2.46
Process Start Time: Fri May 11 17:56:45 EDT 2018
Host Name: bat1
Current Working Dir: /local/data/bat1/alien/Swift_3rdBATcatalog/event/batevent_reproc/trigger828672
======================================================================
Trigger: 00828672 Segment: 000
BAT Trigger Time: 546331602.624 [s; MET]
Trigger Stop: 546331603.648 [s; MET]
UTC: 2018-04-25T06:46:21.783300 [includes UTCF correction]
Where From?: TDRSS position message
BAT
RA: 64.4693420741548 Dec: -32.9558700086783 [deg; J2000]
Catalogged Source?: NO
Point Source?: YES
GRB Indicated?: YES [ by BAT flight software ]
Image S/N Ratio: 7.04
Image Trigger?: NO
Rate S/N Ratio: 11.916375287813 [ if not an image trigger ]
Image S/N Ratio: 7.04
Analysis Position: [ source = BAT ]
RA: 64.4693420741548 Dec: -32.9558700086783 [deg; J2000]
Refined Position: [ source = BAT pre-slew burst ]
RA: 64.449873847829 Dec: -32.9496748491724 [deg; J2000]
{ 04h 17m 48.0s , -32d 56' 58.8" }
+/- 1.43149951071087 [arcmin] (estimated 90% radius based on SNR)
+/- 0.602468325782637 [arcmin] (formal 1-sigma fit error)
SNR: 18.2204675571074
Angular difference between the analysis and refined position is 1.048285 arcmin
Partial Coding Fraction: 0.2734375 [ including projection effects ]
Duration
T90: 11.9039998054504 +/- 2.71227132798173
Measured from: -0.135999917984009
to: 11.7679998874664 [s; relative to TRIGTIME]
T50: 4.54399991035461 +/- 1.2959012195006
Measured from: 1.59200000762939
to: 6.13599991798401 [s; relative to TRIGTIME]
Fluence
Peak Flux (peak 1 second)
Measured from: 1.18800008296967
to: 2.18800008296967 [s; relative to TRIGTIME]
Total Fluence
Measured from: -0.967999935150146
to: 12.7280000448227 [s; relative to TRIGTIME]
Band 1 Band 2 Band 3 Band 4
15-25 25-50 50-100 100-350 keV
Total 0.355831 0.641305 0.558414 0.068687
0.043940 0.047337 0.042942 0.035340 [error]
Peak 0.056093 0.061012 0.106232 0.032030
0.012799 0.013903 0.013493 0.010643 [error]
[ fluence units of on-axis counts / fully illuminated detector ]
======================================================================
====== Table of the duration information =============================
Value tstart tstop
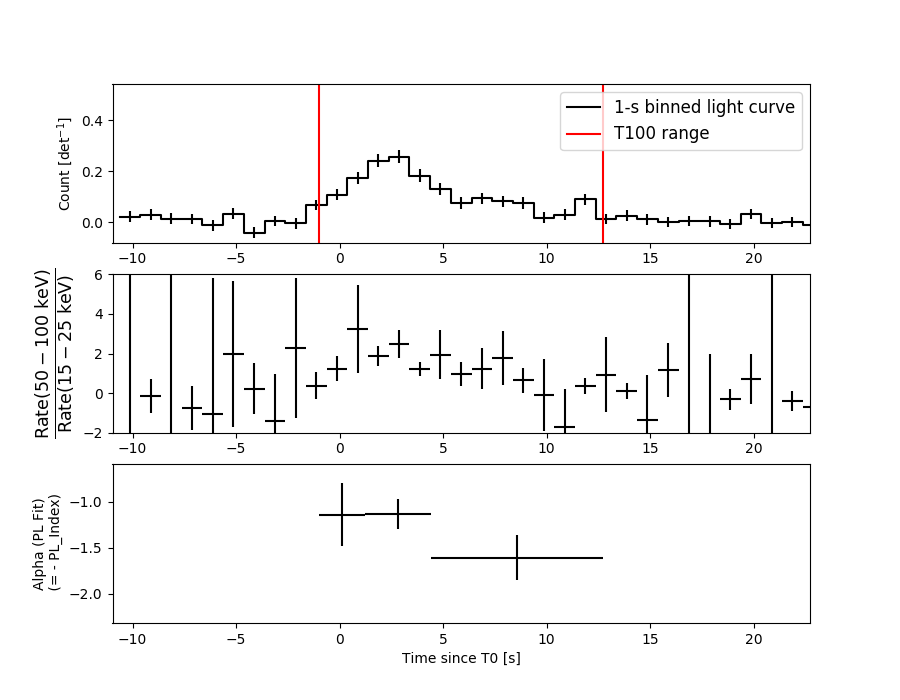
T100 13.696 -0.968 12.728
T90 11.904 -0.136 11.768
T50 4.544 1.592 6.136
Peak 1.000 1.188 2.188
====== Spectral Analysis Summary =====================================
Model : spectral model: simple power-law (PL) and cutoff power-law (CPL)
Ph_index : photon index: E^{Ph_index}
Ph_90err : 90% error of the photon index
Epeak : Epeak in keV
Epeak_90err: 90% error of Epeak
Norm : normalization at 50 keV in both the PL model and CPL model
Nomr_90err : 90% error of the normalization
chi2 : Chi-Squared
dof : degree of freedo
=== Time-averaged spectral analysis ===
(Best model with acceptable fit: PL)
Model Ph_index Ph_90err_low Ph_90err_hi Epeak Epeak_90err_low Epeak_90err_hi Norm Nomr_90err_low Norm_90err_hi chi2 dof
PL -1.322 -0.134 0.135 - - - 8.76e-03 -7.04e-04 7.04e-04 51.140 57
CPL -0.902 -0.472 0.558 133.630 -50.197 -133.630 1.42e-02 -5.75e-03 1.23e-02 49.050 56
=== 1-s peak spectral analysis ===
(Best model with acceptable fit: PL)
Model Ph_index Ph_90err_low Ph_90err_hi Epeak Epeak_90err_low Epeak_90err_hi Norm Nomr_90err_low Norm_90err_hi chi2 dof
PL -0.862 -0.274 0.295 - - - 1.72e-02 -2.97e-03 2.90e-03 70.550 57
CPL -0.180 -0.893 1.712 167.122 -167.122 -167.122 3.23e-02 -1.74e-02 9.95e-02 69.650 56
=== Fluence/Peak Flux Summary ===
Model Band1 Band2 Band3 Band4 Band5 Total
15-25 25-50 50-100 100-350 15-150 15-350 keV
Fluence PL 1.30e-07 2.66e-07 4.25e-07 1.52e-06 1.18e-06 2.34e-06 erg/cm2
90%_error_low -1.84e-08 -2.37e-08 -4.15e-08 -2.96e-07 -1.03e-07 -3.29e-07 erg/cm2
90%_error_hi 1.91e-08 2.35e-08 4.12e-08 3.42e-07 1.04e-07 3.66e-07 erg/cm2
Peak flux PL 3.85e-01 5.68e-01 6.25e-01 1.29e+00 1.97e+00 2.87e+00 ph/cm2/s
90%_error_low -1.31e-01 -1.29e-01 -1.01e-01 -3.99e-01 -3.33e-01 -4.84e-01 ph/cm2/s
90%_error_hi 1.50e-01 1.27e-01 1.00e-01 5.10e-01 3.36e-01 5.08e-01 ph/cm2/s
Fluence CPL 1.21e-07 2.78e-07 4.40e-07 8.23e-07 1.15e-06 1.66e-06 erg/cm2
90%_error_low -2.12e-08 -2.80e-08 -4.55e-08 -4.01e-07 -1.13e-07 -4.11e-07 erg/cm2
90%_error_hi 2.16e-08 2.89e-08 4.65e-08 7.11e-07 1.12e-07 1.14e-06 erg/cm2
Peak flux CPL 3.08e-01 5.72e-01 6.79e-01 7.55e-01 1.92e+00 2.31e+00 ph/cm2/s
90%_error_low -1.74e-01 -1.45e-01 -6.88e-02 -4.29e-01 -3.53e-01 -6.04e-01 ph/cm2/s
90%_error_hi 9.99e-02 1.39e-01 1.44e-01 9.45e-01 3.51e-01 8.19e-01 ph/cm2/s
======================================================================
Image
Pre-slew 15.0-350.0 keV image (Event data)
#   RAcent    DECcent   POSerr    Theta     Phi              Peak Cts       SNR   Name
   64.4499   -32.9497   0.0105    36.5565   -62.2576         1.6585503     18.220 TRIG_00828672

Foreground time interval of the image:
 -0.968  12.077 (delta_t =  13.045 [sec])
Background time interval of the image:
-239.624  -0.968 (delta_t = 238.656 [sec])
Light Curves
Note: The mask-weighted lightcurves have units of either count/det or counts/sec/det, where a det is 0.4 x 0.4 = 0.16 sq cm.
Full-time range; 1 s binning
Other quick-look light curves:
- 64 ms binning (zoomed)
- 16 ms binning (zoomed)
- 8 ms binning (zoomed)
- 2 ms binning (zoomed)
- SN=5 or 10 s binning (full-time range)
- Raw light curve
Spectra
- 64 ms binning (zoomed)
- 16 ms binning (zoomed)
- 8 ms binning (zoomed)
- 2 ms binning (zoomed)
- SN=5 or 10 s binning (full-time range)
- Raw light curve
Spectra
Notes:
- 1) The fitting includes the systematic errors.
- 2) When the burst includes telescope slew time periods, the fitting uses an average response file made from multiple 5-s response files through out the slew time plus single time preiod for the non-slew times, and weighted by the total counts in the corresponding time period using addrmf. An average response file is needed becuase a spectral fit using the pre-slew DRM will introduce some errors in both a spectral shape and a normalization if the PHA file contains a lot of the slew/post-slew time interval.
- 3) For fits to more complicated models (e.g. a power-law over a cutoff power-law), the BAT team has decided to require a chi-square improvement of more than 6 for each extra dof.
Time averaged spectrum fit using the average DRM
Power-law model
Time interval is from   -0.968 sec. to   12.728 sec.

Spectral model in power-law:
------------------------------------------------------------
Parameters  : value       lower 90%   higher 90%
Photon index: -1.32213     ( -0.133915   0.135281 )
Norm@50keV  : 8.75920E-03    ( -0.000703876   0.000703646 )
------------------------------------------------------------
#Fit statistic : Chi-Squared =          51.14 using 59 PHA bins.
# Reduced chi-squared =         0.8971 for     57 degrees of freedom
# Null hypothesis probability =   6.936629e-01

Photon flux (15-150 keV)    in 13.7 sec: 1.04939 ( -0.086968  0.0871 ) ph/cm2/s
Energy fluence (15-150 keV)             : 1.1797e-06 ( -1.03454e-07  1.04142e-07 ) ergs/cm2
Cutoff power-law model
Time interval is from   -0.968 sec. to   12.728 sec.
Spectral model in the cutoff power-law:
------------------------------------------------------------
Parameters  : value       lower 90%   higher 90%
Photon index: -0.902159     ( -0.471789   0.558194 )
Epeak [keV] : 133.630      ( -50.197 -133.63 )
Norm@50keV  : 1.42157E-02    ( -0.00575481   0.0123024 )
------------------------------------------------------------
#Fit statistic : Chi-Squared =          49.05 using 59 PHA bins.
# Reduced chi-squared =         0.8758 for     56 degrees of freedom
# Null hypothesis probability =   7.332783e-01

Photon flux (15-150 keV)    in 13.7 sec: 1.03413 ( -0.088927  0.08896 ) ph/cm2/s
Energy fluence (15-150 keV)             : 1.14594e-06 ( -1.13079e-07  1.12208e-07 ) ergs/cm2
1-s peak spectrum fit
Power-law model
Time interval is from    1.188 sec. to    2.188 sec.

Spectral model in power-law:
------------------------------------------------------------
Parameters  : value       lower 90%   higher 90%
Photon index: -0.862251     ( -0.27386   0.295037 )
Norm@50keV  : 1.71797E-02    ( -0.00296953   0.00290462 )
------------------------------------------------------------
#Fit statistic : Chi-Squared =          70.55 using 59 PHA bins.
# Reduced chi-squared =          1.238 for     57 degrees of freedom
# Null hypothesis probability =   1.071426e-01

Photon flux (15-150 keV)    in 1 sec: 1.97181 ( -0.33299  0.33575 ) ph/cm2/s
Energy fluence (15-150 keV)             : 1.95718e-07 ( -3.2074e-08  3.2164e-08 ) ergs/cm2
Cutoff power-law model

Time interval is from    1.188 sec. to    2.188 sec.
Spectral model in the cutoff power-law:
------------------------------------------------------------
Parameters  : value       lower 90%   higher 90%
Photon index: -0.179694     ( -0.893473   1.71158 )
Epeak [keV] : 167.122      ( -167.113 -167.113 )
Norm@50keV  : 3.23462E-02    ( -0.017373   0.0995125 )
------------------------------------------------------------
#Fit statistic : Chi-Squared =          69.65 using 59 PHA bins.
# Reduced chi-squared =          1.244 for     56 degrees of freedom
# Null hypothesis probability =   1.038778e-01

Photon flux (15-150 keV)    in 1 sec: 1.91605 ( -0.3531  0.35107 ) ph/cm2/s
Energy fluence (15-150 keV)             : 1.92101e-07 ( -3.37321e-08  3.32139e-08 ) ergs/cm2
Time-resolved spectra
Distribution
T90 vs. Hardness ratio plot
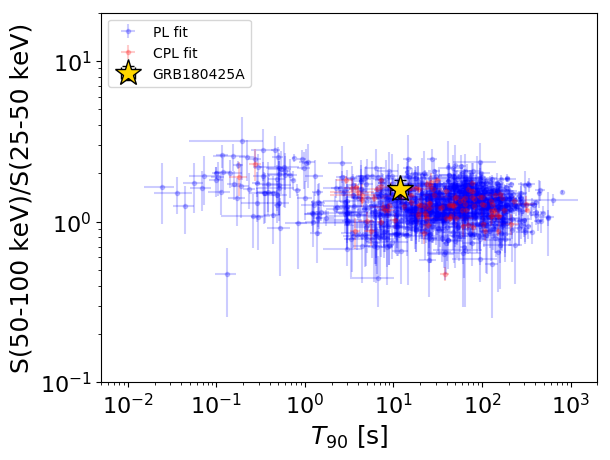
T90                                   = 11.904 sec.
Hardness ratio (energy fluence ratio) = 1.59981620531
S(15-50 keV) vs. S(50-150 keV) plot
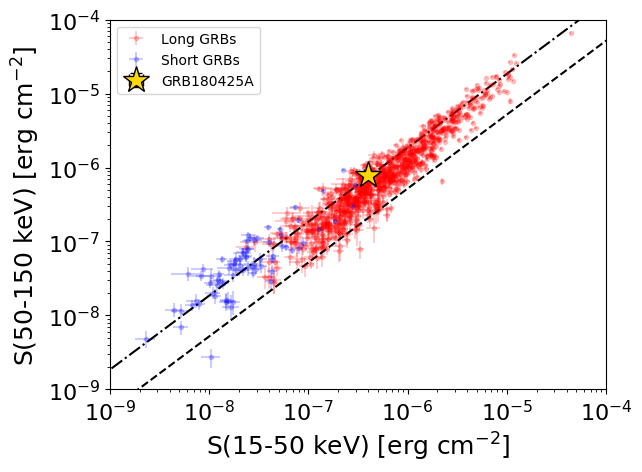
S(15-50 keV)  = 3.955731e-07
S(50-150 keV) = 7.841268e-07
The dash-dotted line and the dashed line traces the fluences calculated from the Band function with Epeak = 15 and 150 keV, respectively. Both lines assume a canonical values of alpha = -1 and beta = -2.5.
Mask shadow pattern
IMX = 3.451610372057506E-01, IMY = 6.562538626281503E-01
Spacecraft aspect plot
Bright source in the pre-burst/pre-slew/post-slew images
Pre-burst image of 15-350 keV band
Time interval of the image:
-239.624000 -0.968000

# RAcent  DECcent POSerr Theta    Phi  PeakCts   SNR AngSep     Name
#  [deg]    [deg]    ['] [deg]  [deg]                   [']
135.5664 -40.5479    2.7  41.0   34.6   1.8459   4.2    1.8	Vela X-1
170.2017 -60.6574   22.9  36.3   81.6   0.2996   0.5    3.9	Cen X-3
187.0299 -62.6959    0.0  39.3   94.2  -0.5162  -0.6   11.2	GX 301-2
204.8038 -65.4031    3.1  40.8  106.7   3.4277   3.7 ------	UNKNOWN
139.3068 -59.5199    2.6  26.8   58.3   1.3560   4.5 ------	UNKNOWN
298.1502 -52.9127    1.8  55.0  165.6   8.2332   6.2 ------	UNKNOWN
326.0610 -53.6358    2.6  48.1 -175.0   2.2873   4.5 ------	UNKNOWN
 95.8609 -10.6963    2.8  59.1  -22.3   6.3210   4.1 ------	UNKNOWN
 53.2143 -31.2398    2.8  40.1  -76.8   3.6145   4.1 ------	UNKNOWN
  9.3028 -37.3346    3.1  48.0 -129.1   4.2574   3.7 ------	UNKNOWN
Pre-slew background subtracted image of 15-350 keV band
Time interval of the image:
-0.968000 12.076600

# RAcent  DECcent POSerr Theta    Phi  PeakCts   SNR AngSep     Name
#  [deg]    [deg]    ['] [deg]  [deg]                   [']
135.7192 -40.6092    7.8  41.0   34.8   0.1209   1.5    9.3	Vela X-1
170.4131 -60.4604   15.7  36.5   81.6   0.0726   0.7   10.2	Cen X-3
186.9747 -62.7018 1652.1  39.3   94.1  -0.0010  -0.0    9.7	GX 301-2
119.0702 -23.1550    3.4  51.7    7.4   0.3868   3.4 ------	UNKNOWN
353.4339 -69.9960    2.6  27.6 -175.2   0.1880   4.4 ------	UNKNOWN
329.9481 -53.8928    2.2  46.8 -172.4   0.4521   5.2 ------	UNKNOWN
 40.2812 -43.8985    2.3  31.5 -100.7   0.3905   5.1 ------	UNKNOWN
 64.4499 -32.9497    0.6  36.6  -62.3   1.6585  18.2 ------	UNKNOWN
Post-slew image of 15-350 keV band
Time interval of the image:
67.476600 962.402600

# RAcent  DECcent POSerr Theta    Phi  PeakCts   SNR AngSep     Name
#  [deg]    [deg]    ['] [deg]  [deg]                   [']
109.8666 -62.1725    4.3  40.9   98.3   6.4023   2.7 ------	UNKNOWN
102.2820   4.8466    2.5  52.1   -0.5   5.4972   4.7 ------	UNKNOWN
 21.2631 -47.1628    3.5  35.4 -177.8   2.4810   3.3 ------	UNKNOWN
 61.2442  -8.5390    2.6  24.6  -59.0   2.9525   4.4 ------	UNKNOWN
358.8702 -30.8575    3.1  54.8 -158.1   8.5871   3.7 ------	UNKNOWN
 48.1339   3.9865    4.4  40.1  -77.1   5.9707   2.6 ------	UNKNOWN
 16.1393 -13.4863    3.3  48.0 -129.1  10.0319   3.5 ------	UNKNOWN