Analysis Summary
Notes:
- 1) No attempt has been made to eliminate the non-significant decimal places.
- 2) This batgrbproduct analysis is done using the HEASARC data.
- 3) This batgrbproduct analysis is using the flight position for the mask-weighting calculation.
======================================================================
BAT GRB EVENT DATA PROCESSING REPORT
Process Script Ver: batgrbproduct v2.46
Process Start Time: Thu May 31 13:25:50 EDT 2018
Host Name: bat1
Current Working Dir: /local/data/bat1/alien/Swift_3rdBATcatalog/event/batevent_reproc/trigger831810
======================================================================
Trigger: 00831810 Segment: 000
BAT Trigger Time: 547673095.232 [s; MET]
Trigger Stop: 547673096.256 [s; MET]
UTC: 2018-05-10T19:24:34.309920 [includes UTCF correction]
Where From?: TDRSS position message
BAT
RA: 276.318496902141 Dec: -31.9109448076993 [deg; J2000]
Catalogged Source?: NO
Point Source?: YES
GRB Indicated?: YES [ by BAT flight software ]
Image S/N Ratio: 11.84
Image Trigger?: NO
Rate S/N Ratio: 22.9128784747792 [ if not an image trigger ]
Image S/N Ratio: 11.84
Analysis Position: [ source = BAT ]
RA: 276.318496902141 Dec: -31.9109448076993 [deg; J2000]
Refined Position: [ source = BAT pre-slew burst ]
RA: 276.338636377679 Dec: -31.917968500946 [deg; J2000]
{ 18h 25m 21.3s , -31d 55' 04.7" }
+/- 0.859859238158921 [arcmin] (estimated 90% radius based on SNR)
+/- 0.302521840957937 [arcmin] (formal 1-sigma fit error)
SNR: 37.739277165375
Angular difference between the analysis and refined position is 1.108908 arcmin
Partial Coding Fraction: 0.3789062 [ including projection effects ]
Duration
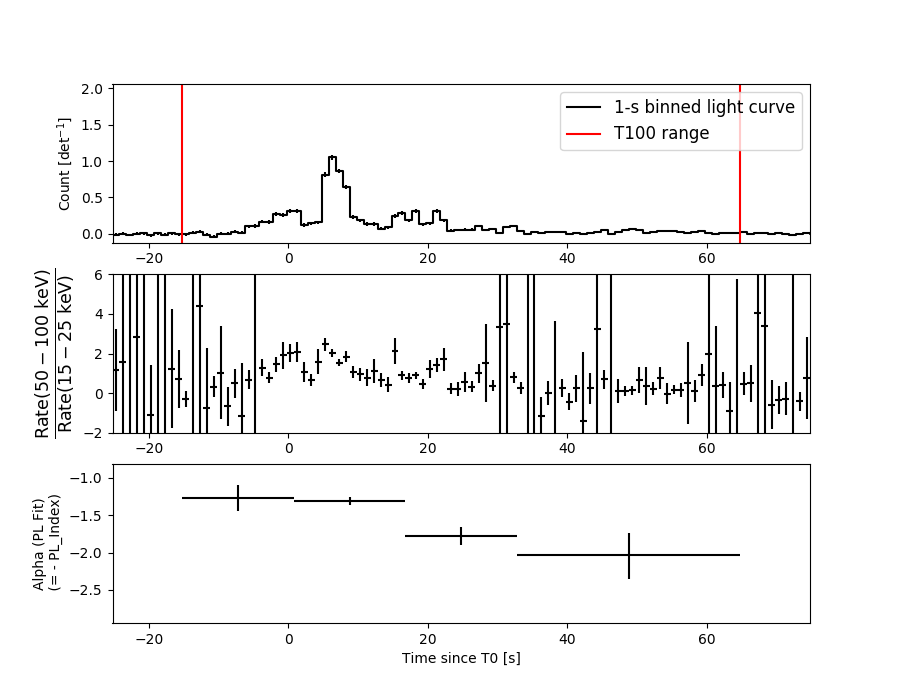
T90: 64 +/- 16
Measured from: -15.2319999933243
to: 48.7680000066757 [s; relative to TRIGTIME]
T50: 16 +/- 16
Measured from: 0.76800000667572
to: 16.7680000066757 [s; relative to TRIGTIME]
Fluence
Peak Flux (peak 1 second)
Measured from: 8.26800000667572
to: 9.26800000667572 [s; relative to TRIGTIME]
Total Fluence
Measured from: -15.2319999933243
to: 64.7680000066757 [s; relative to TRIGTIME]
Band 1 Band 2 Band 3 Band 4
15-25 25-50 50-100 100-350 keV
Total 2.307364 3.447369 2.979017 0.746756
0.097345 0.098385 0.084255 0.062077 [error]
Peak 0.086244 0.154273 0.124640 0.054110
0.014326 0.015080 0.013579 0.009418 [error]
[ fluence units of on-axis counts / fully illuminated detector ]
======================================================================
====== Table of the duration information =============================
Value tstart tstop
T100 80.000 -15.232 64.768
T90 64.000 -15.232 48.768
T50 16.000 0.768 16.768
Peak 1.000 8.268 9.268
====== Spectral Analysis Summary =====================================
Model : spectral model: simple power-law (PL) and cutoff power-law (CPL)
Ph_index : photon index: E^{Ph_index}
Ph_90err : 90% error of the photon index
Epeak : Epeak in keV
Epeak_90err: 90% error of Epeak
Norm : normalization at 50 keV in both the PL model and CPL model
Nomr_90err : 90% error of the normalization
chi2 : Chi-Squared
dof : degree of freedo
=== Time-averaged spectral analysis ===
(Best model with acceptable fit: CPL)
Model Ph_index Ph_90err_low Ph_90err_hi Epeak Epeak_90err_low Epeak_90err_hi Norm Nomr_90err_low Norm_90err_hi chi2 dof
PL -1.458 -0.058 0.058 - - - 8.28e-03 -2.64e-04 2.64e-04 65.360 57
CPL -1.035 -0.234 0.247 127.708 -27.413 84.388 1.29e-02 -2.71e-03 3.64e-03 55.440 56
=== 1-s peak spectral analysis ===
(Best model with acceptable fit: PL)
Model Ph_index Ph_90err_low Ph_90err_hi Epeak Epeak_90err_low Epeak_90err_hi Norm Nomr_90err_low Norm_90err_hi chi2 dof
PL -1.216 -0.183 0.186 - - - 2.88e-02 -3.01e-03 3.00e-03 51.230 57
CPL -1.175 -0.224 0.497 999.907 -999.907 -999.907 3.03e-02 N/A N/A 51.370 56
=== Fluence/Peak Flux Summary ===
Model Band1 Band2 Band3 Band4 Band5 Total
15-25 25-50 50-100 100-350 15-150 15-350 keV
Fluence PL 8.13e-07 1.53e-06 2.23e-06 6.92e-06 6.33e-06 1.15e-05 erg/cm2
90%_error_low -5.07e-08 -5.72e-08 -8.50e-08 -5.76e-07 -2.11e-07 -6.26e-07 erg/cm2
90%_error_hi 5.19e-08 5.70e-08 8.48e-08 6.10e-07 2.12e-07 6.53e-07 erg/cm2
Peak flux PL 9.03e-01 1.08e+00 9.27e-01 1.36e+00 3.39e+00 4.27e+00 ph/cm2/s
90%_error_low -1.85e-01 -1.40e-01 -1.07e-01 -3.12e-01 -3.74e-01 -4.52e-01 ph/cm2/s
90%_error_hi 1.99e-01 1.38e-01 1.06e-01 3.64e-01 3.75e-01 4.55e-01 ph/cm2/s
Fluence CPL 7.32e-07 1.57e-06 2.32e-06 4.16e-06 6.19e-06 8.79e-06 erg/cm2
90%_error_low -6.48e-08 -6.24e-08 -9.93e-08 -9.48e-07 -2.27e-07 -9.63e-07 erg/cm2
90%_error_hi 6.63e-08 6.28e-08 1.00e-07 1.30e-06 2.26e-07 1.30e-06 erg/cm2
Peak flux CPL 9.02e-01 1.07e+00 9.25e-01 1.43e+00 3.40e+00 4.34e+00 ph/cm2/s
90%_error_low N/A -1.51e-01 N/A N/A N/A -8.07e-01 ph/cm2/s
90%_error_hi N/A 1.55e-01 N/A N/A N/A 3.82e-01 ph/cm2/s
======================================================================
Image
Pre-slew 15.0-350.0 keV image (Event data)
#   RAcent    DECcent   POSerr    Theta     Phi              Peak Cts       SNR   Name
  276.3386   -31.9180   0.0051    34.4327    45.0793         6.0965620     37.739 TRIG_00831810

Foreground time interval of the image:
-15.232  11.069 (delta_t =  26.301 [sec])
Background time interval of the image:
-239.232 -15.232 (delta_t = 224.000 [sec])
Light Curves
Note: The mask-weighted lightcurves have units of either count/det or counts/sec/det, where a det is 0.4 x 0.4 = 0.16 sq cm.
Full-time range; 1 s binning
Other quick-look light curves:
- 64 ms binning (zoomed)
- 16 ms binning (zoomed)
- 8 ms binning (zoomed)
- 2 ms binning (zoomed)
- SN=5 or 10 s binning (full-time range)
- Raw light curve
Spectra
- 64 ms binning (zoomed)
- 16 ms binning (zoomed)
- 8 ms binning (zoomed)
- 2 ms binning (zoomed)
- SN=5 or 10 s binning (full-time range)
- Raw light curve
Spectra
Notes:
- 1) The fitting includes the systematic errors.
- 2) When the burst includes telescope slew time periods, the fitting uses an average response file made from multiple 5-s response files through out the slew time plus single time preiod for the non-slew times, and weighted by the total counts in the corresponding time period using addrmf. An average response file is needed becuase a spectral fit using the pre-slew DRM will introduce some errors in both a spectral shape and a normalization if the PHA file contains a lot of the slew/post-slew time interval.
- 3) For fits to more complicated models (e.g. a power-law over a cutoff power-law), the BAT team has decided to require a chi-square improvement of more than 6 for each extra dof.
Time averaged spectrum fit using the average DRM
Power-law model
Time interval is from  -15.232 sec. to   64.768 sec.

Spectral model in power-law:
------------------------------------------------------------
Parameters  : value       lower 90%   higher 90%
Photon index: -1.45827     ( -0.0575513   0.0575992 )
Norm@50keV  : 8.27748E-03    ( -0.000264413   0.00026441 )
------------------------------------------------------------
#Fit statistic : Chi-Squared =          65.36 using 59 PHA bins.
# Reduced chi-squared =          1.147 for     57 degrees of freedom
# Null hypothesis probability =   2.091905e-01

Photon flux (15-150 keV)    in 80 sec: 1.02222 ( -0.036004  0.03611 ) ph/cm2/s
Energy fluence (15-150 keV)             : 6.32805e-06 ( -2.1145e-07  2.11685e-07 ) ergs/cm2
Cutoff power-law model
Time interval is from  -15.232 sec. to   64.768 sec.
Spectral model in the cutoff power-law:
------------------------------------------------------------
Parameters  : value       lower 90%   higher 90%
Photon index: -1.03482     ( -0.234054   0.246729 )
Epeak [keV] : 127.708      ( -27.4131 84.3873 )
Norm@50keV  : 1.28618E-02    ( -0.002713   0.00364041 )
------------------------------------------------------------
#Fit statistic : Chi-Squared =          55.44 using 59 PHA bins.
# Reduced chi-squared =         0.9899 for     56 degrees of freedom
# Null hypothesis probability =   4.961602e-01

Photon flux (15-150 keV)    in 80 sec: 0.994243 ( -0.03874  0.038947 ) ph/cm2/s
Energy fluence (15-150 keV)             : 6.18842e-06 ( -2.26589e-07  2.26034e-07 ) ergs/cm2
1-s peak spectrum fit
Power-law model
Time interval is from    8.268 sec. to    9.268 sec.

Spectral model in power-law:
------------------------------------------------------------
Parameters  : value       lower 90%   higher 90%
Photon index: -1.21583     ( -0.183058   0.185889 )
Norm@50keV  : 2.87879E-02    ( -0.00300973   0.00299931 )
------------------------------------------------------------
#Fit statistic : Chi-Squared =          51.23 using 59 PHA bins.
# Reduced chi-squared =         0.8987 for     57 degrees of freedom
# Null hypothesis probability =   6.904280e-01

Photon flux (15-150 keV)    in 1 sec: 3.38686 ( -0.37412  0.37529 ) ph/cm2/s
Energy fluence (15-150 keV)             : 2.9081e-07 ( -3.21257e-08  3.21956e-08 ) ergs/cm2
Cutoff power-law model

Time interval is from    8.268 sec. to    9.268 sec.
Spectral model in the cutoff power-law:
------------------------------------------------------------
Parameters  : value       lower 90%   higher 90%
Photon index: -1.21137     ( -0.22433   0.496946 )
Epeak [keV] : 1.00000E+04      ( -10000 -10000 )
Norm@50keV  : 2.89240E-02    (     )
------------------------------------------------------------
#Fit statistic : Chi-Squared =          51.24 using 59 PHA bins.
# Reduced chi-squared =         0.9150 for     56 degrees of freedom
# Null hypothesis probability =   6.553400e-01

Photon flux (15-150 keV)    in 1 sec: 3.39810 (    ) ph/cm2/s
Energy fluence (15-150 keV)             : 2.90743e-07 ( 0  0 ) ergs/cm2
Time-resolved spectra
Distribution
T90 vs. Hardness ratio plot
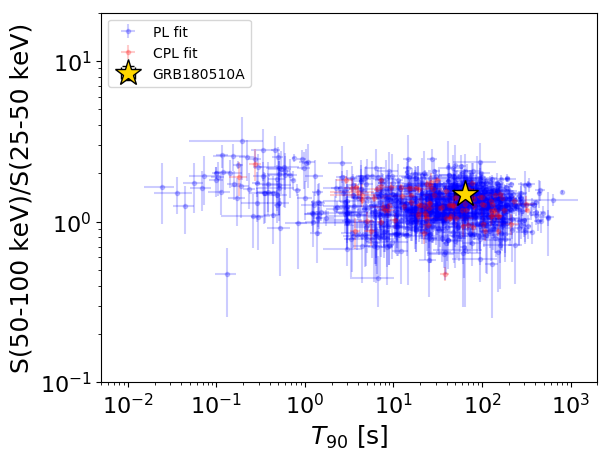
T90                                   = 64.0 sec.
Hardness ratio (energy fluence ratio) = 1.47764440895
S(15-50 keV) vs. S(50-150 keV) plot
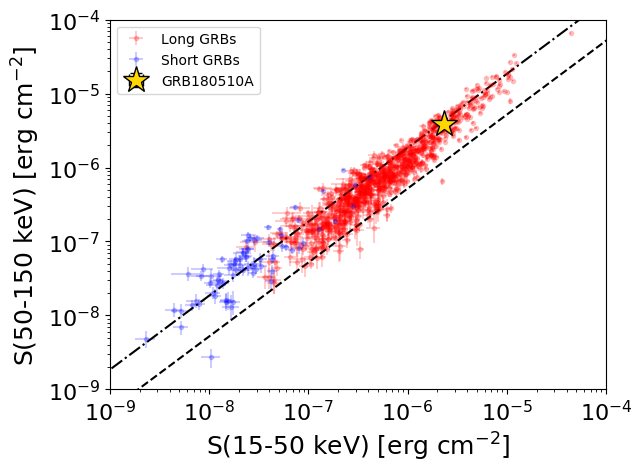
S(15-50 keV)  = 2.3038148e-06
S(50-150 keV) = 3.884574e-06
The dash-dotted line and the dashed line traces the fluences calculated from the Band function with Epeak = 15 and 150 keV, respectively. Both lines assume a canonical values of alpha = -1 and beta = -2.5.
Mask shadow pattern
IMX = 4.840881543379221E-01, IMY = -4.854305873561023E-01
Spacecraft aspect plot
Bright source in the pre-burst/pre-slew/post-slew images
Pre-burst image of 15-350 keV band
Time interval of the image:
-239.232000 -15.232000

# RAcent  DECcent POSerr Theta    Phi  PeakCts   SNR AngSep     Name
#  [deg]    [deg]    ['] [deg]  [deg]                   [']
254.2724  35.3568   15.0  44.6  174.3  -0.4836  -0.8    9.1	Her X-1
263.0691 -24.7370    3.5  34.0   69.6  -1.8356  -3.3    3.3	GX 1+4
268.2090  -1.4760   11.2  17.5  111.9  -0.3750  -1.0    9.6	SW J1753.5-0127
270.2309 -24.9527   11.7  30.2   59.6   0.4431   1.0    8.1	GX 5-1
270.4290 -25.8400    4.3  30.9   58.4   1.2086   2.7    9.0	GRS 1758-258
274.0398 -14.0424    2.2  19.2   67.2   1.7357   5.2    2.0	GX 17+2
276.1233 -30.3727   11.6  33.0   46.2   0.4832   1.0   10.3	H1820-303
285.0851 -24.9337    8.5  26.3   32.1   0.4727   1.4    2.8	HT1900.1-2455
288.7969  10.9290    1.1  10.1 -129.7   2.8343  10.3    1.0	GRS 1915+105
299.6188  35.2485    3.8  36.3 -129.0   1.5159   3.0    3.1	Cyg X-1
308.0875  40.8999    5.8  44.5 -124.2   2.7613   2.0    3.3	Cyg X-3
262.9420 -33.9756   10.5  41.2   60.1  -1.1630  -1.1    8.8	GX 354-0
239.1378  36.0054    2.2  55.1  165.7   9.4739   5.1 ------	UNKNOWN
275.0850   7.1789    0.2  11.9  150.7  22.5689  76.9 ------	UNKNOWN
310.5032  -3.9349    2.8  25.6  -46.6   1.4012   4.1 ------	UNKNOWN
272.6419  56.9080    2.7  56.4 -157.1   8.1327   4.2 ------	UNKNOWN
306.5206  45.7213    2.4  48.0 -129.0   7.3656   4.9 ------	UNKNOWN
Pre-slew background subtracted image of 15-350 keV band
Time interval of the image:
-15.232000 11.068590

# RAcent  DECcent POSerr Theta    Phi  PeakCts   SNR AngSep     Name
#  [deg]    [deg]    ['] [deg]  [deg]                   [']
254.4680  35.2667    7.0  44.5  174.4   0.2788   1.6    4.6	Her X-1
262.9289 -24.9144    0.0  34.2   69.5  -0.2343  -1.2   11.0	GX 1+4
268.3486  -1.4579    9.7  17.4  111.9   0.1235   1.2    1.2	SW J1753.5-0127
270.0583 -25.0233    0.0  30.4   59.8   0.2405   1.7   12.7	GX 5-1
270.1462 -25.6582    4.6  30.9   59.0   0.3545   2.5    9.9	GRS 1758-258
273.7952 -13.9858    0.0  19.3   67.8  -0.0475  -0.4   12.6	GX 17+2
275.8630 -30.5368    4.2  33.2   46.5   0.4374   2.7   10.7	H1820-303
285.1028 -24.7620   11.5  26.2   32.1  -0.1021  -1.0   10.2	HT1900.1-2455
288.8810  11.0989   15.3  10.3 -129.6  -0.0582  -0.8   10.4	GRS 1915+105
299.5936  35.1988   24.6  36.3 -129.0   0.0624   0.5    0.2	Cyg X-1
308.3035  40.8610   10.1  44.5 -124.0   0.3672   1.1   10.3	Cyg X-3
263.2298 -33.8916    7.2  41.0   59.9  -0.5293  -1.6   12.5	GX 354-0
276.3386 -31.9180    0.3  34.4   45.1   6.0967  37.6 ------	UNKNOWN
319.8216 -28.1196    2.3  44.2  -14.2   0.6879   5.0 ------	UNKNOWN
320.7015 -23.8997    2.1  42.6  -20.0   0.7171   5.4 ------	UNKNOWN
Post-slew image of 15-350 keV band
Time interval of the image:
76.868590 323.268600

# RAcent  DECcent POSerr Theta    Phi  PeakCts   SNR AngSep     Name
#  [deg]    [deg]    ['] [deg]  [deg]                   [']
244.9769 -15.6454    0.5  32.8  106.7  15.7815  23.0    0.3	Sco X-1
255.9501 -37.8602    1.0  17.7   59.0   3.5919  11.0    2.0	4U 1700-377
256.4351 -36.4299    5.2  17.0   63.5   0.7315   2.3    0.4	GX 349+2
263.0398 -24.7067   24.5  13.7  112.7   0.1783   0.5    2.9	GX 1+4
264.5383 -44.4364    7.0  15.5   27.2   0.5599   1.6    8.8	4U 1735-44
268.3188  -1.3545   12.8  31.5  158.9  -0.4401  -0.9    6.6	SW J1753.5-0127
270.3196 -25.0793    2.3   8.6  135.3   1.8923   5.1    1.9	GX 5-1
270.3090 -25.8378    7.0   8.0  132.0   0.5982   1.6    5.7	GRS 1758-258
273.8555 -14.0493    4.0  18.0  166.6   0.9932   2.9    8.8	GX 17+2
275.8075 -30.2057   10.8   1.8  160.3   0.3693   1.1   11.4	H1820-303
285.1972 -25.0744    0.0  10.4 -134.7   0.6199   1.7   12.7	HT1900.1-2455
288.7523  10.9541    2.5  44.5 -168.1   2.8592   4.7    2.8	GRS 1915+105
263.1629 -33.7173    5.3  11.2   71.5   0.7487   2.2   11.2	GX 354-0
275.0765   7.1881    0.3  39.1  172.4  23.8448  44.1 ------	UNKNOWN
183.2047 -86.8680    2.4  58.3   -2.0   9.0636   4.9 ------	UNKNOWN
287.7530  14.2432    2.5  47.4 -170.6   3.1365   4.6 ------	UNKNOWN
304.3883   2.7900    3.2  43.8 -142.9   2.5230   3.7 ------	UNKNOWN
336.8617 -61.4778    3.9  48.4  -39.5   3.8989   3.0 ------	UNKNOWN
314.6948  -0.3046    4.3  48.1 -129.1   5.7508   2.7 ------	UNKNOWN