Analysis Summary
Notes:
- 1) No attempt has been made to eliminate the non-significant decimal places.
- 2) This batgrbproduct analysis is done using the HEASARC data.
- 3) This batgrbproduct analysis is using the flight position for the mask-weighting calculation.
======================================================================
BAT GRB EVENT DATA PROCESSING REPORT
Process Script Ver: batgrbproduct v2.46
Process Start Time: Thu May 31 13:15:07 EDT 2018
Host Name: bat1
Current Working Dir: /local/data/bat1/alien/Swift_3rdBATcatalog/event/batevent_reproc/trigger832368
======================================================================
Trigger: 00832368 Segment: 000
BAT Trigger Time: 547997154.432 [s; MET]
Trigger Stop: 547997156.48 [s; MET]
UTC: 2018-05-14T13:25:33.490260 [includes UTCF correction]
Where From?: TDRSS position message
BAT
RA: 197.400829211167 Dec: 36.9695482478951 [deg; J2000]
Catalogged Source?: NO
Point Source?: YES
GRB Indicated?: YES [ by BAT flight software ]
Image S/N Ratio: 7.83
Image Trigger?: NO
Rate S/N Ratio: 10.3923048454133 [ if not an image trigger ]
Image S/N Ratio: 7.83
Analysis Position: [ source = BAT ]
RA: 197.400829211167 Dec: 36.9695482478951 [deg; J2000]
Refined Position: [ source = BAT pre-slew burst ]
RA: 197.384564570651 Dec: 36.9706469279382 [deg; J2000]
{ 13h 09m 32.3s , +36d 58' 14.3" }
+/- 1.29094113469072 [arcmin] (estimated 90% radius based on SNR)
+/- 0.448750463360856 [arcmin] (formal 1-sigma fit error)
SNR: 21.1193530046473
Angular difference between the analysis and refined position is 0.782459 arcmin
Partial Coding Fraction: 0.9140625 [ including projection effects ]
Duration
T90: 31.1599999666214 +/- 4.10507831355118
Measured from: -6.5440000295639
to: 24.6159999370575 [s; relative to TRIGTIME]
T50: 15.6480000019073 +/- 2.21677241539886
Measured from: 0.867999911308289
to: 16.5159999132156 [s; relative to TRIGTIME]
Fluence
Peak Flux (peak 1 second)
Measured from: 0.291999936103821
to: 1.29199993610382 [s; relative to TRIGTIME]
Total Fluence
Measured from: -8.36000001430511
to: 28.5999999046326 [s; relative to TRIGTIME]
Band 1 Band 2 Band 3 Band 4
15-25 25-50 50-100 100-350 keV
Total 0.557049 0.623724 0.372586 0.045441
0.037852 0.039297 0.033726 0.028243 [error]
Peak 0.035659 0.028810 0.025377 0.007223
0.006463 0.006628 0.005829 0.004872 [error]
[ fluence units of on-axis counts / fully illuminated detector ]
======================================================================
====== Table of the duration information =============================
Value tstart tstop
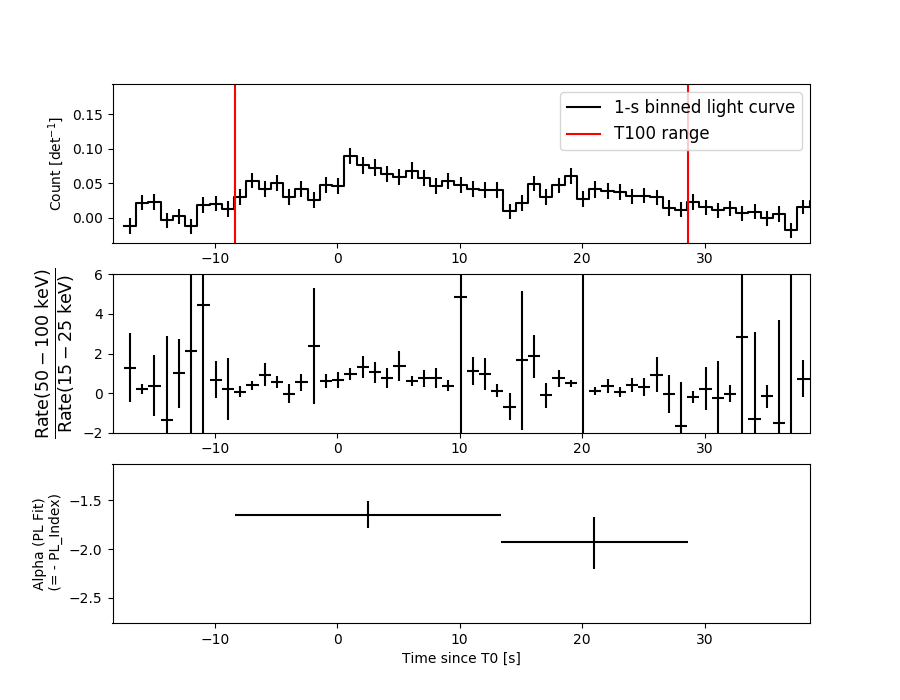
T100 36.960 -8.360 28.600
T90 31.160 -6.544 24.616
T50 15.648 0.868 16.516
Peak 1.000 0.292 1.292
====== Spectral Analysis Summary =====================================
Model : spectral model: simple power-law (PL) and cutoff power-law (CPL)
Ph_index : photon index: E^{Ph_index}
Ph_90err : 90% error of the photon index
Epeak : Epeak in keV
Epeak_90err: 90% error of Epeak
Norm : normalization at 50 keV in both the PL model and CPL model
Nomr_90err : 90% error of the normalization
chi2 : Chi-Squared
dof : degree of freedo
=== Time-averaged spectral analysis ===
(Best model with acceptable fit: PL)
Model Ph_index Ph_90err_low Ph_90err_hi Epeak Epeak_90err_low Epeak_90err_hi Norm Nomr_90err_low Norm_90err_hi chi2 dof
PL -1.746 -0.131 0.128 - - - 2.64e-03 -2.13e-04 2.11e-04 57.470 57
CPL -1.268 -0.516 0.597 68.379 -17.858 -68.379 4.84e-03 -2.26e-03 5.38e-03 55.020 56
=== 1-s peak spectral analysis ===
(Best model with acceptable fit: PL)
Model Ph_index Ph_90err_low Ph_90err_hi Epeak Epeak_90err_low Epeak_90err_hi Norm Nomr_90err_low Norm_90err_hi chi2 dof
PL -1.754 -0.393 0.363 - - - 5.43e-03 -1.35e-03 1.29e-03 49.440 57
CPL -1.741 -1.050 1.428 801.898 -801.888 -801.898 5.52e-03 -1.45e-03 3.20e-02 49.440 56
=== Fluence/Peak Flux Summary ===
Model Band1 Band2 Band3 Band4 Band5 Total
15-25 25-50 50-100 100-350 15-150 15-350 keV
Fluence PL 1.57e-07 2.49e-07 2.96e-07 6.88e-07 9.01e-07 1.39e-06 erg/cm2
90%_error_low -1.72e-08 -1.77e-08 -3.23e-08 -1.43e-07 -7.51e-08 -1.76e-07 erg/cm2
90%_error_hi 1.76e-08 1.77e-08 3.25e-08 1.66e-07 7.61e-08 1.94e-07 erg/cm2
Peak flux PL 2.85e-01 2.47e-01 1.46e-01 1.30e-01 7.35e-01 8.09e-01 ph/cm2/s
90%_error_low -8.32e-02 -5.00e-02 -4.67e-02 -6.62e-02 -1.49e-01 -1.70e-01 ph/cm2/s
90%_error_hi 8.72e-02 5.00e-02 4.73e-02 9.80e-02 1.49e-01 1.72e-01 ph/cm2/s
Fluence CPL 1.49e-07 2.63e-07 2.96e-07 3.11e-07 8.57e-07 1.02e-06 erg/cm2
90%_error_low -1.98e-08 -2.33e-08 -3.55e-08 -1.70e-07 -8.77e-08 -1.93e-07 erg/cm2
90%_error_hi 1.98e-08 2.40e-08 3.49e-08 4.18e-07 8.92e-08 4.28e-07 erg/cm2
Peak flux CPL 2.85e-01 2.47e-01 1.46e-01 1.28e-01 7.34e-01 8.06e-01 ph/cm2/s
90%_error_low N/A -5.03e-02 -4.59e-02 -1.28e-01 -1.51e-01 -2.04e-01 ph/cm2/s
90%_error_hi N/A 6.55e-02 4.85e-02 5.70e-02 1.49e-01 1.68e-01 ph/cm2/s
======================================================================
Image
Pre-slew 15.0-350.0 keV image (Event data)
#   RAcent    DECcent   POSerr    Theta     Phi              Peak Cts       SNR   Name
  197.3846    36.9706   0.0091    15.6440    47.0382         1.5743042     21.119 TRIG_00832368

Foreground time interval of the image:
 -8.360  28.600 (delta_t =  36.960 [sec])
Background time interval of the image:
-657.231 -643.404 (delta_t =  13.828 [sec])
-239.432  -8.360 (delta_t = 231.072 [sec])
Light Curves
Note: The mask-weighted lightcurves have units of either count/det or counts/sec/det, where a det is 0.4 x 0.4 = 0.16 sq cm.
Full-time range; 1 s binning
Other quick-look light curves:
- 64 ms binning (zoomed)
- 16 ms binning (zoomed)
- 8 ms binning (zoomed)
- 2 ms binning (zoomed)
- SN=5 or 10 s binning (full-time range)
- Raw light curve
Spectra
- 64 ms binning (zoomed)
- 16 ms binning (zoomed)
- 8 ms binning (zoomed)
- 2 ms binning (zoomed)
- SN=5 or 10 s binning (full-time range)
- Raw light curve
Spectra
Notes:
- 1) The fitting includes the systematic errors.
- 2) When the burst includes telescope slew time periods, the fitting uses an average response file made from multiple 5-s response files through out the slew time plus single time preiod for the non-slew times, and weighted by the total counts in the corresponding time period using addrmf. An average response file is needed becuase a spectral fit using the pre-slew DRM will introduce some errors in both a spectral shape and a normalization if the PHA file contains a lot of the slew/post-slew time interval.
- 3) For fits to more complicated models (e.g. a power-law over a cutoff power-law), the BAT team has decided to require a chi-square improvement of more than 6 for each extra dof.
Time averaged spectrum fit using the average DRM
Power-law model
Time interval is from   -8.360 sec. to   28.600 sec.

Spectral model in power-law:
------------------------------------------------------------
Parameters  : value       lower 90%   higher 90%
Photon index: -1.74574     ( -0.131162   0.128477 )
Norm@50keV  : 2.64188E-03    ( -0.000213084   0.000210625 )
------------------------------------------------------------
#Fit statistic : Chi-Squared =          57.47 using 59 PHA bins.
# Reduced chi-squared =          1.008 for     57 degrees of freedom
# Null hypothesis probability =   4.574790e-01

Photon flux (15-150 keV)    in 36.96 sec: 0.356684 ( -0.025593  0.025606 ) ph/cm2/s
Energy fluence (15-150 keV)             : 9.01347e-07 ( -7.51153e-08  7.61195e-08 ) ergs/cm2
Cutoff power-law model
Time interval is from   -8.360 sec. to   28.600 sec.
Spectral model in the cutoff power-law:
------------------------------------------------------------
Parameters  : value       lower 90%   higher 90%
Photon index: -1.26751     ( -0.516255   0.596717 )
Epeak [keV] : 68.3793      ( -17.8582 -68.3793 )
Norm@50keV  : 4.84475E-03    ( -0.00226496   0.00538008 )
------------------------------------------------------------
#Fit statistic : Chi-Squared =          55.02 using 59 PHA bins.
# Reduced chi-squared =         0.9825 for     56 degrees of freedom
# Null hypothesis probability =   5.120749e-01

Photon flux (15-150 keV)    in 36.96 sec: 0.349020 ( -0.02698  0.026884 ) ph/cm2/s
Energy fluence (15-150 keV)             : 8.57298e-07 ( -8.76684e-08  8.92048e-08 ) ergs/cm2
1-s peak spectrum fit
Power-law model
Time interval is from    0.292 sec. to    1.292 sec.

Spectral model in power-law:
------------------------------------------------------------
Parameters  : value       lower 90%   higher 90%
Photon index: -1.75359     ( -0.392687   0.362931 )
Norm@50keV  : 5.42522E-03    ( -0.00135494   0.00129461 )
------------------------------------------------------------
#Fit statistic : Chi-Squared =          49.44 using 59 PHA bins.
# Reduced chi-squared =         0.8673 for     57 degrees of freedom
# Null hypothesis probability =   7.514427e-01

Photon flux (15-150 keV)    in 1 sec: 0.734589 ( -0.148766  0.148768 ) ph/cm2/s
Energy fluence (15-150 keV)             : 5.00587e-08 ( -1.24845e-08  1.29746e-08 ) ergs/cm2
Cutoff power-law model
Time interval is from    0.292 sec. to    1.292 sec.
Spectral model in the cutoff power-law:
------------------------------------------------------------
Parameters  : value       lower 90%   higher 90%
Photon index: -1.7409     ( -1.05029   1.428 )
Epeak [keV] : 801.898      ( -894.124 -894.134 )
Norm@50keV  : 5.51814E-03    ( -0.00144527   0.0320243 )
------------------------------------------------------------
#Fit statistic : Chi-Squared =          49.44 using 59 PHA bins.
# Reduced chi-squared =         0.8828 for     56 degrees of freedom
# Null hypothesis probability =   7.198564e-01

Photon flux (15-150 keV)    in 1 sec: 0.734298 ( -0.150589  0.149018 ) ph/cm2/s
Energy fluence (15-150 keV)             : 4.99839e-08 ( -1.42903e-08  1.08576e-08 ) ergs/cm2
Time-resolved spectra
Distribution
T90 vs. Hardness ratio plot
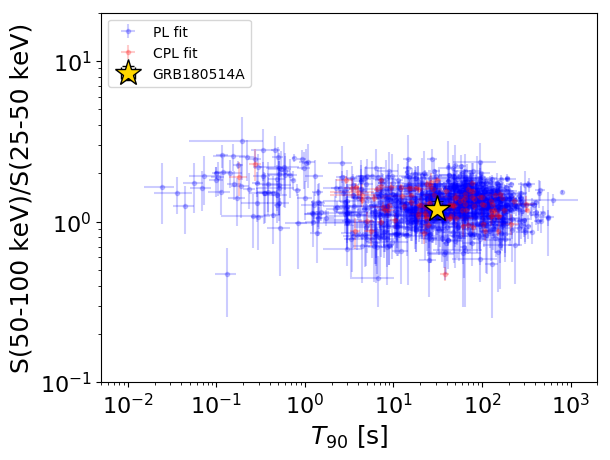
T90                                   = 31.16 sec.
Hardness ratio (energy fluence ratio) = 1.19275153518
S(15-50 keV) vs. S(50-150 keV) plot
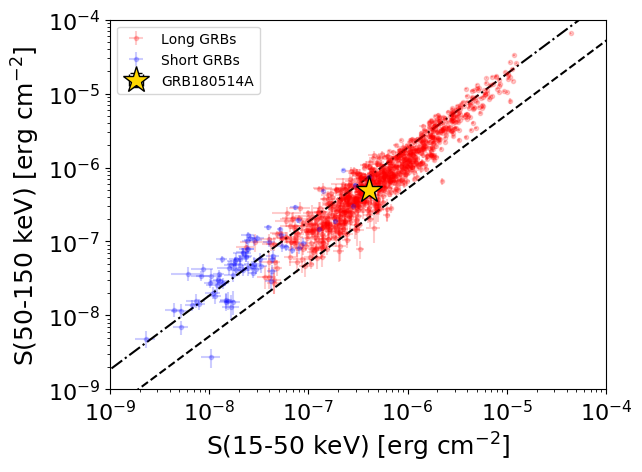
S(15-50 keV)  = 4.056532e-07
S(50-150 keV) = 4.957065e-07
The dash-dotted line and the dashed line traces the fluences calculated from the Band function with Epeak = 15 and 150 keV, respectively. Both lines assume a canonical values of alpha = -1 and beta = -2.5.
Mask shadow pattern
IMX = 1.908452745266090E-01, IMY = -2.049304000518498E-01
Spacecraft aspect plot
Bright source in the pre-burst/pre-slew/post-slew images
Pre-burst image of 15-350 keV band
Time interval of the image:
-657.231410 -643.403600
-239.432000 -8.360000

# RAcent  DECcent POSerr Theta    Phi  PeakCts   SNR AngSep     Name
#  [deg]    [deg]    ['] [deg]  [deg]                   [']
201.5431   4.2131    3.3  40.9   98.2   3.5463   3.6 ------	UNKNOWN
174.7324  21.2045    2.0  17.8  145.2   1.1532   5.7 ------	UNKNOWN
120.7975  27.9075    2.2  47.9 -129.0   5.3238   5.3 ------	UNKNOWN
Pre-slew background subtracted image of 15-350 keV band
Time interval of the image:
-8.360000 28.600000

# RAcent  DECcent POSerr Theta    Phi  PeakCts   SNR AngSep     Name
#  [deg]    [deg]    ['] [deg]  [deg]                   [']
197.3846  36.9706    0.5  15.6   47.0   1.5744  21.1 ------	UNKNOWN
262.2776  68.8225    2.2  52.3  -16.7   0.9669   5.2 ------	UNKNOWN
Post-slew image of 15-350 keV band
Time interval of the image:
66.868590 962.718600

# RAcent  DECcent POSerr Theta    Phi  PeakCts   SNR AngSep     Name
#  [deg]    [deg]    ['] [deg]  [deg]                   [']
254.3553  35.4343   21.2  45.3   20.1   0.6038   0.5    7.4	Her X-1
215.2220  -0.3716    3.3  40.8   98.2   8.1671   3.5 ------	UNKNOWN
189.5543  -3.0865    2.3  40.7  138.2   7.0190   5.0 ------	UNKNOWN
232.1036  39.6414    3.2  27.2   19.8   2.0851   3.6 ------	UNKNOWN
276.4572  47.6576    3.8  56.9   -1.7   7.9561   3.0 ------	UNKNOWN
143.6725  10.7124    2.9  54.8 -158.1   9.5664   4.0 ------	UNKNOWN
157.4111  50.8047    3.6  31.5 -105.0   3.2032   3.2 ------	UNKNOWN
152.7710  69.0212    4.8  40.1  -76.9   5.8557   2.4 ------	UNKNOWN
137.6944  33.6866    3.6  48.0 -129.0   9.0523   3.2 ------	UNKNOWN