Analysis Summary
Notes:
- 1) No attempt has been made to eliminate the non-significant decimal places.
- 2) This batgrbproduct analysis is done using the HEASARC data.
- 3) This batgrbproduct analysis is using the flight position for the mask-weighting calculation.
======================================================================
BAT GRB EVENT DATA PROCESSING REPORT
Process Script Ver: batgrbproduct v2.46
Process Start Time: Fri Jul 6 12:19:21 EDT 2018
Host Name: bat1
Current Working Dir: /local/data/bat1/alien/Swift_3rdBATcatalog/event/batevent_reproc/trigger835200
======================================================================
Trigger: 00835200 Segment: 000
BAT Trigger Time: 549620112 [s; MET]
Trigger Stop: 549620176 [s; MET]
UTC: 2018-06-02T08:14:50.959800 [includes UTCF correction]
Where From?: TDRSS position message
BAT
RA: 142.33930428647 Dec: 32.0927735904 [deg; J2000]
Catalogged Source?: NO
Point Source?: YES
GRB Indicated?: YES [ by BAT flight software ]
Image S/N Ratio: 7.3
Image Trigger?: YES
Rate S/N Ratio: 0 [ if not an image trigger ]
Image S/N Ratio: 7.3
Analysis Position: [ source = BAT ]
RA: 142.33930428647 Dec: 32.0927735904 [deg; J2000]
Refined Position: [ source = BAT pre-slew burst ]
RA: 142.3379578901 Dec: 32.0834759326783 [deg; J2000]
{ 09h 29m 21.1s , +32d 05' 00.5" }
+/- 1.48586983770063 [arcmin] (estimated 90% radius based on SNR)
+/- 0.59414834067352 [arcmin] (formal 1-sigma fit error)
SNR: 17.2755375622003
Angular difference between the analysis and refined position is 0.562042 arcmin
Partial Coding Fraction: 0.7890625 [ including projection effects ]
Duration
T90: 53.203999876976 +/- 10.1974963735852
Measured from: -32.3999999761581
to: 20.8039999008179 [s; relative to TRIGTIME]
T50: 17.6000000238419 +/- 3.31492139140463
Measured from: -22.37600004673
to: -4.77600002288818 [s; relative to TRIGTIME]
Fluence
Peak Flux (peak 1 second)
Measured from: -19.5720000267029
to: -18.5720000267029 [s; relative to TRIGTIME]
Total Fluence
Measured from: -39.3719999790192
to: 30.2480000257492 [s; relative to TRIGTIME]
Band 1 Band 2 Band 3 Band 4
15-25 25-50 50-100 100-350 keV
Total 0.928571 1.221477 0.693962 0.140133
0.058479 0.061097 0.053935 0.047623 [error]
Peak 0.023619 0.048572 0.039095 0.009362
0.007248 0.007989 0.006664 0.005669 [error]
[ fluence units of on-axis counts / fully illuminated detector ]
======================================================================
====== Table of the duration information =============================
Value tstart tstop
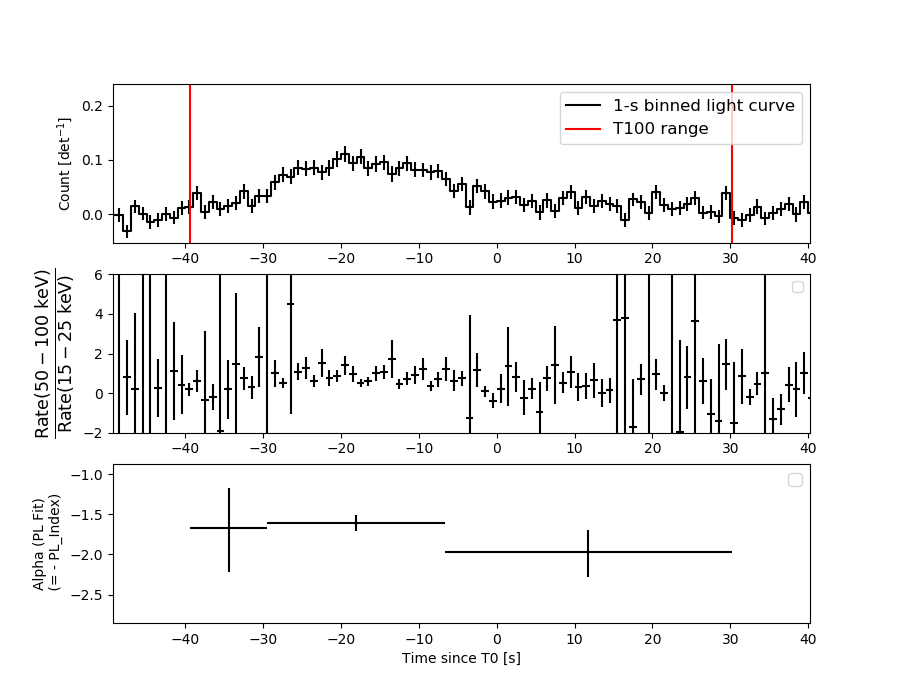
T100 69.620 -39.372 30.248
T90 53.204 -32.400 20.804
T50 17.600 -22.376 -4.776
Peak 1.000 -19.572 -18.572
====== Spectral Analysis Summary =====================================
Model : spectral model: simple power-law (PL) and cutoff power-law (CPL)
Ph_index : photon index: E^{Ph_index}
Ph_90err : 90% error of the photon index
Epeak : Epeak in keV
Epeak_90err: 90% error of Epeak
Norm : normalization at 50 keV in both the PL model and CPL model
Nomr_90err : 90% error of the normalization
chi2 : Chi-Squared
dof : degree of freedo
=== Time-averaged spectral analysis ===
(Best model with acceptable fit: PL)
Model Ph_index Ph_90err_low Ph_90err_hi Epeak Epeak_90err_low Epeak_90err_hi Norm Nomr_90err_low Norm_90err_hi chi2 dof
PL -1.713 -0.114 0.113 - - - 2.69e-03 -1.82e-04 1.81e-04 45.030 57
CPL -1.299 -0.441 0.496 77.605 -21.334 -77.605 4.49e-03 -1.84e-03 3.75e-03 42.470 56
=== 1-s peak spectral analysis ===
(Best model with acceptable fit: PL)
Model Ph_index Ph_90err_low Ph_90err_hi Epeak Epeak_90err_low Epeak_90err_hi Norm Nomr_90err_low Norm_90err_hi chi2 dof
PL -1.252 -0.294 0.303 - - - 8.13e-03 -1.43e-03 1.43e-03 49.940 57
CPL -0.855 -1.190 1.477 149.098 -149.098 -149.098 1.28e-02 -5.97e-03 5.50e-02 49.600 56
=== Fluence/Peak Flux Summary ===
Model Band1 Band2 Band3 Band4 Band5 Total
15-25 25-50 50-100 100-350 15-150 15-350 keV
Fluence PL 2.92e-07 4.71e-07 5.75e-07 1.38e-06 1.73e-06 2.72e-06 erg/cm2
90%_error_low -2.84e-08 -2.90e-08 -5.30e-08 -2.49e-07 -1.23e-07 -2.99e-07 erg/cm2
90%_error_hi 2.91e-08 2.90e-08 5.33e-08 2.84e-07 1.24e-07 3.27e-07 erg/cm2
Peak flux PL 2.64e-01 3.08e-01 2.59e-01 3.67e-01 9.62e-01 1.20e+00 ph/cm2/s
90%_error_low -8.22e-02 -6.32e-02 -5.32e-02 -1.35e-01 -1.74e-01 -2.18e-01 ph/cm2/s
90%_error_hi 8.97e-02 6.18e-02 5.24e-02 1.78e-01 1.75e-01 2.22e-01 ph/cm2/s
Fluence CPL 2.76e-07 4.93e-07 5.77e-07 7.00e-07 1.66e-06 2.05e-06 erg/cm2
90%_error_low -3.29e-08 -3.68e-08 -5.69e-08 -3.42e-07 -1.45e-07 -3.75e-07 erg/cm2
90%_error_hi 3.33e-08 3.78e-08 5.66e-08 7.24e-07 1.46e-07 7.40e-07 erg/cm2
Peak flux CPL 2.45e-01 3.20e-01 2.69e-01 2.35e-01 9.50e-01 1.07e+00 ph/cm2/s
90%_error_low -9.72e-02 -7.13e-02 -6.01e-02 -2.35e-01 -1.79e-01 -2.59e-01 ph/cm2/s
90%_error_hi 1.02e-01 7.68e-02 6.30e-02 1.79e-01 1.78e-01 2.79e-01 ph/cm2/s
======================================================================
Image
Pre-slew 15.0-350.0 keV image (Event data)
#   RAcent    DECcent   POSerr    Theta     Phi              Peak Cts       SNR   Name
  142.3380    32.0835   0.0111    19.7070   128.2339         1.7815435     17.276 TRIG_00835200

Foreground time interval of the image:
-16.899  30.248 (delta_t =  47.147 [sec])
Background time interval of the image:
Light Curves
Note: The mask-weighted lightcurves have units of either count/det or counts/sec/det, where a det is 0.4 x 0.4 = 0.16 sq cm.
Full-time range; 1 s binning
Other quick-look light curves:
- 64 ms binning (zoomed)
- 16 ms binning (zoomed)
- 8 ms binning (zoomed)
- 2 ms binning (zoomed)
- SN=5 or 10 s binning (full-time range)
- Raw light curve
Spectra
- 64 ms binning (zoomed)
- 16 ms binning (zoomed)
- 8 ms binning (zoomed)
- 2 ms binning (zoomed)
- SN=5 or 10 s binning (full-time range)
- Raw light curve
Spectra
Notes:
- 1) The fitting includes the systematic errors.
- 2) When the burst includes telescope slew time periods, the fitting uses an average response file made from multiple 5-s response files through out the slew time plus single time preiod for the non-slew times, and weighted by the total counts in the corresponding time period using addrmf. An average response file is needed becuase a spectral fit using the pre-slew DRM will introduce some errors in both a spectral shape and a normalization if the PHA file contains a lot of the slew/post-slew time interval.
- 3) For fits to more complicated models (e.g. a power-law over a cutoff power-law), the BAT team has decided to require a chi-square improvement of more than 6 for each extra dof.
Time averaged spectrum fit using the average DRM
Power-law model
Time interval is from  -39.372 sec. to   30.248 sec.

Spectral model in power-law:
------------------------------------------------------------
Parameters  : value       lower 90%   higher 90%
Photon index: -1.71289     ( -0.114494   0.11251 )
Norm@50keV  : 2.68875E-03    ( -0.000182443   0.000180759 )
------------------------------------------------------------
#Fit statistic : Chi-Squared =          45.03 using 59 PHA bins.
# Reduced chi-squared =         0.7900 for     57 degrees of freedom
# Null hypothesis probability =   8.742984e-01

Photon flux (15-150 keV)    in 69.62 sec: 0.358734 ( -0.022183  0.022202 ) ph/cm2/s
Energy fluence (15-150 keV)             : 1.73171e-06 ( -1.23048e-07  1.24404e-07 ) ergs/cm2
Cutoff power-law model
Time interval is from  -39.372 sec. to   30.248 sec.
Spectral model in the cutoff power-law:
------------------------------------------------------------
Parameters  : value       lower 90%   higher 90%
Photon index: -1.29883     ( -0.440629   0.495599 )
Epeak [keV] : 77.6052      ( -21.3341 -77.6052 )
Norm@50keV  : 4.49068E-03    ( -0.00184179   0.00374889 )
------------------------------------------------------------
#Fit statistic : Chi-Squared =          42.47 using 59 PHA bins.
# Reduced chi-squared =         0.7585 for     56 degrees of freedom
# Null hypothesis probability =   9.089224e-01

Photon flux (15-150 keV)    in 69.62 sec: 0.351080 ( -0.0236  0.023588 ) ph/cm2/s
Energy fluence (15-150 keV)             : 1.65872e-06 ( -1.44661e-07  1.45722e-07 ) ergs/cm2
1-s peak spectrum fit
Power-law model
Time interval is from  -19.572 sec. to  -18.572 sec.

Spectral model in power-law:
------------------------------------------------------------
Parameters  : value       lower 90%   higher 90%
Photon index: -1.25175     ( -0.294277   0.302843 )
Norm@50keV  : 8.12887E-03    ( -0.00143247   0.00143195 )
------------------------------------------------------------
#Fit statistic : Chi-Squared =          49.94 using 59 PHA bins.
# Reduced chi-squared =         0.8761 for     57 degrees of freedom
# Null hypothesis probability =   7.348818e-01

Photon flux (15-150 keV)    in 1 sec: 0.961707 ( -0.174208  0.174663 ) ph/cm2/s
Energy fluence (15-150 keV)             : 8.13242e-08 ( -1.5684e-08  1.58453e-08 ) ergs/cm2
Cutoff power-law model
Time interval is from  -19.572 sec. to  -18.572 sec.
Spectral model in the cutoff power-law:
------------------------------------------------------------
Parameters  : value       lower 90%   higher 90%
Photon index: -0.854801     ( -1.18983   1.47672 )
Epeak [keV] : 149.098      ( -149.167 -149.167 )
Norm@50keV  : 1.28105E-02    ( -0.00596966   0.0549788 )
------------------------------------------------------------
#Fit statistic : Chi-Squared =          49.60 using 59 PHA bins.
# Reduced chi-squared =         0.8856 for     56 degrees of freedom
# Null hypothesis probability =   7.143947e-01

Photon flux (15-150 keV)    in 1 sec: 0.949796 ( -0.178585  0.178094 ) ph/cm2/s
Energy fluence (15-150 keV)             : 7.92228e-08 ( -1.74368e-08  1.69406e-08 ) ergs/cm2
Time-resolved spectra
Distribution
T90 vs. Hardness ratio plot
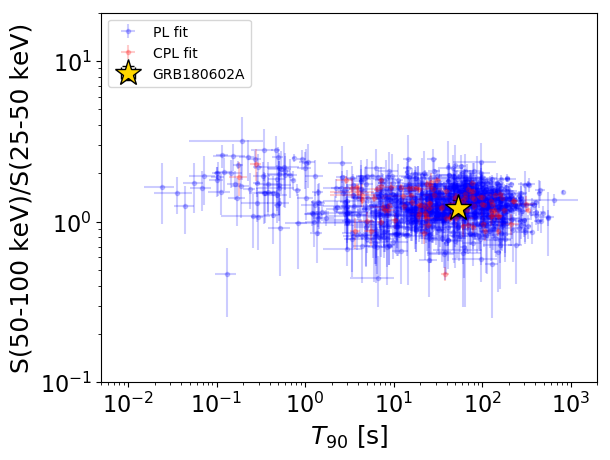
T90                                   = 53.204 sec.
Hardness ratio (energy fluence ratio) = 1.2202530727
S(15-50 keV) vs. S(50-150 keV) plot
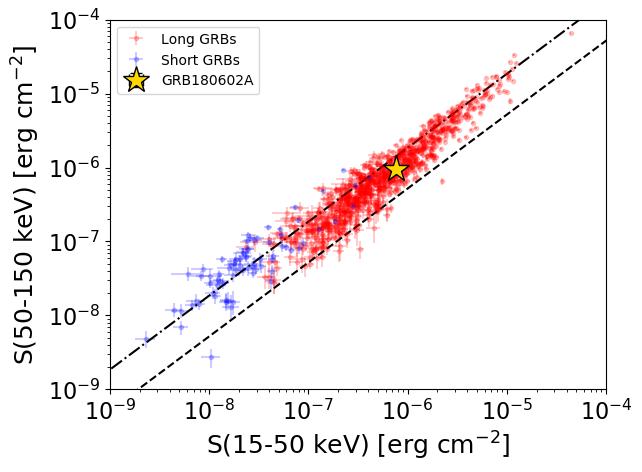
S(15-50 keV)  = 7.632511e-07
S(50-150 keV) = 9.684789e-07
The dash-dotted line and the dashed line traces the fluences calculated from the Band function with Epeak = 15 and 150 keV, respectively. Both lines assume a canonical values of alpha = -1 and beta = -2.5.
Mask shadow pattern
IMX = -2.216738482059665E-01, IMY = -2.813543010671655E-01
Spacecraft aspect plot
Bright source in the pre-burst/pre-slew/post-slew images
Pre-burst image of 15-350 keV band
Time interval of the image:
Pre-slew background subtracted image of 15-350 keV band
Time interval of the image:
-16.899400 30.248000

# RAcent  DECcent POSerr Theta    Phi  PeakCts   SNR AngSep     Name
#  [deg]    [deg]    ['] [deg]  [deg]                   [']
 83.6337  22.0170    1.6  40.2 -110.9   2.2950   7.1    0.2	Crab
142.3380  32.0835    0.7  19.7  128.2   1.7816  17.3 ------	UNKNOWN
Post-slew image of 15-350 keV band
Time interval of the image:
113.500600 963.180000

# RAcent  DECcent POSerr Theta    Phi  PeakCts   SNR AngSep     Name
#  [deg]    [deg]    ['] [deg]  [deg]                   [']
181.7411  12.8400    4.2  40.9   98.2   8.1291   2.7 ------	UNKNOWN
191.1488  35.6529    2.9  40.3   60.4   8.1755   4.1 ------	UNKNOWN
146.8506 -19.1950    3.0  51.5  163.8  11.2313   3.9 ------	UNKNOWN
109.6449  81.4456    3.4  50.8  -16.6   4.8257   3.4 ------	UNKNOWN