Analysis Summary
Notes:
- 1) No attempt has been made to eliminate the non-significant decimal places.
- 2) This batgrbproduct analysis is done using the HEASARC data.
- 3) This batgrbproduct analysis is using the flight position for the mask-weighting calculation.
======================================================================
                  BAT GRB EVENT DATA PROCESSING REPORT
    Process Script Ver: batgrbproduct v2.46
    Process Start Time: Fri Jul  6 12:02:45 EDT 2018
             Host Name: bat1
   Current Working Dir: /local/data/bat1/alien/Swift_3rdBATcatalog/event/batevent_reproc/trigger843211
======================================================================

  Trigger: 00843211      Segment: 000

  BAT Trigger Time: 551202658.304   [s; MET]
      Trigger Stop: 551202659.328   [s; MET]
               UTC: 2018-06-20T15:50:37.167500    [includes UTCF correction]
       Where From?: TDRSS position message

  BAT
    RA: 357.516541175609   Dec: -57.9572576503267  [deg; J2000]

     Catalogged Source?: NO
     Point Source?:      YES
     GRB Indicated?:     YES    [ by BAT flight software ]
     Image S/N Ratio:    16.36
     Image Trigger?:     NO
     Rate S/N Ratio:     59.042357676502  [ if not an image trigger ]
     Image S/N Ratio:    16.36

  Analysis Position:   [ source = BAT ]
    RA: 357.516541175609   Dec: -57.9572576503267  [deg; J2000]

  Refined Position:   [ source = BAT pre-slew burst ]
    RA: 357.511569795715   Dec: -57.9551091928789  [deg; J2000]
        { 23h 50m 02.8s , -57d 57' 18.4" }
         +/- 0.778639997320264 [arcmin] (estimated 90% radius based on SNR)
         +/- 0.274451788947138 [arcmin] (formal 1-sigma fit error)
    SNR: 43.4862194364001

  Angular difference between the analysis and refined position is 0.204115 arcmin

  Partial Coding Fraction: 0.78125    [ including projection effects ]

  Duration
     T90: 223.96799993515 +/- 26.1326944119251
        Measured from: -118.840000033379
                   to: 105.127999901772     [s; relative to TRIGTIME]
     T50: 43.4159998893738 +/- 4.58923434841652
        Measured from: -3.2039999961853
                   to: 40.2119998931885     [s; relative to TRIGTIME]


  Fluence
     Peak Flux  (peak 1 second)
        Measured from: -0.332000017166138
                   to: 0.667999982833862     [s; relative to TRIGTIME]
     Total Fluence
        Measured from: -159.37600004673
                   to: 162.427999973297     [s; relative to TRIGTIME]

             Band 1     Band 2     Band 3     Band 4
              15-25      25-50     50-100    100-350     keV
 Total     4.566428   6.256223   4.580516   1.101189
           0.119530   0.119995   0.102970   0.088156 [error]
 Peak      0.079007   0.163107   0.164361   0.052066
           0.008225   0.009349   0.009127   0.006691 [error]

     [ fluence units of on-axis counts / fully illuminated detector ]

======================================================================


====== Table of the duration information =============================

        Value   tstart    tstop
T100  321.804 -159.376  162.428
T90   223.968 -118.840  105.128
T50    43.416   -3.204   40.212
Peak    1.000   -0.332    0.668


====== Spectral Analysis Summary =====================================

Model      : spectral model: simple power-law (PL) and cutoff power-law (CPL)
Ph_index   : photon index: E^{Ph_index}
Ph_90err   : 90% error of the photon index
Epeak      : Epeak in keV
Epeak_90err: 90% error of Epeak
Norm       : normalization at 50 keV in both the PL model and CPL model
Nomr_90err : 90% error of the normalization
chi2       : Chi-Squared
dof        : degree of freedo

=== Time-averaged spectral analysis ===
(Best model with acceptable fit: CPL)

Model Ph_index Ph_90err_low Ph_90err_hi  Epeak  Epeak_90err_low  Epeak_90err_hi  Norm       Nomr_90err_low    Norm_90err_hi    chi2    dof
PL      -1.580    -0.048      0.048       -           -               -         3.37e-03     -8.36e-05          8.36e-05      65.940   57
CPL     -1.305    -0.189      0.197      137.135     -35.513       166.330      4.51e-03     -7.99e-04          1.02e-03      59.670   56


=== 1-s peak spectral analysis ===
(Best model with acceptable fit: PL)

Model Ph_index Ph_90err_low Ph_90err_hi  Epeak  Epeak_90err_low  Epeak_90err_hi  Norm       Nomr_90err_low    Norm_90err_hi    chi2    dof
PL      -1.099     -0.103     0.105       -           -               -         3.14e-02     -1.91e-03          1.91e-03      53.150   57
CPL     -0.799     -0.342     0.428      231.874      N/A           N/A         4.27e-02        N/A               N/A         51.470   56


=== Fluence/Peak Flux Summary ===

              Model    Band1     Band2     Band3     Band4     Band5     Total
                       15-25     25-50    50-100    100-350    15-150    15-350    keV
Fluence         PL   1.49e-06  2.61e-06  3.50e-06  9.58e-06  1.02e-05  1.72e-05   erg/cm2
      90%_error_low -7.42e-08 -7.52e-08 -1.08e-07 -6.64e-07 -2.62e-07 -7.22e-07   erg/cm2
      90%_error_hi   7.57e-08  7.50e-08  1.08e-07  6.98e-07  2.63e-07  7.49e-07   erg/cm2
Peak flux       PL   8.81e-01  1.13e+00  1.05e+00  1.73e+00  3.64e+00  4.79e+00   ph/cm2/s
      90%_error_low -1.05e-01 -8.43e-02 -7.02e-02 -2.34e-01 -2.28e-01 -3.06e-01   ph/cm2/s
      90%_error_hi   1.10e-01  8.36e-02  6.97e-02  2.56e-01  2.29e-01  3.10e-01   ph/cm2/s

Fluence        CPL   1.40e-06  2.65e-06  3.57e-06  6.68e-06  9.97e-06  1.43e-05   erg/cm2
      90%_error_low -9.59e-08 -8.09e-08 -1.19e-07 -1.40e-06 -2.97e-07 -1.42e-06   erg/cm2
      90%_error_hi   9.78e-08  8.14e-08  1.20e-07  1.85e-06  2.96e-07  1.86e-06   erg/cm2
Peak flux      CPL   8.15e-01  1.15e+00  1.09e+00  1.29e+00  3.60e+00  4.35e+00   ph/cm2/s
      90%_error_low -1.32e-01 -8.96e-02 -8.77e-02 -3.99e-01 -2.34e-01 -4.70e-01   ph/cm2/s
      90%_error_hi   1.37e-01  9.05e-02  8.90e-02  4.28e-01  2.34e-01  5.98e-01   ph/cm2/s

======================================================================
Image
Pre-slew 15.0-350.0 keV image (Event data)

#   RAcent    DECcent   POSerr    Theta     Phi              Peak Cts       SNR   Name
  357.5116   -57.9551   0.0044    30.3956  -176.7104        10.2661375     43.486 TRIG_00843211

Foreground time interval of the image:
-158.203  16.797 (delta_t = 175.000 [sec])
Background time interval of the image:
Light Curves
Note: The mask-weighted lightcurves have units of either count/det or counts/sec/det, where a det is 0.4 x 0.4 = 0.16 sq cm.
Full-time range; 1 s binning
Other quick-look light curves:
- 64 ms binning (zoomed)
- 16 ms binning (zoomed)
- 8 ms binning (zoomed)
- 2 ms binning (zoomed)
- SN=5 or 10 s binning (full-time range)
- Raw light curve
Spectra
- 64 ms binning (zoomed)
- 16 ms binning (zoomed)
- 8 ms binning (zoomed)
- 2 ms binning (zoomed)
- SN=5 or 10 s binning (full-time range)
- Raw light curve
Spectra
Notes:
- 1) The fitting includes the systematic errors.
- 2) When the burst includes telescope slew time periods, the fitting uses an average response file made from multiple 5-s response files through out the slew time plus single time preiod for the non-slew times, and weighted by the total counts in the corresponding time period using addrmf. An average response file is needed becuase a spectral fit using the pre-slew DRM will introduce some errors in both a spectral shape and a normalization if the PHA file contains a lot of the slew/post-slew time interval.
- 3) For fits to more complicated models (e.g. a power-law over a cutoff power-law), the BAT team has decided to require a chi-square improvement of more than 6 for each extra dof.
Time averaged spectrum fit using the average DRM
Power-law model

Time interval is from -159.376 sec. to  162.428 sec.

Spectral model in power-law:
------------------------------------------------------------
Parameters  : value       lower 90%   higher 90%
Photon index: -1.58023     ( -0.0476839   0.0476638 )
Norm@50keV  : 3.37104E-03    ( -8.35712e-05   8.35664e-05 )
------------------------------------------------------------
#Fit statistic : Chi-Squared =          65.94 using 59 PHA bins.
# Reduced chi-squared =          1.157 for     57 degrees of freedom
# Null hypothesis probability =   1.950995e-01

Photon flux (15-150 keV)    in 321.8 sec: 0.430598 ( -0.012073  0.012118 ) ph/cm2/s
Energy fluence (15-150 keV)             : 1.01717e-05 ( -2.62374e-07  2.62862e-07 ) ergs/cm2
Cutoff power-law model

Time interval is from -159.376 sec. to  162.428 sec.
Spectral model in the cutoff power-law:
------------------------------------------------------------
Parameters  : value       lower 90%   higher 90%
Photon index: -1.30546     ( -0.188844   0.197141 )
Epeak [keV] : 137.135      ( -35.5131 166.33 )
Norm@50keV  : 4.51152E-03    ( -0.000799035   0.00101921 )
------------------------------------------------------------
#Fit statistic : Chi-Squared =          59.67 using 59 PHA bins.
# Reduced chi-squared =          1.066 for     56 degrees of freedom
# Null hypothesis probability =   3.438031e-01

Photon flux (15-150 keV)    in 321.8 sec: 0.421092 ( -0.01353  0.013599 ) ph/cm2/s
Energy fluence (15-150 keV)             : 9.96911e-06 ( -2.97112e-07  2.96297e-07 ) ergs/cm2
1-s peak spectrum fit
Power-law model

Time interval is from   -0.332 sec. to    0.668 sec.

Spectral model in power-law:
------------------------------------------------------------
Parameters  : value       lower 90%   higher 90%
Photon index: -1.09862     ( -0.103499   0.104505 )
Norm@50keV  : 3.14154E-02    ( -0.00190835   0.0019053 )
------------------------------------------------------------
#Fit statistic : Chi-Squared =          53.15 using 59 PHA bins.
# Reduced chi-squared =         0.9324 for     57 degrees of freedom
# Null hypothesis probability =   6.203525e-01

Photon flux (15-150 keV)    in 1 sec: 3.64350 ( -0.22821  0.22853 ) ph/cm2/s
Energy fluence (15-150 keV)             : 3.28632e-07 ( -2.14753e-08  2.1555e-08 ) ergs/cm2
Cutoff power-law model

Time interval is from   -0.332 sec. to    0.668 sec.
Spectral model in the cutoff power-law:
------------------------------------------------------------
Parameters  : value       lower 90%   higher 90%
Photon index: -0.799176     ( -0.341989   0.428472 )
Epeak [keV] : 231.874      (   )
Norm@50keV  : 4.27352E-02    (     )
------------------------------------------------------------
#Fit statistic : Chi-Squared =          51.47 using 59 PHA bins.
# Reduced chi-squared =         0.9190 for     56 degrees of freedom
# Null hypothesis probability =   6.469605e-01

Photon flux (15-150 keV)    in 1 sec: 3.60317 ( -0.23406  0.23429 ) ph/cm2/s
Energy fluence (15-150 keV)             : 3.25095e-07 ( -2.22782e-08  2.22012e-08 ) ergs/cm2
Time-resolved spectra

Distribution
T90 vs. Hardness ratio plot
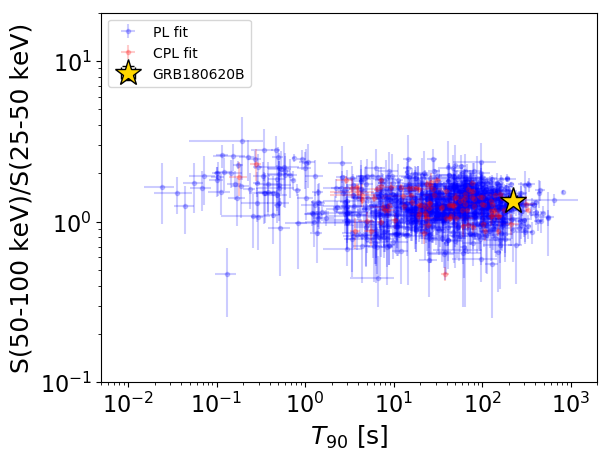
T90                                   = 223.968 sec.
Hardness ratio (energy fluence ratio) = 1.34409553312
S(15-50 keV) vs. S(50-150 keV) plot

S(15-50 keV)  = 4.050686e-06
S(50-150 keV) = 5.918468e-06
The dash-dotted line and the dashed line traces the fluences calculated from the Band function with Epeak = 15 and 150 keV, respectively. Both lines assume a canonical values of alpha = -1 and beta = -2.5.
Mask shadow pattern

IMX = -5.856277205807686E-01, IMY = 3.366015288200561E-02
Spacecraft aspect plot

Bright source in the pre-burst/pre-slew/post-slew images
Pre-burst image of 15-350 keV band
Time interval of the image:
Pre-slew background subtracted image of 15-350 keV band
Time interval of the image:
-158.203400 16.796600

# RAcent  DECcent POSerr Theta    Phi  PeakCts   SNR AngSep     Name
#  [deg]    [deg]    ['] [deg]  [deg]                   [']
170.3036 -60.6104    2.1  32.3  -20.0   1.2916   5.5    0.8	Cen X-3
186.5955 -62.6226    5.1  29.0   -5.7   0.5148   2.2    9.0	GX 301-2
215.3303 -62.6987    2.0  26.3   22.1   1.3681   5.9 ------	UNKNOWN
357.5116 -57.9551    0.3  30.4 -176.7  10.2658  43.5 ------	UNKNOWN
Post-slew image of 15-350 keV band
Time interval of the image:
71.996590 842.808900

# RAcent  DECcent POSerr Theta    Phi  PeakCts   SNR AngSep     Name
#  [deg]    [deg]    ['] [deg]  [deg]                   [']
345.6194 -40.7620    2.9  18.8  162.8   2.1724   4.0 ------	UNKNOWN
 56.3049 -39.6568    3.7  41.2  -78.2   8.7968   3.1 ------	UNKNOWN