Analysis Summary
Notes:
- 1) No attempt has been made to eliminate the non-significant decimal places.
- 2) This batgrbproduct analysis is done using the HEASARC data.
- 3) This batgrbproduct analysis is using the flight position for the mask-weighting calculation.
======================================================================
                  BAT GRB EVENT DATA PROCESSING REPORT
    Process Script Ver: batgrbproduct v2.46
    Process Start Time: Mon Aug  6 18:56:00 EDT 2018
             Host Name: bat1
   Current Working Dir: /local/data/bat1/alien/Swift_3rdBATcatalog/event/batevent_reproc/trigger844015
======================================================================

  Trigger: 00844015      Segment: 000

  BAT Trigger Time: 551464937.536   [s; MET]
      Trigger Stop: 551464938.56   [s; MET]
               UTC: 2018-06-23T16:41:56.383500    [includes UTCF correction]
       Where From?: TDRSS position message

  BAT
    RA: 214.511433345221   Dec: -60.2943173268399  [deg; J2000]

     Catalogged Source?: NO
     Point Source?:      YES
     GRB Indicated?:     YES    [ by BAT flight software ]
     Image S/N Ratio:    7.68
     Image Trigger?:     NO
     Rate S/N Ratio:     21.6794833886788  [ if not an image trigger ]
     Image S/N Ratio:    7.68

  Analysis Position:   [ source = BAT ]
    RA: 214.511433345221   Dec: -60.2943173268399  [deg; J2000]

  Refined Position:   [ source = BAT pre-slew burst ]
    RA: 214.528304880577   Dec: -60.2682278847358  [deg; J2000]
        { 14h 18m 06.8s , -60d 16' 05.6" }
         +/- 0.869028475349914 [arcmin] (estimated 90% radius based on SNR)
         +/- 0.252421402495833 [arcmin] (formal 1-sigma fit error)
    SNR: 37.1717198594497

  Angular difference between the analysis and refined position is 1.643841 arcmin

  Partial Coding Fraction: 0.6328125    [ including projection effects ]

  Duration
     T90: 114.879999995232 +/- 6.81986998340227
        Measured from: -37.1720000505447
                   to: 77.7079999446869     [s; relative to TRIGTIME]
     T50: 57.9679999351501 +/- 1.19814527588882
        Measured from: 4.67599999904633
                   to: 62.6439999341965     [s; relative to TRIGTIME]


  Fluence
     Peak Flux  (peak 1 second)
        Measured from: 59.1080000400543
                   to: 60.1080000400543     [s; relative to TRIGTIME]
     Total Fluence
        Measured from: -61.8200000524521
                   to: 114.067999958992     [s; relative to TRIGTIME]

             Band 1     Band 2     Band 3     Band 4
              15-25      25-50     50-100    100-350     keV
 Total     4.807608   6.713509   5.368042   1.519563
           0.101476   0.102133   0.088507   0.071203 [error]
 Peak      0.173210   0.243054   0.220925   0.070395
           0.008414   0.009447   0.009098   0.006202 [error]

     [ fluence units of on-axis counts / fully illuminated detector ]

======================================================================


====== Table of the duration information =============================

        Value   tstart    tstop
T100  175.888  -61.820  114.068
T90   114.880  -37.172   77.708
T50    57.968    4.676   62.644
Peak    1.000   59.108   60.108


====== Spectral Analysis Summary =====================================

Model      : spectral model: simple power-law (PL) and cutoff power-law (CPL)
Ph_index   : photon index: E^{Ph_index}
Ph_90err   : 90% error of the photon index
Epeak      : Epeak in keV
Epeak_90err: 90% error of Epeak
Norm       : normalization at 50 keV in both the PL model and CPL model
Nomr_90err : 90% error of the normalization
chi2       : Chi-Squared
dof        : degree of freedo

=== Time-averaged spectral analysis ===
(Best model with acceptable fit: PL)

Model Ph_index Ph_90err_low Ph_90err_hi  Epeak  Epeak_90err_low  Epeak_90err_hi  Norm       Nomr_90err_low    Norm_90err_hi    chi2    dof
PL      -1.442    -0.040      0.040       -           -               -         6.79e-03     -1.38e-04          1.38e-04      65.030   57
CPL     -1.405    -0.053      0.142      859.438    -859.438      -859.438      7.05e-03     -3.54e-04          1.01e-03      65.100   56


=== 1-s peak spectral analysis ===
(Best model with acceptable fit: PL)

Model Ph_index Ph_90err_low Ph_90err_hi  Epeak  Epeak_90err_low  Epeak_90err_hi  Norm       Nomr_90err_low    Norm_90err_hi    chi2    dof
PL      -1.305     -0.076     0.076       -           -               -         4.48e-02     -1.90e-03          1.90e-03      51.180   57
CPL     -1.224     -0.118     0.292      525.588    -525.588      -525.588      4.89e-02     -8.62e-03          1.76e-02      50.930   56


=== Fluence/Peak Flux Summary ===

              Model    Band1     Band2     Band3     Band4     Band5     Total
                       15-25     25-50    50-100    100-350    15-150    15-350    keV
Fluence         PL   1.44e-06  2.75e-06  4.05e-06  1.28e-05  1.14e-05  2.10e-05   erg/cm2
      90%_error_low -6.37e-08 -6.97e-08 -9.60e-08 -7.11e-07 -2.38e-07 -7.47e-07   erg/cm2
      90%_error_hi   6.50e-08  6.96e-08  9.57e-08  7.41e-07  2.39e-07  7.71e-07   erg/cm2
Peak flux       PL   1.53e+00  1.73e+00  1.40e+00  1.89e+00  5.35e+00  6.55e+00   ph/cm2/s
      90%_error_low -1.23e-01 -8.42e-02 -7.20e-02 -2.00e-01 -2.33e-01 -2.89e-01   ph/cm2/s
      90%_error_hi   1.26e-01  8.38e-02  7.16e-02  2.14e-01  2.34e-01  2.90e-01   ph/cm2/s

Fluence        CPL   1.44e-06  2.77e-06  4.06e-06  1.24e-05  1.14e-05  2.05e-05   erg/cm2
      90%_error_low -1.11e-07 -8.19e-08 -1.05e-07 -2.17e-06 -2.87e-07 -2.01e-06   erg/cm2
      90%_error_hi   3.78e-08  6.08e-08  1.18e-07  5.26e-07  2.72e-07  6.53e-07   erg/cm2
Peak flux      CPL   1.26e+00  8.87e-01  4.32e-01  3.60e-01  2.73e+00  2.93e+00   ph/cm2/s
      90%_error_low -1.72e-01 -1.19e-01 -6.83e-02 -5.17e-02 -3.17e-01 -4.29e-01   ph/cm2/s
      90%_error_hi   1.21e-01  8.44e-02  4.67e-02  7.74e-02  2.38e-01  2.78e-01   ph/cm2/s

======================================================================
Image
Pre-slew 15.0-350.0 keV image (Event data)
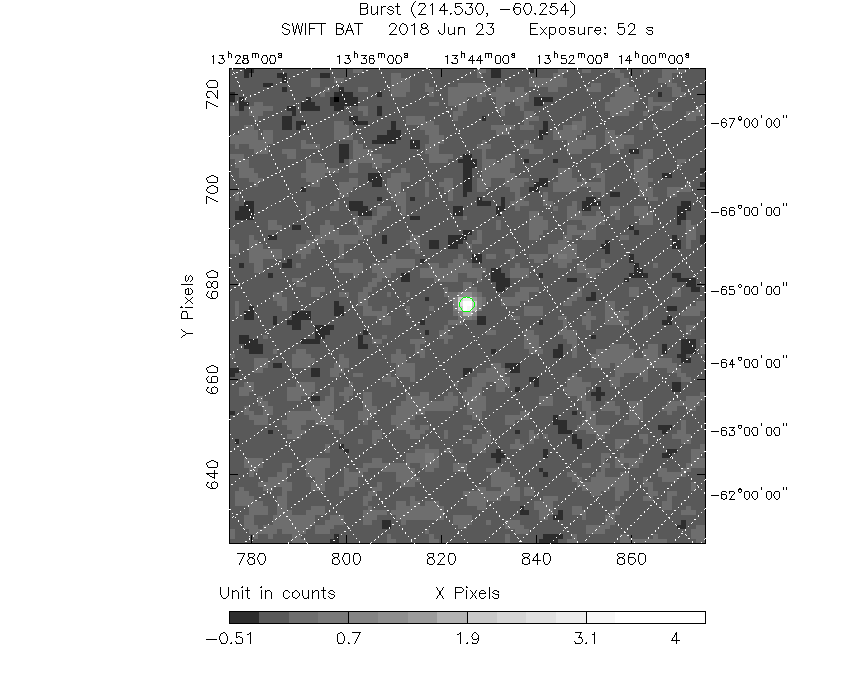
#   RAcent    DECcent   POSerr    Theta     Phi              Peak Cts       SNR   Name
  214.5283   -60.2682   0.0052    23.4516   -74.7558         4.6644762     37.172 TRIG_00844015

Foreground time interval of the image:
-35.635  16.165 (delta_t =  51.800 [sec])
Background time interval of the image:
Light Curves
Note: The mask-weighted lightcurves have units of either count/det or counts/sec/det, where a det is 0.4 x 0.4 = 0.16 sq cm.
Full-time range; 1 s binning
Other quick-look light curves:
- 64 ms binning (zoomed)
- 16 ms binning (zoomed)
- 8 ms binning (zoomed)
- 2 ms binning (zoomed)
- SN=5 or 10 s binning (full-time range)
- Raw light curve
Spectra
- 64 ms binning (zoomed)
- 16 ms binning (zoomed)
- 8 ms binning (zoomed)
- 2 ms binning (zoomed)
- SN=5 or 10 s binning (full-time range)
- Raw light curve
Spectra
Notes:
- 1) The fitting includes the systematic errors.
- 2) When the burst includes telescope slew time periods, the fitting uses an average response file made from multiple 5-s response files through out the slew time plus single time preiod for the non-slew times, and weighted by the total counts in the corresponding time period using addrmf. An average response file is needed becuase a spectral fit using the pre-slew DRM will introduce some errors in both a spectral shape and a normalization if the PHA file contains a lot of the slew/post-slew time interval.
- 3) For fits to more complicated models (e.g. a power-law over a cutoff power-law), the BAT team has decided to require a chi-square improvement of more than 6 for each extra dof.
Time averaged spectrum fit using the average DRM
Power-law model
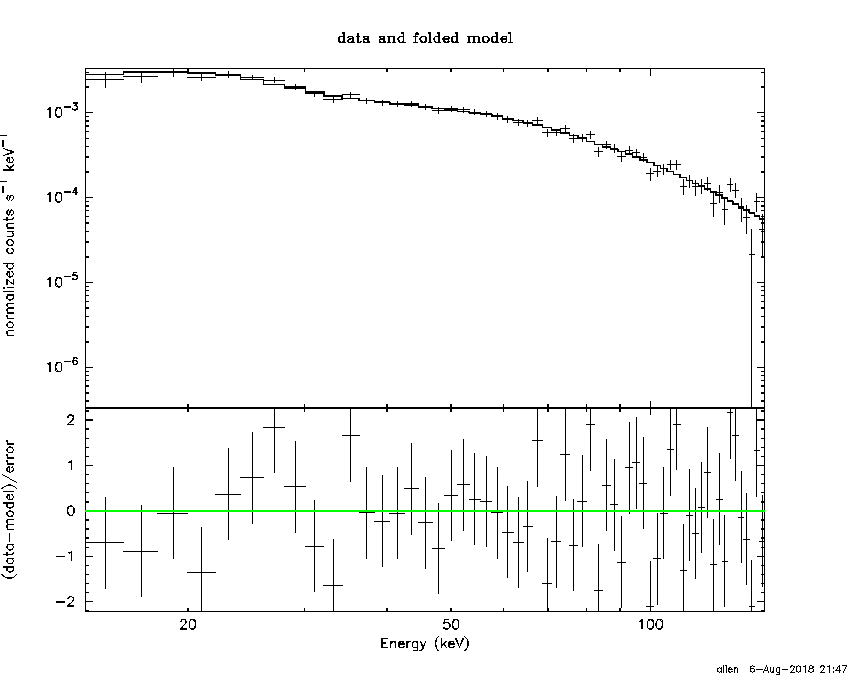
Time interval is from  -61.820 sec. to  114.068 sec.

Spectral model in power-law:
------------------------------------------------------------
Parameters  : value       lower 90%   higher 90%
Photon index: -1.44245     ( -0.0398378   0.0399052 )
Norm@50keV  : 6.78980E-03    ( -0.000138126   0.000138061 )
------------------------------------------------------------
#Fit statistic : Chi-Squared =          65.03 using 59 PHA bins.
# Reduced chi-squared =          1.141 for     57 degrees of freedom
# Null hypothesis probability =   2.174588e-01

Photon flux (15-150 keV)    in 175.9 sec: 0.835212 ( -0.019635  0.019746 ) ph/cm2/s
Energy fluence (15-150 keV)             : 1.14463e-05 ( -2.38381e-07  2.386e-07 ) ergs/cm2
Cutoff power-law model
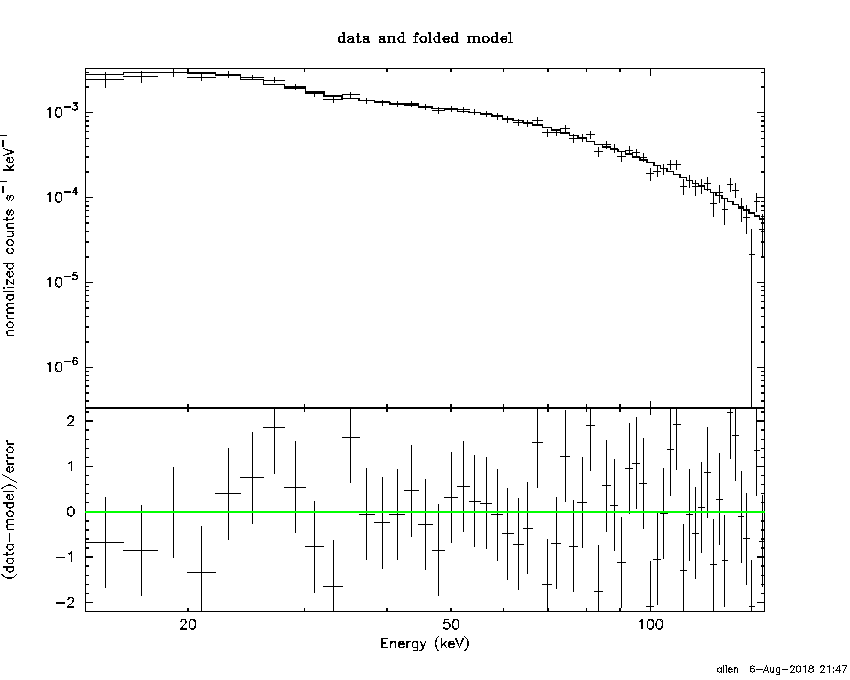
Time interval is from  -61.820 sec. to  114.068 sec.
Spectral model in the cutoff power-law:
------------------------------------------------------------
Parameters  : value       lower 90%   higher 90%
Photon index: -1.4297     ( -0.0533473   0.141683 )
Epeak [keV] : 2581.24      ( -955.673 -955.673 )
Norm@50keV  : 6.87697E-03    ( -0.00018438   0.0011823 )
------------------------------------------------------------
#Fit statistic : Chi-Squared =          64.98 using 59 PHA bins.
# Reduced chi-squared =          1.160 for     56 degrees of freedom
# Null hypothesis probability =   1.922547e-01

Photon flux (15-150 keV)    in 175.9 sec: 0.834059 ( -0.022275  0.020476 ) ph/cm2/s
Energy fluence (15-150 keV)             : 1.14318e-05 ( -2.86937e-07  2.71674e-07 ) ergs/cm2
1-s peak spectrum fit
Power-law model
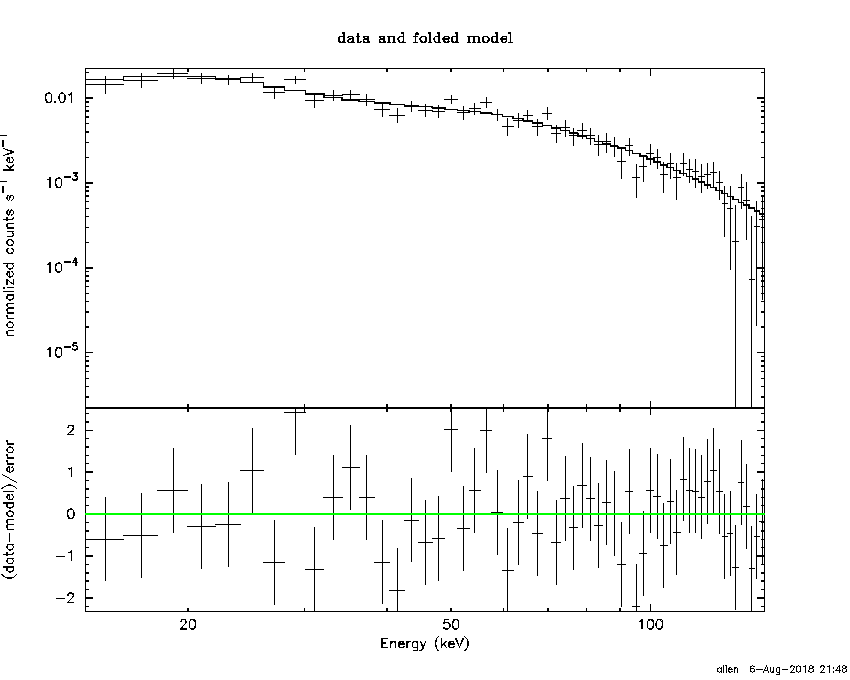
Time interval is from   59.108 sec. to   60.108 sec.

Spectral model in power-law:
------------------------------------------------------------
Parameters  : value       lower 90%   higher 90%
Photon index: -1.30451     ( -0.0764594   0.0763573 )
Norm@50keV  : 4.48258E-02    ( -0.00190236   0.00190136 )
------------------------------------------------------------
#Fit statistic : Chi-Squared =          51.18 using 59 PHA bins.
# Reduced chi-squared =         0.8978 for     57 degrees of freedom
# Null hypothesis probability =   6.922703e-01

Photon flux (15-150 keV)    in 1 sec: 5.35237 ( -0.23333  0.23365 ) ph/cm2/s
Energy fluence (15-150 keV)             : 4.42527e-07 ( -2.10441e-08  2.11227e-08 ) ergs/cm2
Cutoff power-law model

Time interval is from   59.108 sec. to   60.108 sec.
Spectral model in the cutoff power-law:
------------------------------------------------------------
Parameters  : value       lower 90%   higher 90%
Photon index: -1.22433     ( -0.117653   0.291573 )
Epeak [keV] : 525.588      ( -525.835 -525.835 )
Norm@50keV  : 4.89027E-02    ( -0.0086197   0.017565 )
------------------------------------------------------------
#Fit statistic : Chi-Squared =          50.93 using 59 PHA bins.
# Reduced chi-squared =         0.9095 for     56 degrees of freedom
# Null hypothesis probability =   6.665418e-01

Photon flux (15-150 keV)    in 1 sec: 2.72611 ( -0.31749  0.23766 ) ph/cm2/s
Energy fluence (15-150 keV)             : 4.40372e-07 ( -2.24165e-08  2.21262e-08 ) ergs/cm2
Time-resolved spectra

Distribution
T90 vs. Hardness ratio plot
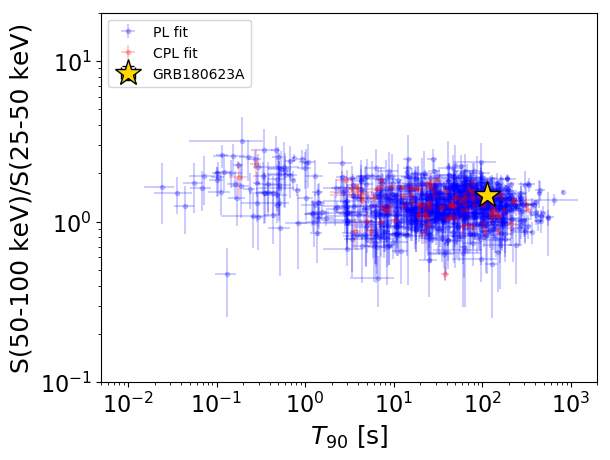
T90                                   = 114.88 sec.
Hardness ratio (energy fluence ratio) = 1.47180390027
S(15-50 keV) vs. S(50-150 keV) plot
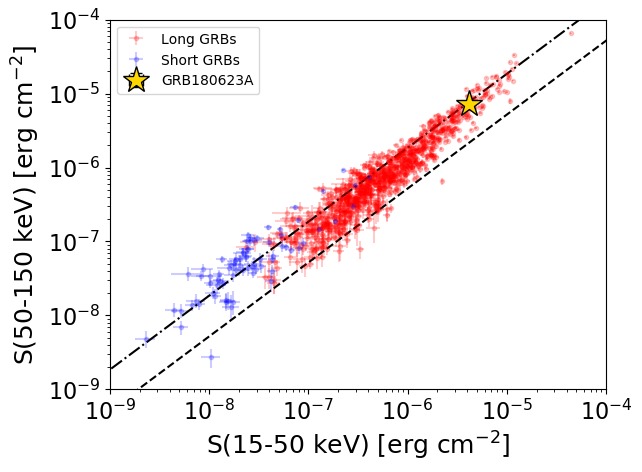
S(15-50 keV)  = 4.195234e-06
S(50-150 keV) = 7.251003e-06
The dash-dotted line and the dashed line traces the fluences calculated from the Band function with Epeak = 15 and 150 keV, respectively. Both lines assume a canonical values of alpha = -1 and beta = -2.5.
Mask shadow pattern
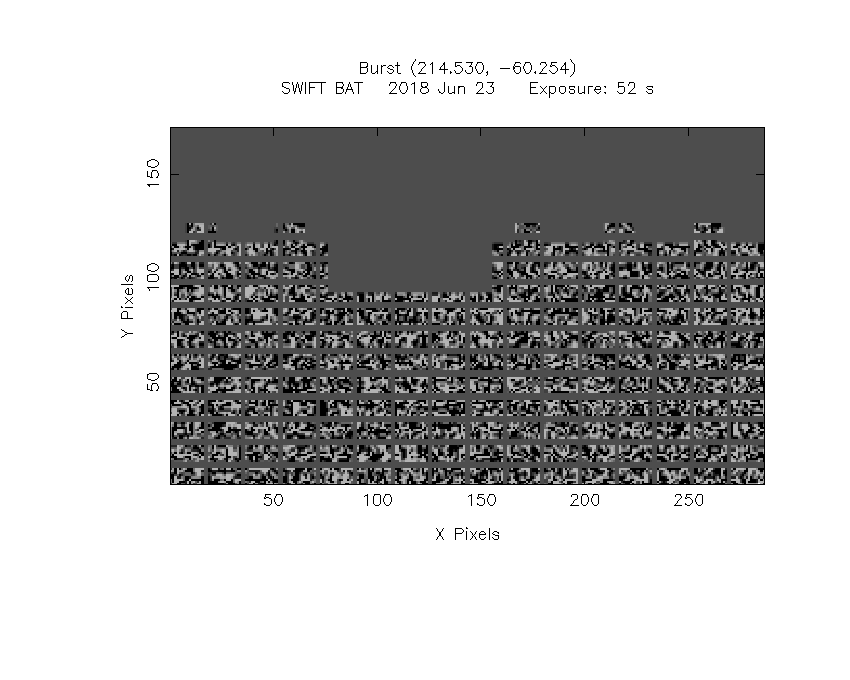
IMX = 1.140624047034001E-01, IMY = 4.185433300692041E-01
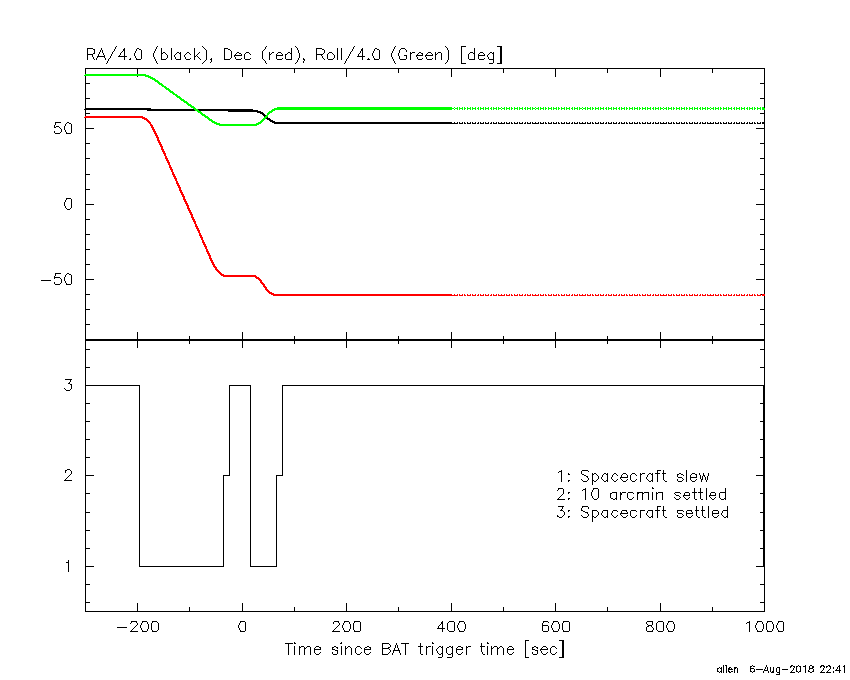
Spacecraft aspect plot
Bright source in the pre-burst/pre-slew/post-slew images
Pre-burst image of 15-350 keV band
Time interval of the image:
Pre-slew background subtracted image of 15-350 keV band
Time interval of the image:
-35.635400 16.164600

# RAcent  DECcent POSerr Theta    Phi  PeakCts   SNR AngSep     Name
#  [deg]    [deg]    ['] [deg]  [deg]                   [']
187.0051 -62.8614    0.0  36.7  -76.7   0.7740   3.3   11.0	GX 301-2
244.9679 -15.6537    0.7  31.8   54.9   2.6531  16.1    1.0	Sco X-1
255.8956 -37.9764    4.7  10.8   94.3  -0.2520  -2.4    9.0	4U 1700-377
256.6592 -36.3749    6.0  12.5   93.4   0.2114   1.9   11.2	GX 349+2
262.8133 -24.8395    0.0  25.2   93.2   0.2488   1.7   12.1	GX 1+4
264.7577 -44.6085   49.4  11.6  143.8   0.0218   0.2    9.5	4U 1735-44
270.2990 -25.1008    8.3  28.2  106.9   0.2152   1.4    1.5	GX 5-1
270.2851 -25.6368    4.3  27.7  107.4   0.4042   2.8    6.4	GRS 1758-258
274.1447 -13.9624    4.8  39.6  102.5  -0.8999  -2.4    9.2	GX 17+2
276.0411 -30.2693   38.9  27.2  122.4   0.0399   0.3    8.4	H1820-303
284.8911 -24.8681   11.3  36.5  126.2  -0.2335  -1.0    8.5	HT1900.1-2455
262.9686 -33.8117    4.2  17.4  105.5   0.3219   2.7    1.7	GX 354-0
286.1046 -18.2276    2.8  42.3  120.8   1.6141   4.1 ------	UNKNOWN
231.4273  -0.1845    2.7  49.4   38.6   2.0516   4.3 ------	UNKNOWN
280.6358 -64.2066    2.3  24.3 -153.1   0.5237   5.1 ------	UNKNOWN
338.6738 -57.6440    2.4  51.7 -161.7   1.3813   4.9 ------	UNKNOWN
214.5283 -60.2682    0.3  23.5  -74.8   4.6645  37.2 ------	UNKNOWN
177.7895 -53.2214    3.3  43.7  -63.9   1.4737   3.5 ------	UNKNOWN
Post-slew image of 15-350 keV band
Time interval of the image:
66.164600 962.534800

# RAcent  DECcent POSerr Theta    Phi  PeakCts   SNR AngSep     Name
#  [deg]    [deg]    ['] [deg]  [deg]                   [']
170.3406 -60.5544    2.2  21.4  -93.6   4.1442   5.3    4.2	Cen X-3
187.0236 -62.6468    0.0  13.3  -95.7   0.5987   0.9   12.5	GX 301-2
256.2339 -37.8125    0.0  34.4   84.9  -1.8183  -1.2   11.9	4U 1700-377
256.3032 -36.3583    8.7  35.6   83.5  -2.2285  -1.3    7.5	GX 349+2
264.7072 -44.5316    4.2  33.3  101.4   3.6038   2.7    5.1	4U 1735-44
222.3826  -7.9096    3.0  52.7   26.3  11.8445   3.9 ------	UNKNOWN
214.5855 -60.2512    2.1   0.0   48.8   3.5104   5.5 ------	UNKNOWN
215.4057 -62.7291    1.5   2.5 -172.3   4.9156   7.7 ------	UNKNOWN
 27.4869 -73.7675    2.9  45.9 -166.2   4.9650   3.9 ------	UNKNOWN
191.5644 -11.0009    4.3  52.1  -12.5   4.3698   2.7 ------	UNKNOWN
180.5637 -22.0299    3.9  45.0  -30.6   3.4727   3.0 ------	UNKNOWN
121.9862 -71.6881    2.9  35.2 -130.4   4.5538   4.1 ------	UNKNOWN
 46.2485 -62.9454    3.7  56.5 -157.1  14.0326   3.1 ------	UNKNOWN
171.8092 -19.5596    4.4  50.7  -39.3   8.4567   2.7 ------	UNKNOWN
 98.9227 -62.2763    3.9  48.0 -129.1  12.9514   3.0 ------	UNKNOWN
 96.7960 -62.4247    3.5  48.5 -130.3  14.3692   3.3 ------	UNKNOWN
 91.6245 -62.6026    3.3  49.7 -133.0  15.7278   3.5 ------	UNKNOWN