Analysis Summary
Notes:
- 1) No attempt has been made to eliminate the non-significant decimal places.
- 2) This batgrbproduct analysis is done using the HEASARC data.
- 3) This batgrbproduct analysis is using the flight position for the mask-weighting calculation.
======================================================================
                  BAT GRB EVENT DATA PROCESSING REPORT
    Process Script Ver: batgrbproduct v2.46
    Process Start Time: Mon Aug  6 18:52:00 EDT 2018
             Host Name: bat1
   Current Working Dir: /local/data/bat1/alien/Swift_3rdBATcatalog/event/batevent_reproc/trigger844192
======================================================================

  Trigger: 00844192      Segment: 000

  BAT Trigger Time: 551541001.536   [s; MET]
      Trigger Stop: 551541009.728   [s; MET]
               UTC: 2018-06-24T13:49:40.378860    [includes UTCF correction]
       Where From?: TDRSS position message

  BAT
    RA: 318.071401165986   Dec: -2.33235276584909  [deg; J2000]

     Catalogged Source?: NO
     Point Source?:      YES
     GRB Indicated?:     YES    [ by BAT flight software ]
     Image S/N Ratio:    11.04
     Image Trigger?:     NO
     Rate S/N Ratio:     11.0453610171873  [ if not an image trigger ]
     Image S/N Ratio:    11.04

  Analysis Position:   [ source = BAT ]
    RA: 318.071401165986   Dec: -2.33235276584909  [deg; J2000]

  Refined Position:   [ source = BAT pre-slew burst ]
    RA: 318.095463458227   Dec: -2.35550144814663  [deg; J2000]
        { 21h 12m 22.9s , -02d 21' 19.8" }
         +/- 1.30918314427063 [arcmin] (estimated 90% radius based on SNR)
         +/- 0.450581763197892 [arcmin] (formal 1-sigma fit error)
    SNR: 20.7002191878854

  Angular difference between the analysis and refined position is 2.002497 arcmin

  Partial Coding Fraction: 0.4765625    [ including projection effects ]

  Duration
     T90: 466.651999950409 +/- 35.756255947022
        Measured from: -43.3320000171661
                   to: 423.319999933243     [s; relative to TRIGTIME]
     T50: 325.675999879837 +/- 9.27761803203222
        Measured from: 7.45200002193451
                   to: 333.127999901772     [s; relative to TRIGTIME]


  Fluence
     Peak Flux  (peak 1 second)
        Measured from: 6.01600003242493
                   to: 7.01600003242493     [s; relative to TRIGTIME]
     Total Fluence
        Measured from: -61.5479999780655
                   to: 487.603999972343     [s; relative to TRIGTIME]

             Band 1     Band 2     Band 3     Band 4
              15-25      25-50     50-100    100-350     keV
 Total     3.442984   3.948373   2.118930   0.661762
           0.149105   0.154384   0.134741   0.118060 [error]
 Peak      0.054649   0.064581   0.035721   0.010750
           0.008783   0.009308   0.007857   0.006301 [error]

     [ fluence units of on-axis counts / fully illuminated detector ]

======================================================================


====== Table of the duration information =============================

        Value   tstart    tstop
T100  549.152  -61.548  487.604
T90   466.652  -43.332  423.320
T50   325.676    7.452  333.128
Peak    1.000    6.016    7.016


====== Spectral Analysis Summary =====================================

Model      : spectral model: simple power-law (PL) and cutoff power-law (CPL)
Ph_index   : photon index: E^{Ph_index}
Ph_90err   : 90% error of the photon index
Epeak      : Epeak in keV
Epeak_90err: 90% error of Epeak
Norm       : normalization at 50 keV in both the PL model and CPL model
Nomr_90err : 90% error of the normalization
chi2       : Chi-Squared
dof        : degree of freedo

=== Time-averaged spectral analysis ===
(Best model with acceptable fit: PL)

Model Ph_index Ph_90err_low Ph_90err_hi  Epeak  Epeak_90err_low  Epeak_90err_hi  Norm       Nomr_90err_low    Norm_90err_hi    chi2    dof
PL      -1.877    -0.098      0.096       -           -               -         1.09e-03     -6.07e-05          6.01e-05      45.770   57
CPL     -1.878    -0.097      0.098     9999.360    -9999.350      -9999.360      1.09e-03     -5.99e-05          4.91e-04      45.770   56


=== 1-s peak spectral analysis ===
(Best model with acceptable fit: PL)

Model Ph_index Ph_90err_low Ph_90err_hi  Epeak  Epeak_90err_low  Epeak_90err_hi  Norm       Nomr_90err_low    Norm_90err_hi    chi2    dof
PL      -1.873     -0.319     0.293       -           -               -         9.74e-03     -1.98e-03          1.89e-03      44.890   57
CPL     -1.875     -0.318     0.297     9999.330      N/A           N/A         9.73e-03        N/A               N/A         44.890   56


=== Fluence/Peak Flux Summary ===

              Model    Band1     Band2     Band3     Band4     Band5     Total
                       15-25     25-50    50-100    100-350    15-150    15-350    keV
Fluence         PL   1.09e-06  1.60e-06  1.74e-06  3.54e-06  5.52e-06  7.97e-06   erg/cm2
      90%_error_low -8.72e-08 -7.78e-08 -1.35e-07 -5.47e-07 -3.04e-07 -6.71e-07   erg/cm2
      90%_error_hi   8.93e-08  7.78e-08  1.35e-07  6.14e-07  3.07e-07  7.22e-07   erg/cm2
Peak flux       PL   5.74e-01  4.64e-01  2.53e-01  2.03e-01  1.38e+00  1.49e+00   ph/cm2/s
      90%_error_low -1.35e-01 -7.52e-02 -6.65e-02 -8.73e-02 -2.25e-01 -2.46e-01   ph/cm2/s
      90%_error_hi   1.41e-01  7.52e-02  6.66e-02  1.19e-01  2.25e-01  2.47e-01   ph/cm2/s

Fluence        CPL   1.10e-06  1.59e-06  1.54e-06  3.66e-06  5.18e-06  7.84e-06   erg/cm2
      90%_error_low -1.03e-07 -7.48e-08 -1.26e-07 -1.57e-06 -4.27e-07 -6.12e-07   erg/cm2
      90%_error_hi   8.56e-08  9.51e-08  1.15e-07  2.00e-07  3.47e-07  5.00e-07   erg/cm2
Peak flux      CPL   5.75e-01  4.63e-01  2.53e-01  2.08e-01  1.38e+00  1.50e+00   ph/cm2/s
      90%_error_low -1.36e-01 -7.46e-02 -6.63e-02     N/A   -2.28e-01 -3.06e-01   ph/cm2/s
      90%_error_hi   1.44e-01  8.28e-02  6.87e-02     N/A    2.24e-01  2.34e-01   ph/cm2/s

======================================================================
Image
Pre-slew 15.0-350.0 keV image (Event data)
#   RAcent    DECcent   POSerr    Theta     Phi              Peak Cts       SNR   Name
  318.0955    -2.3555   0.0093    28.6195   124.2195         4.4661499     20.700 TRIG_00844192

Foreground time interval of the image:
-61.548  49.765 (delta_t = 111.313 [sec])
Background time interval of the image:
-330.635 -315.316 (delta_t =  15.319 [sec])
-239.536 -61.548 (delta_t = 177.988 [sec])
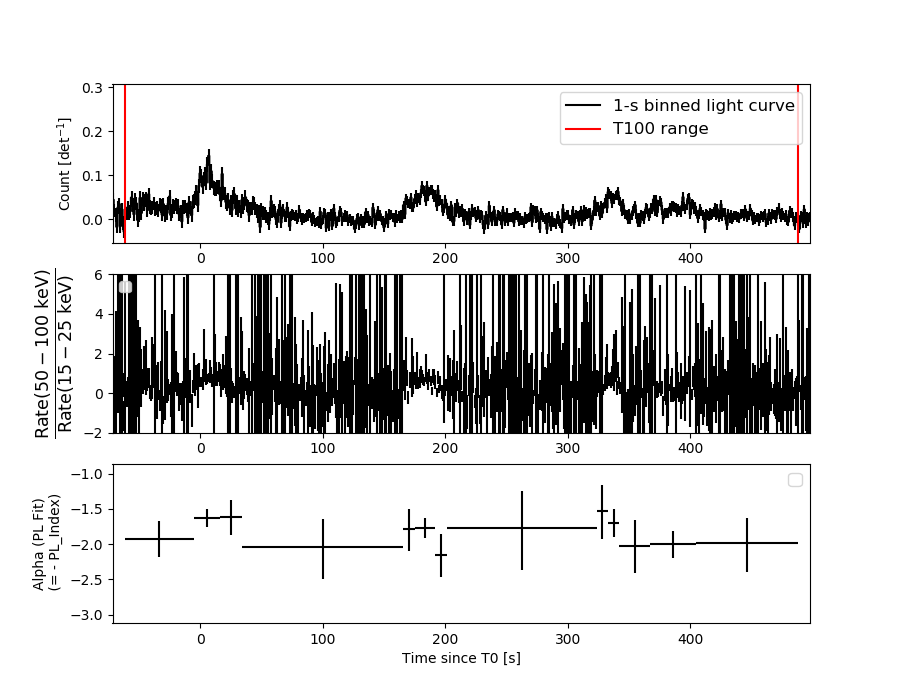
Light Curves
Note: The mask-weighted lightcurves have units of either count/det or counts/sec/det, where a det is 0.4 x 0.4 = 0.16 sq cm.
Full-time range; 1 s binning
Other quick-look light curves:
Spectra
Notes:
- 1) The fitting includes the systematic errors.
- 2) When the burst includes telescope slew time periods, the fitting uses an average response file made from multiple 5-s response files through out the slew time plus single time preiod for the non-slew times, and weighted by the total counts in the corresponding time period using addrmf. An average response file is needed becuase a spectral fit using the pre-slew DRM will introduce some errors in both a spectral shape and a normalization if the PHA file contains a lot of the slew/post-slew time interval.
- 3) For fits to more complicated models (e.g. a power-law over a cutoff power-law), the BAT team has decided to require a chi-square improvement of more than 6 for each extra dof.
Time averaged spectrum fit using the average DRM
Power-law model

Time interval is from  -61.548 sec. to  487.604 sec.

Spectral model in power-law:
------------------------------------------------------------
Parameters  : value       lower 90%   higher 90%
Photon index: -1.877     ( -0.09772   0.0961939 )
Norm@50keV  : 1.09229E-03    ( -6.07281e-05   6.01373e-05 )
------------------------------------------------------------
#Fit statistic : Chi-Squared =          45.77 using 59 PHA bins.
# Reduced chi-squared =         0.8029 for     57 degrees of freedom
# Null hypothesis probability =   8.569737e-01

Photon flux (15-150 keV)    in 549.2 sec: 0.155256 ( -0.007785  0.007805 ) ph/cm2/s
Energy fluence (15-150 keV)             : 5.51556e-06 ( -3.04087e-07  3.06685e-07 ) ergs/cm2
Cutoff power-law model
Time interval is from  -61.548 sec. to  487.604 sec.
Spectral model in the cutoff power-law:
------------------------------------------------------------
Parameters  : value       lower 90%   higher 90%
Photon index: -1.87809     ( -0.0970581   0.0978196 )
Epeak [keV] : 9999.36      ( -9999.35 -9999.36 )
Norm@50keV  : 1.09197E-03    ( -6.06906e-05   0.000490102 )
------------------------------------------------------------
#Fit statistic : Chi-Squared =          45.77 using 59 PHA bins.
# Reduced chi-squared =         0.8173 for     56 degrees of freedom
# Null hypothesis probability =   8.336338e-01

Photon flux (15-150 keV)    in 549.2 sec: 0.155515 ( -0.008541  0.007849 ) ph/cm2/s
Energy fluence (15-150 keV)             : 5.17846e-06 ( -4.27177e-07  3.46648e-07 ) ergs/cm2
1-s peak spectrum fit
Power-law model

Time interval is from    6.016 sec. to    7.016 sec.

Spectral model in power-law:
------------------------------------------------------------
Parameters  : value       lower 90%   higher 90%
Photon index: -1.87278     ( -0.319117   0.292862 )
Norm@50keV  : 9.74355E-03    ( -0.00197756   0.00189443 )
------------------------------------------------------------
#Fit statistic : Chi-Squared =          44.89 using 59 PHA bins.
# Reduced chi-squared =         0.7876 for     57 degrees of freedom
# Null hypothesis probability =   8.774252e-01

Photon flux (15-150 keV)    in 1 sec: 1.38250 ( -0.22457  0.22461 ) ph/cm2/s
Energy fluence (15-150 keV)             : 8.9588e-08 ( -1.75552e-08  1.79669e-08 ) ergs/cm2
Cutoff power-law model
Time interval is from    6.016 sec. to    7.016 sec.
Spectral model in the cutoff power-law:
------------------------------------------------------------
Parameters  : value       lower 90%   higher 90%
Photon index: -1.87513     ( -0.318816   0.29643 )
Epeak [keV] : 9999.33      (   )
Norm@50keV  : 9.73387E-03    (     )
------------------------------------------------------------
#Fit statistic : Chi-Squared =          44.89 using 59 PHA bins.
# Reduced chi-squared =         0.8017 for     56 degrees of freedom
# Null hypothesis probability =   8.563413e-01

Photon flux (15-150 keV)    in 1 sec: 1.38332 ( -0.22771  0.2243 ) ph/cm2/s
Energy fluence (15-150 keV)             : 8.97594e-08 ( -1.95314e-08  1.50451e-08 ) ergs/cm2
Time-resolved spectra
Distribution
T90 vs. Hardness ratio plot
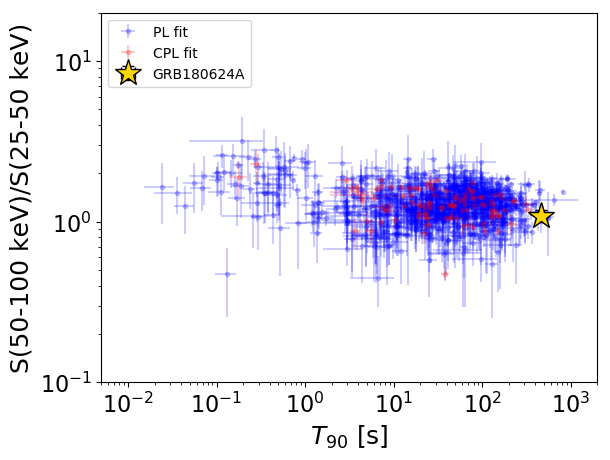
T90                                   = 466.652 sec.
Hardness ratio (energy fluence ratio) = 1.08905572544
S(15-50 keV) vs. S(50-150 keV) plot
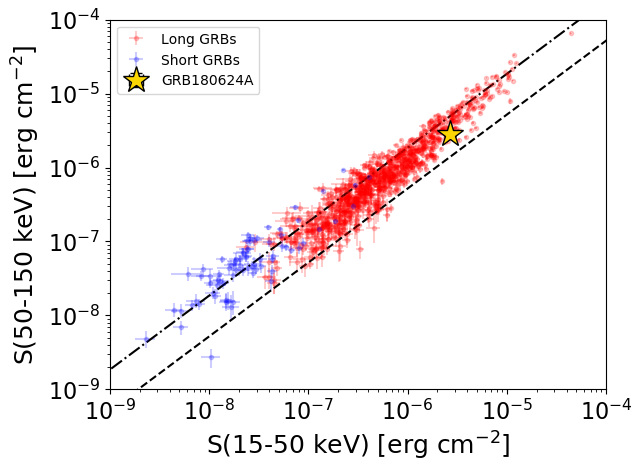
S(15-50 keV)  = 2.689054e-06
S(50-150 keV) = 2.826563e-06
The dash-dotted line and the dashed line traces the fluences calculated from the Band function with Epeak = 15 and 150 keV, respectively. Both lines assume a canonical values of alpha = -1 and beta = -2.5.
Mask shadow pattern
IMX = -3.068594089460298E-01, IMY = -4.511997142804530E-01
Spacecraft aspect plot
Bright source in the pre-burst/pre-slew/post-slew images
Pre-burst image of 15-350 keV band
Time interval of the image:
-330.635400 -315.316000
-239.536000 -61.548000

# RAcent  DECcent POSerr Theta    Phi  PeakCts   SNR AngSep     Name
#  [deg]    [deg]    ['] [deg]  [deg]                   [']
326.1202  38.4327    3.2  47.5 -172.1  -1.3659  -3.7    7.1	Cyg X-2
341.4981 -46.9783    2.1  42.1   35.0   1.9051   5.5 ------	UNKNOWN
320.3752  47.8340    2.4  57.7 -170.8   5.2113   4.9 ------	UNKNOWN
 35.2136 -37.9701    2.3  55.0  -16.4   2.7588   5.1 ------	UNKNOWN
Pre-slew background subtracted image of 15-350 keV band
Time interval of the image:
-61.548000 49.764620

# RAcent  DECcent POSerr Theta    Phi  PeakCts   SNR AngSep     Name
#  [deg]    [deg]    ['] [deg]  [deg]                   [']
326.2396  38.3639    8.7  47.4 -172.0   0.3967   1.3    4.1	Cyg X-2
318.0955  -2.3555    0.6  28.6  124.2   4.4663  20.7 ------	UNKNOWN
352.4649   7.8361    2.3  14.2 -126.0   0.7094   5.1 ------	UNKNOWN
 34.7022 -26.5013    1.9  50.5  -29.7   2.2985   6.1 ------	UNKNOWN
Post-slew image of 15-350 keV band
Time interval of the image:
98.964600 656.364590

# RAcent  DECcent POSerr Theta    Phi  PeakCts   SNR AngSep     Name
#  [deg]    [deg]    ['] [deg]  [deg]                   [']
285.0332 -24.8705   14.7  39.0   81.8  -1.3918  -0.8    3.0	HT1900.1-2455
288.8012  10.9171    2.0  32.0  145.0   4.0525   5.9    1.7	GRS 1915+105
299.5930  35.2152    1.8  41.4 -173.1   4.6990   6.4    0.8	Cyg X-1
308.0629  40.9696    2.7  44.3 -160.9   3.6564   4.2    2.4	Cyg X-3
326.2184  38.3489    6.1  41.4 -140.4  -1.5994  -1.9    2.7	Cyg X-2
275.0811   7.1951    2.0  44.0  132.9  10.8427   5.8 ------	UNKNOWN
285.4550   0.6479    2.2  32.8  124.8   3.9372   5.3 ------	UNKNOWN
318.0850  -2.3520    0.9   0.0   59.7   5.5505  12.9 ------	UNKNOWN
  2.0139 -39.1319    3.9  54.3  -11.5   4.0324   3.0 ------	UNKNOWN
  0.0619 -37.2831    4.8  52.0  -12.5   2.7427   2.4 ------	UNKNOWN
358.5598 -28.1833    2.4  46.4  -22.1   3.9917   4.8 ------	UNKNOWN
338.9659  41.8049    2.4  48.0 -129.1  11.7840   4.8 ------	UNKNOWN
336.3897  44.6758    2.9  49.8 -133.0   9.5286   3.9 ------	UNKNOWN