Analysis Summary
Notes:
- 1) No attempt has been made to eliminate the non-significant decimal places.
- 2) This batgrbproduct analysis is done using the HEASARC data.
- 3) This batgrbproduct analysis is using the flight position for the mask-weighting calculation.
======================================================================
BAT GRB EVENT DATA PROCESSING REPORT
Process Script Ver: batgrbproduct v2.46
Process Start Time: Mon Aug 6 18:48:18 EDT 2018
Host Name: bat1
Current Working Dir: /local/data/bat1/alien/Swift_3rdBATcatalog/event/batevent_reproc/trigger844615
======================================================================
Trigger: 00844615 Segment: 000
BAT Trigger Time: 551694098.112 [s; MET]
Trigger Stop: 551694099.136 [s; MET]
UTC: 2018-06-26T08:21:16.945520 [includes UTCF correction]
Where From?: TDRSS position message
BAT
RA: 243.567509280255 Dec: 14.7644605261108 [deg; J2000]
Catalogged Source?: NO
Point Source?: YES
GRB Indicated?: YES [ by BAT flight software ]
Image S/N Ratio: 11.71
Image Trigger?: NO
Rate S/N Ratio: 15.9687194226713 [ if not an image trigger ]
Image S/N Ratio: 11.71
Analysis Position: [ source = BAT ]
RA: 243.567509280255 Dec: 14.7644605261108 [deg; J2000]
Refined Position: [ source = BAT pre-slew burst ]
RA: 243.569906251372 Dec: 14.7594853400366 [deg; J2000]
{ 16h 14m 16.8s , +14d 45' 34.1" }
+/- 0.779561612786586 [arcmin] (estimated 90% radius based on SNR)
+/- 0.237169039119451 [arcmin] (formal 1-sigma fit error)
SNR: 43.4127946212395
Angular difference between the analysis and refined position is 0.329317 arcmin
Partial Coding Fraction: 0.3554688 [ including projection effects ]
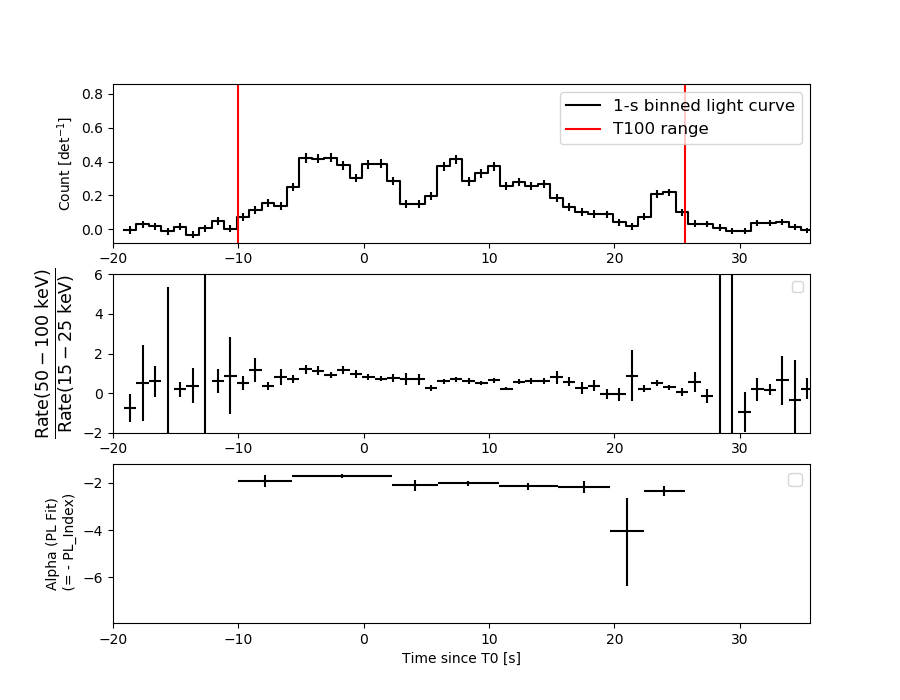
Duration
T90: 30.1039998531342 +/- 1.41138792155805
Measured from: -6.67999994754791
to: 23.4239999055862 [s; relative to TRIGTIME]
T50: 13.6999999284744 +/- 0.758609192122054
Measured from: -1.95200002193451
to: 11.7479999065399 [s; relative to TRIGTIME]
Fluence
Peak Flux (peak 1 second)
Measured from: -3.69200003147125
to: -2.69200003147125 [s; relative to TRIGTIME]
Total Fluence
Measured from: -10.0080000162125
to: 25.5880000591278 [s; relative to TRIGTIME]
Band 1 Band 2 Band 3 Band 4
15-25 25-50 50-100 100-350 keV
Total 2.813452 3.351926 1.819315 0.326475
0.082892 0.081816 0.068545 0.053942 [error]
Peak 0.118221 0.202063 0.122457 0.024401
0.014863 0.015864 0.014020 0.009825 [error]
[ fluence units of on-axis counts / fully illuminated detector ]
======================================================================
====== Table of the duration information =============================
Value tstart tstop
T100 35.596 -10.008 25.588
T90 30.104 -6.680 23.424
T50 13.700 -1.952 11.748
Peak 1.000 -3.692 -2.692
====== Spectral Analysis Summary =====================================
Model : spectral model: simple power-law (PL) and cutoff power-law (CPL)
Ph_index : photon index: E^{Ph_index}
Ph_90err : 90% error of the photon index
Epeak : Epeak in keV
Epeak_90err: 90% error of Epeak
Norm : normalization at 50 keV in both the PL model and CPL model
Nomr_90err : 90% error of the normalization
chi2 : Chi-Squared
dof : degree of freedo
=== Time-averaged spectral analysis ===
(Best model with acceptable fit: PL)
Model Ph_index Ph_90err_low Ph_90err_hi Epeak Epeak_90err_low Epeak_90err_hi Norm Nomr_90err_low Norm_90err_hi chi2 dof
PL -2.006 -0.064 0.064 - - - 1.48e-02 -5.23e-04 5.21e-04 46.020 57
CPL -1.657 -0.259 0.276 47.895 -14.059 13.117 2.23e-02 -5.68e-03 8.31e-03 40.620 56
=== 1-s peak spectral analysis ===
(Best model with acceptable fit: PL)
Model Ph_index Ph_90err_low Ph_90err_hi Epeak Epeak_90err_low Epeak_90err_hi Norm Nomr_90err_low Norm_90err_hi chi2 dof
PL -1.736 -0.159 0.154 - - - 3.03e-02 -3.18e-03 3.15e-03 59.990 57
CPL -0.051 -0.835 1.033 55.856 -7.262 12.150 2.27e-01 -1.41e-01 5.43e-01 45.990 56
=== Fluence/Peak Flux Summary ===
Model Band1 Band2 Band3 Band4 Band5 Total
15-25 25-50 50-100 100-350 15-150 15-350 keV
Fluence PL 1.09e-06 1.47e-06 1.46e-06 2.63e-06 4.87e-06 6.64e-06 erg/cm2
90%_error_low -6.25e-08 -5.03e-08 -6.98e-08 -2.59e-07 -1.66e-07 -3.18e-07 erg/cm2
90%_error_hi 6.38e-08 5.03e-08 6.98e-08 2.77e-07 1.66e-07 3.29e-07 erg/cm2
Peak flux PL 1.57e+00 1.37e+00 8.23e-01 7.45e-01 4.08e+00 4.50e+00 ph/cm2/s
90%_error_low -2.31e-01 -1.38e-01 -1.07e-01 -1.71e-01 -4.09e-01 -4.43e-01 ph/cm2/s
90%_error_hi 2.40e-01 1.38e-01 1.07e-01 1.97e-01 4.09e-01 4.43e-01 ph/cm2/s
Fluence CPL 1.02e-06 1.51e-06 1.48e-06 1.60e-06 4.73e-06 5.61e-06 erg/cm2
90%_error_low -7.79e-08 -5.90e-08 -7.37e-08 -4.64e-07 -1.93e-07 -5.11e-07 erg/cm2
90%_error_hi 7.93e-08 5.96e-08 7.42e-08 6.93e-07 1.92e-07 7.18e-07 erg/cm2
Peak flux CPL 1.56e+00 1.17e+00 6.11e-01 5.26e-01 3.56e+00 3.87e+00 ph/cm2/s
90%_error_low -3.03e-01 -1.76e-01 -1.20e-01 -8.74e-02 -6.02e-01 -7.54e-01 ph/cm2/s
90%_error_hi 3.04e-01 1.69e-01 1.03e-01 7.85e-02 4.86e-01 4.49e-01 ph/cm2/s
======================================================================
Image
Pre-slew 15.0-350.0 keV image (Event data)
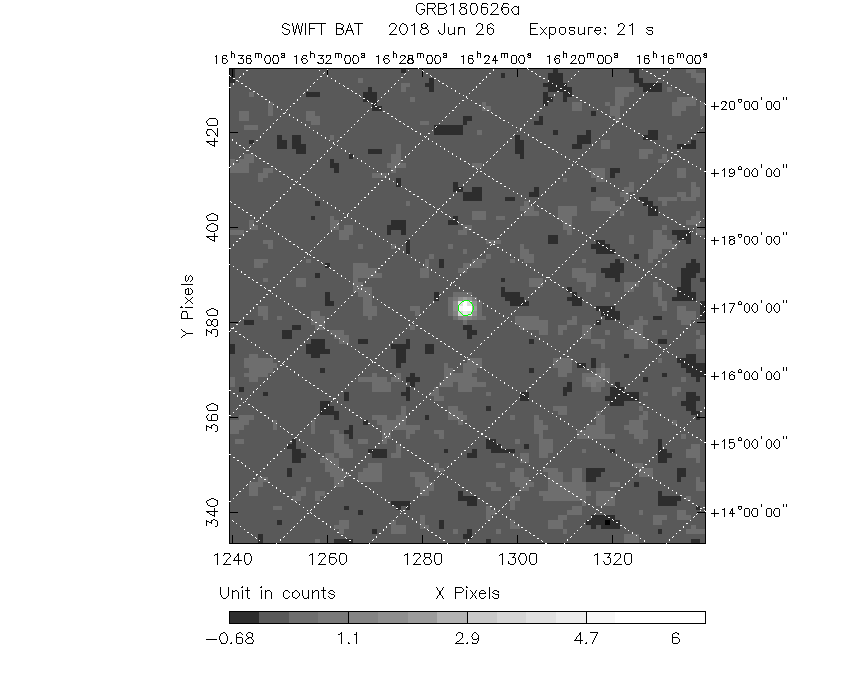
#   RAcent    DECcent   POSerr    Theta     Phi              Peak Cts       SNR   Name
  243.5699    14.7595   0.0045    41.4315   167.1325         6.6316201     43.413 TRIG_00844615

Foreground time interval of the image:
-10.008  11.389 (delta_t =  21.397 [sec])
Background time interval of the image:
-188.211 -10.008 (delta_t = 178.203 [sec])
Light Curves
Note: The mask-weighted lightcurves have units of either count/det or counts/sec/det, where a det is 0.4 x 0.4 = 0.16 sq cm.
Full-time range; 1 s binning
Other quick-look light curves:
- 64 ms binning (zoomed)
- 16 ms binning (zoomed)
- 8 ms binning (zoomed)
- 2 ms binning (zoomed)
- SN=5 or 10 s binning (full-time range)
- Raw light curve
Spectra
- 64 ms binning (zoomed)
- 16 ms binning (zoomed)
- 8 ms binning (zoomed)
- 2 ms binning (zoomed)
- SN=5 or 10 s binning (full-time range)
- Raw light curve
Spectra
Notes:
- 1) The fitting includes the systematic errors.
- 2) When the burst includes telescope slew time periods, the fitting uses an average response file made from multiple 5-s response files through out the slew time plus single time preiod for the non-slew times, and weighted by the total counts in the corresponding time period using addrmf. An average response file is needed becuase a spectral fit using the pre-slew DRM will introduce some errors in both a spectral shape and a normalization if the PHA file contains a lot of the slew/post-slew time interval.
- 3) For fits to more complicated models (e.g. a power-law over a cutoff power-law), the BAT team has decided to require a chi-square improvement of more than 6 for each extra dof.
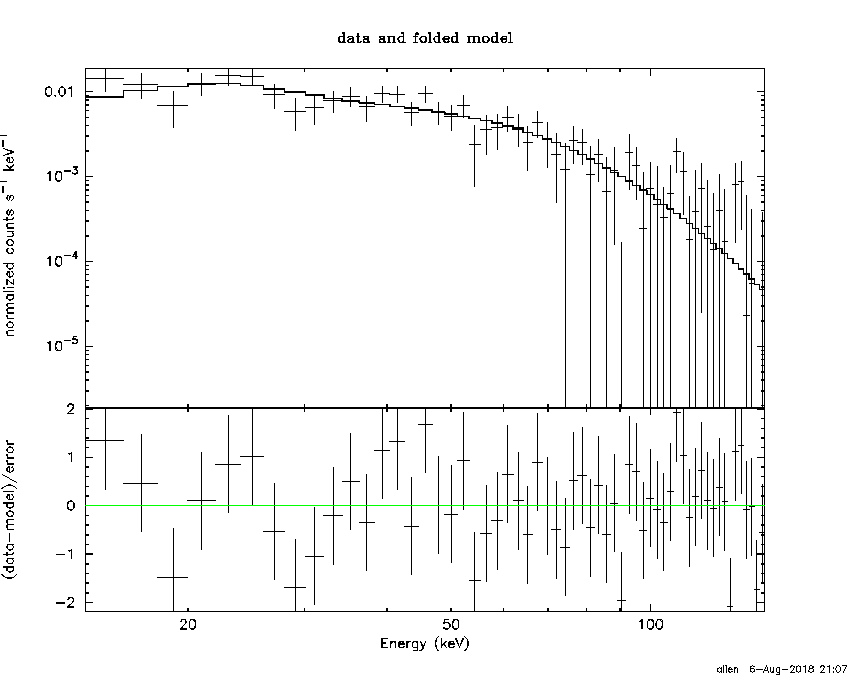
Time averaged spectrum fit using the average DRM
Power-law model
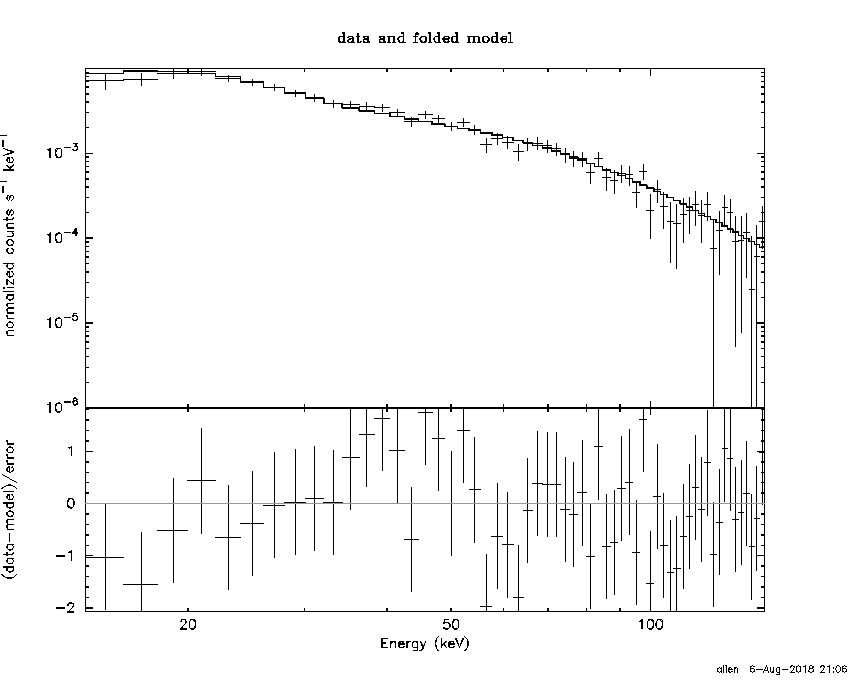
Time interval is from  -10.008 sec. to   25.588 sec.

Spectral model in power-law:
------------------------------------------------------------
Parameters  : value       lower 90%   higher 90%
Photon index: -2.00611     ( -0.0641999   0.0635331 )
Norm@50keV  : 1.48188E-02    ( -0.000522661   0.000520661 )
------------------------------------------------------------
#Fit statistic : Chi-Squared =          46.02 using 59 PHA bins.
# Reduced chi-squared =         0.8073 for     57 degrees of freedom
# Null hypothesis probability =   8.507754e-01

Photon flux (15-150 keV)    in 35.6 sec: 2.22925 ( -0.08226  0.08264 ) ph/cm2/s
Energy fluence (15-150 keV)             : 4.86745e-06 ( -1.65799e-07  1.66054e-07 ) ergs/cm2
Cutoff power-law model
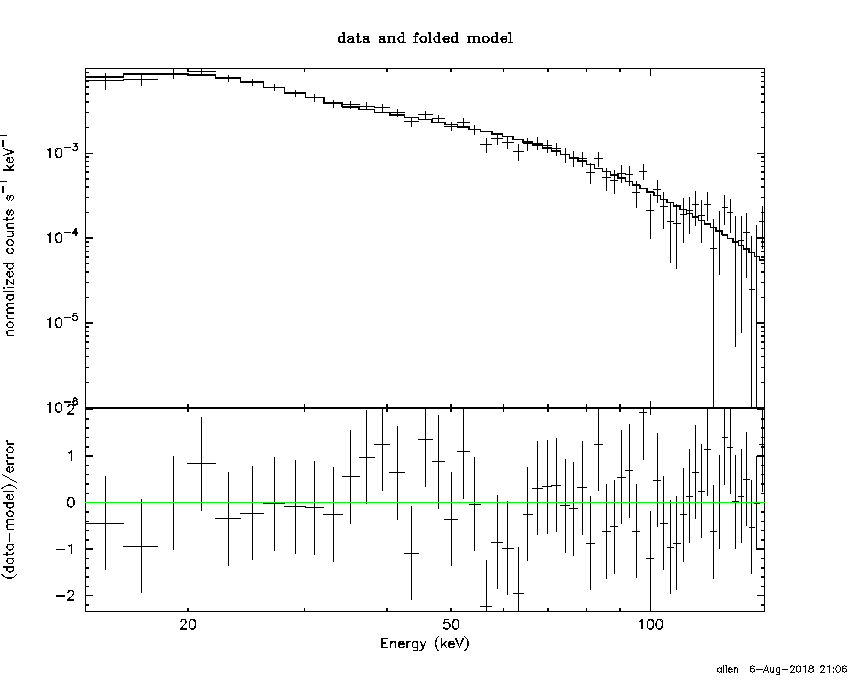
Time interval is from  -10.008 sec. to   25.588 sec.
Spectral model in the cutoff power-law:
------------------------------------------------------------
Parameters  : value       lower 90%   higher 90%
Photon index: -1.65656     ( -0.259158   0.276332 )
Epeak [keV] : 47.8950      ( -14.0589 13.1166 )
Norm@50keV  : 2.22799E-02    ( -0.00568209   0.00830965 )
------------------------------------------------------------
#Fit statistic : Chi-Squared =          40.62 using 59 PHA bins.
# Reduced chi-squared =         0.7253 for     56 degrees of freedom
# Null hypothesis probability =   9.392158e-01

Photon flux (15-150 keV)    in 35.6 sec: 2.17119 ( -0.09169  0.09215 ) ph/cm2/s
Energy fluence (15-150 keV)             : 4.73306e-06 ( -1.93117e-07  1.92441e-07 ) ergs/cm2
1-s peak spectrum fit
Power-law model
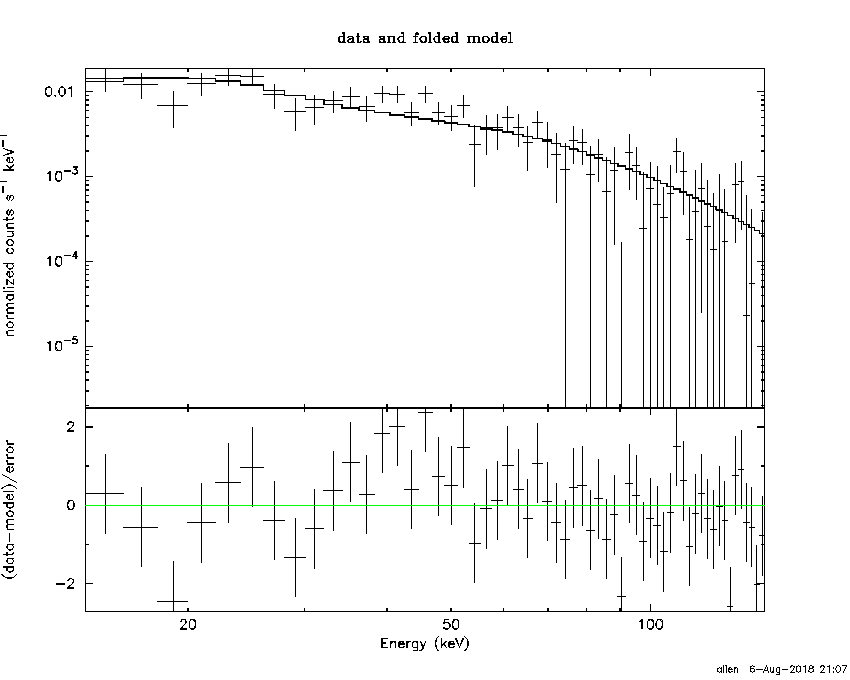
Time interval is from   -3.692 sec. to   -2.692 sec.

Spectral model in power-law:
------------------------------------------------------------
Parameters  : value       lower 90%   higher 90%
Photon index: -1.73628     ( -0.158793   0.153798 )
Norm@50keV  : 3.03140E-02    ( -0.00318023   0.00315425 )
------------------------------------------------------------
#Fit statistic : Chi-Squared =          59.99 using 59 PHA bins.
# Reduced chi-squared =          1.053 for     57 degrees of freedom
# Null hypothesis probability =   3.677137e-01

Photon flux (15-150 keV)    in 1 sec: 4.07858 ( -0.40854  0.40913 ) ph/cm2/s
Energy fluence (15-150 keV)             : 2.79995e-07 ( -3.01791e-08  3.03823e-08 ) ergs/cm2
Cutoff power-law model
Time interval is from   -3.692 sec. to   -2.692 sec.
Spectral model in the cutoff power-law:
------------------------------------------------------------
Parameters  : value       lower 90%   higher 90%
Photon index: -0.0507957     ( -0.834946   1.03314 )
Epeak [keV] : 55.8559      ( -7.26215 12.1504 )
Norm@50keV  : 0.226653    ( -0.14147   0.543149 )
------------------------------------------------------------
#Fit statistic : Chi-Squared =          45.99 using 59 PHA bins.
# Reduced chi-squared =         0.8213 for     56 degrees of freedom
# Null hypothesis probability =   8.275885e-01

Photon flux (15-150 keV)    in 1 sec: 3.56341 ( -0.60159  0.48567 ) ph/cm2/s
Energy fluence (15-150 keV)             : 2.59406e-07 ( -3.12247e-08  3.19608e-08 ) ergs/cm2
Time-resolved spectra
Distribution
T90 vs. Hardness ratio plot
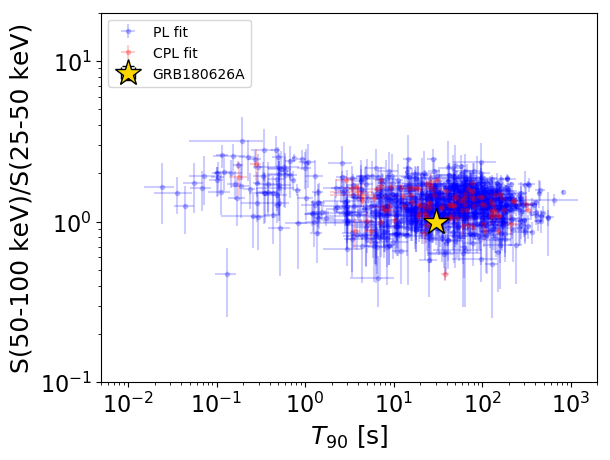
T90                                   = 30.104 sec.
Hardness ratio (energy fluence ratio) = 0.995818259857
S(15-50 keV) vs. S(50-150 keV) plot
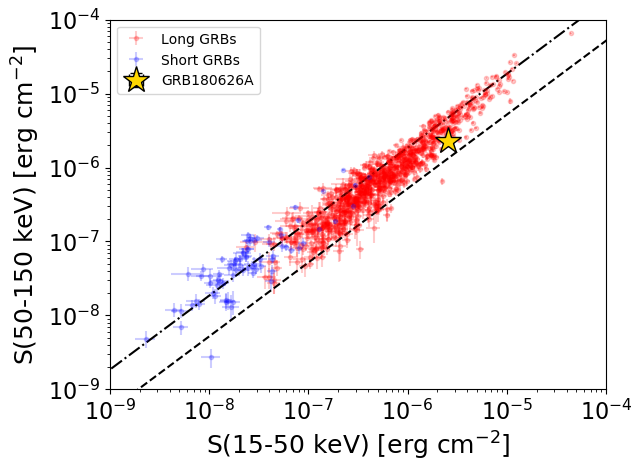
S(15-50 keV)  = 2.553635e-06
S(50-150 keV) = 2.31381e-06
The dash-dotted line and the dashed line traces the fluences calculated from the Band function with Epeak = 15 and 150 keV, respectively. Both lines assume a canonical values of alpha = -1 and beta = -2.5.
Mask shadow pattern
IMX = -8.604306448548975E-01, IMY = -1.965517898628813E-01
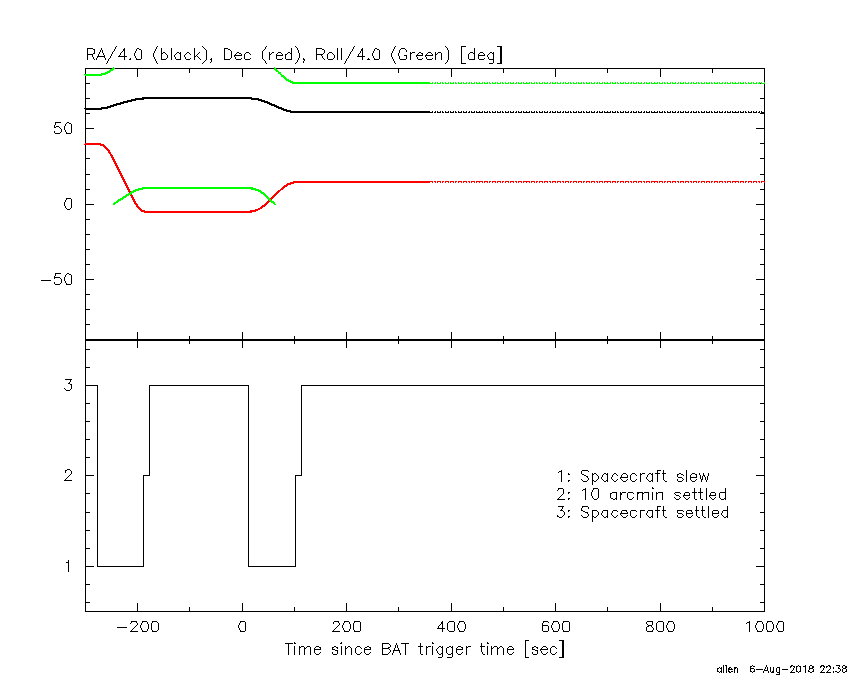
Spacecraft aspect plot
Bright source in the pre-burst/pre-slew/post-slew images
Pre-burst image of 15-350 keV band
Time interval of the image:
-188.211400 -10.008000

# RAcent  DECcent POSerr Theta    Phi  PeakCts   SNR AngSep     Name
#  [deg]    [deg]    ['] [deg]  [deg]                   [']
244.9716 -15.6403    0.6  36.3  118.3   8.8753  18.2    0.5	Sco X-1
254.4733  35.3926    6.3  47.1 -160.9  -0.8097  -1.8    3.1	Her X-1
256.0361 -37.6722   22.9  39.5   78.9   0.4559   0.5   10.6	4U 1700-377
256.3891 -36.4307   12.0  38.4   79.9  -0.7484  -1.0    2.3	GX 349+2
263.1653 -24.7466   10.7  25.8   86.2   0.3122   1.1    8.5	GX 1+4
268.3573  -1.2413    0.0  12.5  155.0   0.2924   1.4   12.7	SW J1753.5-0127
270.3080 -25.0542    2.6  22.3   72.7   1.1375   4.5    2.0	GX 5-1
270.2362 -25.6943    4.8  22.9   72.1   0.6493   2.4    4.6	GRS 1758-258
274.1251 -14.0274    6.1  10.9   81.7   0.4088   1.9    7.0	GX 17+2
275.8445 -30.4994    4.2  25.9   57.0   0.8159   2.8    9.0	H1820-303
285.0169 -24.7217    0.0  20.3   35.8  -0.4018  -1.8   12.0	HT1900.1-2455
288.8238  10.9430    1.5  18.0 -103.9   1.7614   7.4    1.5	GRS 1915+105
263.0811 -33.9369    8.1  33.1   74.9   0.6219   1.4    7.7	GX 354-0
294.6157 -53.7235    2.6  50.1   37.2   5.0805   4.4 ------	UNKNOWN
310.8817 -48.5769    2.4  50.8   22.4   3.7250   4.9 ------	UNKNOWN
247.4534   3.7002    2.2  34.0  152.3   1.8575   5.3 ------	UNKNOWN
275.0945   7.1843    0.3  13.2 -155.2   9.4461  44.6 ------	UNKNOWN
281.3523  43.5840    2.7  48.5 -130.9   4.7956   4.3 ------	UNKNOWN
Pre-slew background subtracted image of 15-350 keV band
Time interval of the image:
-10.008000 11.388600

# RAcent  DECcent POSerr Theta    Phi  PeakCts   SNR AngSep     Name
#  [deg]    [deg]    ['] [deg]  [deg]                   [']
245.1093 -15.6939   11.6  36.2  118.2   0.1916   1.0    8.2	Sco X-1
254.5167  35.1968    6.4  46.9 -161.0  -0.2978  -1.8    9.2	Her X-1
255.7344 -37.8428    0.0  39.8   79.0   0.5875   1.9   11.9	4U 1700-377
256.6406 -36.4486   14.4  38.3   79.6   0.2006   0.8   10.0	GX 349+2
263.0786 -24.5951    6.3  25.7   86.6   0.1873   1.8    9.8	GX 1+4
268.2710  -1.5634    5.8  12.5  153.5   0.1472   2.0    8.8	SW J1753.5-0127
270.2898 -24.8792    0.0  22.1   73.0   0.0486   0.5   12.0	GX 5-1
270.2993 -25.9393    6.7  23.1   71.7   0.1634   1.7   11.8	GRS 1758-258
274.0439 -13.8663    5.0  10.9   82.5  -0.1843  -2.3   10.4	GX 17+2
276.0852 -30.4278    7.1  25.8   56.6   0.1690   1.6    9.1	H1820-303
285.2694 -24.9063    0.0  20.5   35.3  -0.1723  -2.1   12.7	HT1900.1-2455
288.6255  10.9651   10.5  17.9 -104.5   0.0957   1.1   10.3	GRS 1915+105
262.8160 -33.7881    8.8  33.1   75.4   0.2017   1.3    9.1	GX 354-0
243.5699  14.7595    0.3  41.4  167.1   6.6316  43.4 ------	UNKNOWN
253.2692  22.1060    2.6  37.9 -175.2   0.4832   4.4 ------	UNKNOWN
290.5766  26.7785    2.5  33.2 -115.0   0.4952   4.5 ------	UNKNOWN
294.1308  33.7241    2.2  40.8 -114.2   1.0296   5.3 ------	UNKNOWN
Post-slew image of 15-350 keV band
Time interval of the image:
102.388600 962.958000

# RAcent  DECcent POSerr Theta    Phi  PeakCts   SNR AngSep     Name
#  [deg]    [deg]    ['] [deg]  [deg]                   [']
244.9906 -15.6440    0.4  30.5  127.1  34.6579  25.9    0.7	Sco X-1
254.5749  35.3738    6.3  22.8  -26.7   1.5406   1.8    6.0	Her X-1
268.3125  -1.6069    9.4  29.4   71.5   1.5797   1.2    9.8	SW J1753.5-0127
288.7322  10.9972    4.8  44.1   39.1   5.0388   2.4    5.0	GRS 1915+105
299.6121  35.3018    3.6  53.9    6.5   8.3159   3.2    6.1	Cyg X-1
275.0904   7.1856    0.3  31.8   50.1  46.0372  33.4 ------	UNKNOWN
278.8734  12.4769    2.3  34.3   39.1   6.8818   5.0 ------	UNKNOWN
289.0144  20.2850    2.2  43.5   25.6   8.7449   5.3 ------	UNKNOWN
290.4878  35.5219    2.5  46.7    4.5   7.1696   4.6 ------	UNKNOWN
225.3756  -3.2039    2.5  25.5  176.2   3.9697   4.7 ------	UNKNOWN
209.9769 -15.9771    2.7  45.3  178.2   7.0292   4.3 ------	UNKNOWN
190.4013  -5.3471    4.2  56.4 -157.2  16.5317   2.8 ------	UNKNOWN
191.9875  14.9508    3.8  49.8 -133.1  18.2969   3.0 ------	UNKNOWN