Analysis Summary
Notes:
- 1) No attempt has been made to eliminate the non-significant decimal places.
- 2) This batgrbproduct analysis is done using the HEASARC data.
- 3) This batgrbproduct analysis is using the flight position for the mask-weighting calculation.
======================================================================
                  BAT GRB EVENT DATA PROCESSING REPORT
    Process Script Ver: batgrbproduct v2.46
    Process Start Time: Mon Aug  6 18:43:57 EDT 2018
             Host Name: bat1
   Current Working Dir: /local/data/bat1/alien/Swift_3rdBATcatalog/event/batevent_reproc/trigger845443
======================================================================

  Trigger: 00845443      Segment: 000

  BAT Trigger Time: 552049932.992   [s; MET]
      Trigger Stop: 552049934.016   [s; MET]
               UTC: 2018-06-30T11:11:51.803800    [includes UTCF correction]
       Where From?: TDRSS position message

  BAT
    RA: 48.8102458660383   Dec: -87.4820175920548  [deg; J2000]

     Catalogged Source?: NO
     Point Source?:      YES
     GRB Indicated?:     YES    [ by BAT flight software ]
     Image S/N Ratio:    7.75
     Image Trigger?:     NO
     Rate S/N Ratio:     11.5325625946708  [ if not an image trigger ]
     Image S/N Ratio:    7.75

  Analysis Position:   [ source = BAT ]
    RA: 48.8102458660383   Dec: -87.4820175920548  [deg; J2000]

  Refined Position:   [ source = BAT pre-slew burst ]
    RA: 48.8950051312293   Dec: -87.4763190297174  [deg; J2000]
        { 03h 15m 34.8s , -87d 28' 34.7" }
         +/- 0.832275135976513 [arcmin] (estimated 90% radius based on SNR)
         +/- 0.275560673586536 [arcmin] (formal 1-sigma fit error)
    SNR: 39.5387358224932

  Angular difference between the analysis and refined position is 0.408578 arcmin

  Partial Coding Fraction: 0.59375    [ including projection effects ]

  Duration
     T90: 18.9599999189377 +/- 6.31456244704634
        Measured from: 1.4760000705719
                   to: 20.4359999895096     [s; relative to TRIGTIME]
     T50: 3.23199987411499 +/- 0.616077994623238
        Measured from: 3.58800005912781
                   to: 6.8199999332428     [s; relative to TRIGTIME]


  Fluence
     Peak Flux  (peak 1 second)
        Measured from: 3.64800000190735
                   to: 4.64800000190735     [s; relative to TRIGTIME]
     Total Fluence
        Measured from: -0.355999946594238
                   to: 30.0240000486374     [s; relative to TRIGTIME]

             Band 1     Band 2     Band 3     Band 4
              15-25      25-50     50-100    100-350     keV
 Total     1.209199   1.192761   0.639399   0.113584
           0.049089   0.049016   0.041018   0.034206 [error]
 Peak      0.267200   0.268470   0.145049   0.028724
           0.012747   0.013071   0.010362   0.007576 [error]

     [ fluence units of on-axis counts / fully illuminated detector ]

======================================================================


====== Table of the duration information =============================

        Value   tstart    tstop
T100   30.380   -0.356   30.024
T90    18.960    1.476   20.436
T50     3.232    3.588    6.820
Peak    1.000    3.648    4.648


====== Spectral Analysis Summary =====================================

Model      : spectral model: simple power-law (PL) and cutoff power-law (CPL)
Ph_index   : photon index: E^{Ph_index}
Ph_90err   : 90% error of the photon index
Epeak      : Epeak in keV
Epeak_90err: 90% error of Epeak
Norm       : normalization at 50 keV in both the PL model and CPL model
Nomr_90err : 90% error of the normalization
chi2       : Chi-Squared
dof        : degree of freedo

=== Time-averaged spectral analysis ===
(Best model with acceptable fit: PL)

Model Ph_index Ph_90err_low Ph_90err_hi  Epeak  Epeak_90err_low  Epeak_90err_hi  Norm       Nomr_90err_low    Norm_90err_hi    chi2    dof
PL      -2.061    -0.099      0.097       -           -               -         6.23e-03     -3.64e-04          3.60e-04      34.420   57
CPL     -2.057    -0.136      0.626     9999.360    -9992.955      -9999.360      6.25e-03     -8.45e-04          7.31e-03      34.430   56


=== 1-s peak spectral analysis ===
(Best model with acceptable fit: PL)

Model Ph_index Ph_90err_low Ph_90err_hi  Epeak  Epeak_90err_low  Epeak_90err_hi  Norm       Nomr_90err_low    Norm_90err_hi    chi2    dof
PL      -2.020     -0.109     0.107       -           -               -         4.31e-02     -2.79e-03          2.76e-03      47.970   57
CPL     -2.070     -0.177     0.387       63.938      N/A           N/A         4.05e-02        N/A               N/A         47.910   56


=== Fluence/Peak Flux Summary ===

              Model    Band1     Band2     Band3     Band4     Band5     Total
                       15-25     25-50    50-100    100-350    15-150    15-350    keV
Fluence         PL   4.10e-07  5.37e-07  5.14e-07  8.76e-07  1.75e-06  2.34e-06   erg/cm2
      90%_error_low -3.24e-08 -2.66e-08 -4.15e-08 -1.38e-07 -9.49e-08 -1.79e-07   erg/cm2
      90%_error_hi   3.32e-08  2.66e-08  4.17e-08  1.54e-07  9.55e-08  1.91e-07   erg/cm2
Peak flux       PL   2.93e+00  2.17e+00  1.07e+00  7.51e-01  6.53e+00  6.92e+00   ph/cm2/s
      90%_error_low -2.66e-01 -1.23e-01 -9.17e-02 -1.21e-01 -3.84e-01 -3.89e-01   ph/cm2/s
      90%_error_hi   2.72e-01  1.23e-01  9.16e-02  1.34e-01  3.85e-01  3.90e-01   ph/cm2/s

Fluence        CPL    N/A      N/A      N/A      N/A      N/A      N/A      erg/cm2
      90%_error_low -3.24e-08 -2.66e-08 -4.15e-08 -1.38e-07 -9.49e-08 -1.79e-07   erg/cm2
      90%_error_hi   3.32e-08  2.66e-08  4.17e-08  1.54e-07  9.55e-08  1.91e-07   erg/cm2
Peak flux      CPL   2.91e+00  2.16e+00  1.07e+00  7.72e-01  6.48e+00  6.90e+00   ph/cm2/s
      90%_error_low -2.37e-01     N/A   -3.28e-01 -1.09e-01 -3.36e-01 -3.87e-01   ph/cm2/s
      90%_error_hi   2.28e-01     N/A    9.27e-02  1.89e-01  4.08e-01  3.94e-01   ph/cm2/s

======================================================================
Image
Pre-slew 15.0-350.0 keV image (Event data)
#   RAcent    DECcent   POSerr    Theta     Phi              Peak Cts       SNR   Name
   48.8950   -87.4763   0.0048    35.3427  -147.1642         2.9822395     39.539 TRIG_00845443

Foreground time interval of the image:
 -0.356  11.909 (delta_t =  12.265 [sec])
Background time interval of the image:
-90.891  -0.356 (delta_t =  90.535 [sec])
Light Curves
Note: The mask-weighted lightcurves have units of either count/det or counts/sec/det, where a det is 0.4 x 0.4 = 0.16 sq cm.
Full-time range; 1 s binning
Other quick-look light curves:
- 64 ms binning (zoomed)
- 16 ms binning (zoomed)
- 8 ms binning (zoomed)
- 2 ms binning (zoomed)
- SN=5 or 10 s binning (full-time range)
- Raw light curve
Spectra
- 64 ms binning (zoomed)
- 16 ms binning (zoomed)
- 8 ms binning (zoomed)
- 2 ms binning (zoomed)
- SN=5 or 10 s binning (full-time range)
- Raw light curve
Spectra
Notes:
- 1) The fitting includes the systematic errors.
- 2) When the burst includes telescope slew time periods, the fitting uses an average response file made from multiple 5-s response files through out the slew time plus single time preiod for the non-slew times, and weighted by the total counts in the corresponding time period using addrmf. An average response file is needed becuase a spectral fit using the pre-slew DRM will introduce some errors in both a spectral shape and a normalization if the PHA file contains a lot of the slew/post-slew time interval.
- 3) For fits to more complicated models (e.g. a power-law over a cutoff power-law), the BAT team has decided to require a chi-square improvement of more than 6 for each extra dof.
Time averaged spectrum fit using the average DRM
Power-law model
Time interval is from   -0.356 sec. to   30.024 sec.

Spectral model in power-law:
------------------------------------------------------------
Parameters  : value       lower 90%   higher 90%
Photon index: -2.06118     ( -0.0993133   0.0972639 )
Norm@50keV  : 6.22797E-03    ( -0.000363508   0.000359704 )
------------------------------------------------------------
#Fit statistic : Chi-Squared =          34.42 using 59 PHA bins.
# Reduced chi-squared =         0.6038 for     57 degrees of freedom
# Null hypothesis probability =   9.922386e-01

Photon flux (15-150 keV)    in 30.38 sec: 0.961543 ( -0.050186  0.050317 ) ph/cm2/s
Energy fluence (15-150 keV)             : 1.75222e-06 ( -9.49281e-08  9.55117e-08 ) ergs/cm2
Cutoff power-law model
Time interval is from   -0.356 sec. to   30.024 sec.
Spectral model in the cutoff power-law:
------------------------------------------------------------
Parameters  : value       lower 90%   higher 90%
Photon index: -1.82823     ( -0.363964   0.397392 )
Epeak [keV] : 33.1976      ( -26.7939 -33.1986 )
Norm@50keV  : 8.32941E-03    ( -0.00292662   0.00522728 )
------------------------------------------------------------
#Fit statistic : Chi-Squared =          33.23 using 59 PHA bins.
# Reduced chi-squared =         0.5935 for     56 degrees of freedom
# Null hypothesis probability =   9.933358e-01

Photon flux (15-150 keV)    in 30.38 sec: 0.948026 ( -0.054283  0.054334 ) ph/cm2/s
Energy fluence (15-150 keV)             : 0 ( 0  0 ) ergs/cm2
1-s peak spectrum fit
Power-law model

Time interval is from    3.648 sec. to    4.648 sec.

Spectral model in power-law:
------------------------------------------------------------
Parameters  : value       lower 90%   higher 90%
Photon index: -2.02022     ( -0.109084   0.10698 )
Norm@50keV  : 4.30985E-02    ( -0.00278906   0.00275684 )
------------------------------------------------------------
#Fit statistic : Chi-Squared =          47.97 using 59 PHA bins.
# Reduced chi-squared =         0.8415 for     57 degrees of freedom
# Null hypothesis probability =   7.973042e-01

Photon flux (15-150 keV)    in 1 sec: 6.52614 ( -0.38361  0.38478 ) ph/cm2/s
Energy fluence (15-150 keV)             : 3.97979e-07 ( -2.43075e-08  2.44464e-08 ) ergs/cm2
Cutoff power-law model
Time interval is from    3.648 sec. to    4.648 sec.
Spectral model in the cutoff power-law:
------------------------------------------------------------
Parameters  : value       lower 90%   higher 90%
Photon index: -2.06984     ( -0.176788   0.387003 )
Epeak [keV] : 63.9381      (   )
Norm@50keV  : 4.05020E-02    (     )
------------------------------------------------------------
#Fit statistic : Chi-Squared =          47.91 using 59 PHA bins.
# Reduced chi-squared =         0.8556 for     56 degrees of freedom
# Null hypothesis probability =   7.704891e-01

Photon flux (15-150 keV)    in 1 sec: 6.47945 ( -0.33621  0.40842 ) ph/cm2/s
Energy fluence (15-150 keV)             : 0 ( 0  0 ) ergs/cm2
Time-resolved spectra
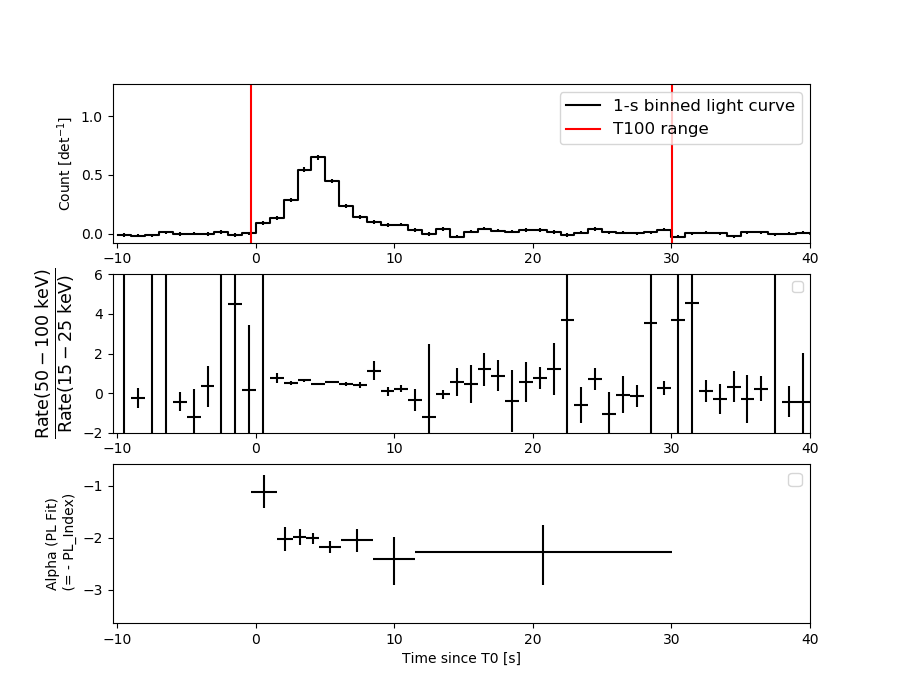
Distribution
T90 vs. Hardness ratio plot
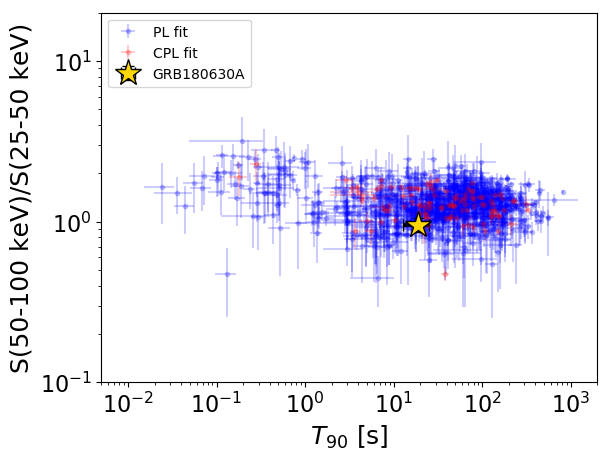
T90                                   = 18.96 sec.
Hardness ratio (energy fluence ratio) = 0.958517471639
S(15-50 keV) vs. S(50-150 keV) plot
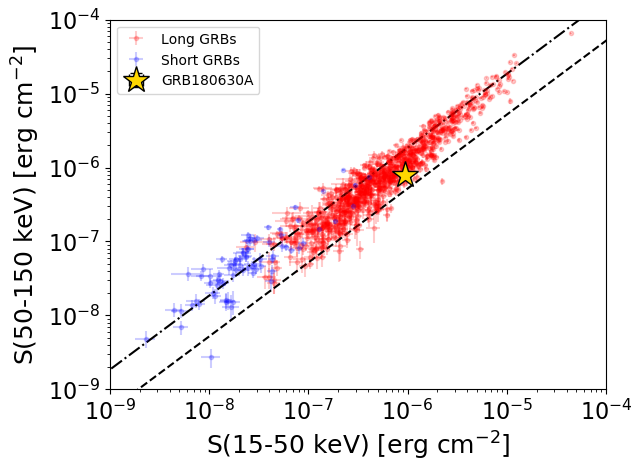
S(15-50 keV)  = 9.469553e-07
S(50-150 keV) = 8.052768e-07
The dash-dotted line and the dashed line traces the fluences calculated from the Band function with Epeak = 15 and 150 keV, respectively. Both lines assume a canonical values of alpha = -1 and beta = -2.5.
Mask shadow pattern
IMX = -5.958556712528323E-01, IMY = 3.845295785922921E-01
Spacecraft aspect plot
Bright source in the pre-burst/pre-slew/post-slew images
Pre-burst image of 15-350 keV band
Time interval of the image:
-90.891410 -0.356000

# RAcent  DECcent POSerr Theta    Phi  PeakCts   SNR AngSep     Name
#  [deg]    [deg]    ['] [deg]  [deg]                   [']
170.0592 -60.5354    5.9  31.8  -90.0  -0.4141  -1.9    9.2	Cen X-3
186.6442 -62.7772    0.9  23.7  -90.1   1.9345  12.5    0.5	GX 301-2
244.9793 -15.6130    1.6  42.4   49.3   2.5780   7.1    1.6	Sco X-1
255.9852 -37.8307   16.5  24.2   79.9  -0.1130  -0.7    0.8	4U 1700-377
256.4705 -36.3179    9.0  25.8   78.9   0.2233   1.3    6.5	GX 349+2
262.9466 -24.6381    6.4  38.7   78.3   0.8532   1.8    7.3	GX 1+4
264.6496 -44.5851    3.4  22.9  103.2   0.5260   3.4    9.0	4U 1735-44
276.0316 -30.2984    3.5  39.6   98.8  -1.7658  -3.2    6.9	H1820-303
263.0186 -33.9754    8.7  30.5   86.2   0.2954   1.3    8.6	GX 354-0
264.3492 -45.0900    2.8  22.4  103.8   0.6496   4.2 ------	UNKNOWN
226.5433 -26.1163    2.4  31.5   20.7   0.7216   4.7 ------	UNKNOWN
202.7210 -13.3117    3.0  49.8   -7.9   1.0202   3.9 ------	UNKNOWN
Pre-slew background subtracted image of 15-350 keV band
Time interval of the image:
-0.356000 11.908600

# RAcent  DECcent POSerr Theta    Phi  PeakCts   SNR AngSep     Name
#  [deg]    [deg]    ['] [deg]  [deg]                   [']
170.6241 -60.5473    6.7  31.6  -89.8  -0.1756  -1.7   10.2	Cen X-3
186.9270 -62.8057    9.7  23.5  -90.2  -0.0814  -1.2    7.7	GX 301-2
244.8457 -15.7062    5.7  42.3   49.2  -0.3039  -2.0    8.7	Sco X-1
255.7696 -37.8973   22.9  24.1   79.6   0.0372   0.5   10.8	4U 1700-377
256.4262 -36.2252    0.0  25.8   78.7  -0.1597  -2.0   11.9	GX 349+2
262.9747 -24.5977    5.3  38.7   78.4  -0.3765  -2.2    9.1	GX 1+4
264.7566 -44.4718   58.1  23.0  103.1   0.0122   0.2    1.4	4U 1735-44
275.7944 -30.3467 1401.0  39.5   98.6   0.0015   0.0    6.9	H1820-303
262.7550 -33.8821    0.0  30.4   85.8  -0.0098  -0.1   12.0	GX 354-0
335.5459 -59.5804    2.7  48.0  171.4   0.5497   4.2 ------	UNKNOWN
 48.8951 -87.4763    0.3  35.3 -147.2   2.9821  39.5 ------	UNKNOWN
183.3438 -17.7436    2.1  54.2  -31.6   1.1981   5.4 ------	UNKNOWN
Post-slew image of 15-350 keV band
Time interval of the image:
67.908600 962.070500

# RAcent  DECcent POSerr Theta    Phi  PeakCts   SNR AngSep     Name
#  [deg]    [deg]    ['] [deg]  [deg]                   [']
170.1913 -60.5893   16.2  30.8  -14.6  -0.5092  -0.7    4.2	Cen X-3
186.6624 -62.7779    0.3  29.1    1.3  25.4207  33.4    0.5	GX 301-2
240.3058 -48.5447    2.9  43.9   51.4   9.1254   4.0 ------	UNKNOWN
214.1833 -39.7323    2.8  52.7   26.3  12.3299   4.2 ------	UNKNOWN
344.2470 -38.7948    3.9  50.2  154.0   8.5927   2.9 ------	UNKNOWN
242.8329 -69.8123    3.3  22.6   53.0   2.7840   3.5 ------	UNKNOWN
215.2509 -62.6941    1.8  29.7   27.9   5.2878   6.4 ------	UNKNOWN
  3.4095 -31.4168    2.8  56.8  173.9  18.4340   4.1 ------	UNKNOWN
121.7731 -45.7535    2.9  43.6  -64.1  15.8178   4.0 ------	UNKNOWN
 58.9209 -39.5578    3.1  48.0 -129.1  15.5172   3.8 ------	UNKNOWN
 55.1069 -37.7590    3.1  49.8 -133.0  16.2892   3.8 ------	UNKNOWN