Analysis Summary
Notes:
- 1) No attempt has been made to eliminate the non-significant decimal places.
- 2) This batgrbproduct analysis is done using the HEASARC data.
- 3) This batgrbproduct analysis is using the flight position for the mask-weighting calculation.
======================================================================
BAT GRB EVENT DATA PROCESSING REPORT
Process Script Ver: batgrbproduct v2.46
Process Start Time: Mon Aug 6 18:35:29 EDT 2018
Host Name: bat1
Current Working Dir: /local/data/bat1/alien/Swift_3rdBATcatalog/event/batevent_reproc/trigger846395
======================================================================
Trigger: 00846395 Segment: 000
BAT Trigger Time: 552558301.632 [s; MET]
Trigger Stop: 552558303.68 [s; MET]
UTC: 2018-07-06T08:24:40.412760 [includes UTCF correction]
Where From?: TDRSS position message
BAT
RA: 181.665199303239 Dec: 66.0347153838887 [deg; J2000]
Catalogged Source?: NO
Point Source?: YES
GRB Indicated?: YES [ by BAT flight software ]
Image S/N Ratio: 8.89
Image Trigger?: NO
Rate S/N Ratio: 14.3527000944073 [ if not an image trigger ]
Image S/N Ratio: 8.89
Analysis Position: [ source = BAT ]
RA: 181.665199303239 Dec: 66.0347153838887 [deg; J2000]
Refined Position: [ source = BAT pre-slew burst ]
RA: 181.682590515597 Dec: 66.0447592756642 [deg; J2000]
{ 12h 06m 43.8s , +66d 02' 41.1" }
+/- 1.01694053934579 [arcmin] (estimated 90% radius based on SNR)
+/- 0.282537722573893 [arcmin] (formal 1-sigma fit error)
SNR: 29.6958766673408
Angular difference between the analysis and refined position is 0.736707 arcmin
Partial Coding Fraction: 0.8671875 [ including projection effects ]
Duration
T90: 42.444000005722 +/- 7.16259732479527
Measured from: -2.11199998855591
to: 40.3320000171661 [s; relative to TRIGTIME]
T50: 20.7359999418259 +/- 10.505770698851
Measured from: 9.58800005912781
to: 30.3240000009537 [s; relative to TRIGTIME]
Fluence
Peak Flux (peak 1 second)
Measured from: 27.8240000009537
to: 28.8240000009537 [s; relative to TRIGTIME]
Total Fluence
Measured from: -15.9199999570847
to: 51.1679999828339 [s; relative to TRIGTIME]
Band 1 Band 2 Band 3 Band 4
15-25 25-50 50-100 100-350 keV
Total 1.562277 1.721259 0.919751 0.170411
0.052522 0.053928 0.045661 0.038157 [error]
Peak 0.119661 0.149393 0.097384 0.014588
0.007958 0.008518 0.007624 0.005079 [error]
[ fluence units of on-axis counts / fully illuminated detector ]
======================================================================
====== Table of the duration information =============================
Value tstart tstop
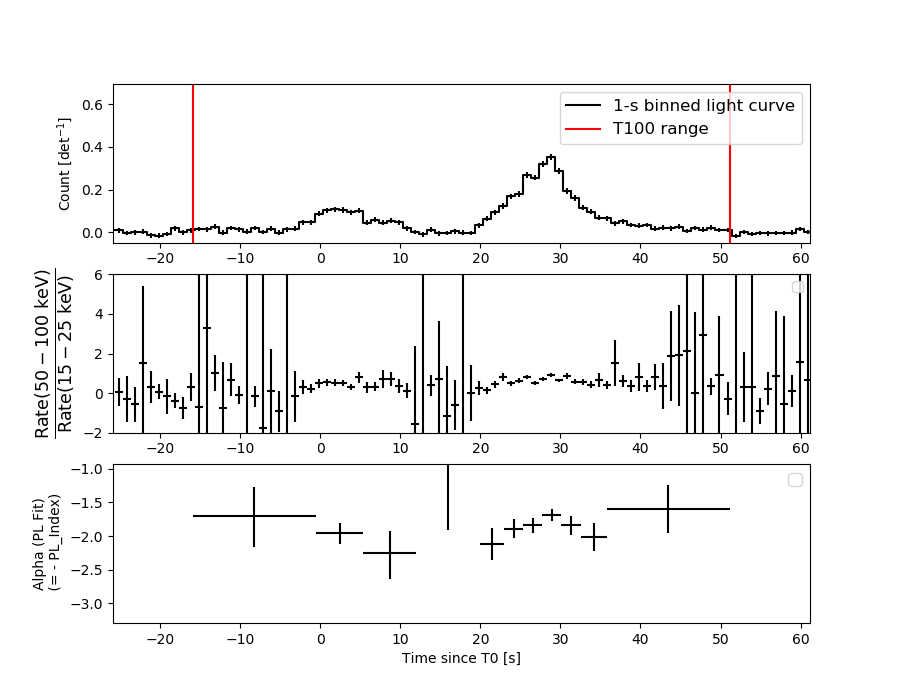
T100 67.088 -15.920 51.168
T90 42.444 -2.112 40.332
T50 20.736 9.588 30.324
Peak 1.000 27.824 28.824
====== Spectral Analysis Summary =====================================
Model : spectral model: simple power-law (PL) and cutoff power-law (CPL)
Ph_index : photon index: E^{Ph_index}
Ph_90err : 90% error of the photon index
Epeak : Epeak in keV
Epeak_90err: 90% error of Epeak
Norm : normalization at 50 keV in both the PL model and CPL model
Nomr_90err : 90% error of the normalization
chi2 : Chi-Squared
dof : degree of freedo
=== Time-averaged spectral analysis ===
(Best model with acceptable fit: PL)
Model Ph_index Ph_90err_low Ph_90err_hi Epeak Epeak_90err_low Epeak_90err_hi Norm Nomr_90err_low Norm_90err_hi chi2 dof
PL -1.909 -0.080 0.079 - - - 3.87e-03 -1.74e-04 1.73e-04 57.690 57
CPL -1.519 -0.317 0.344 57.022 -10.580 46.123 6.21e-03 -1.95e-03 3.16e-03 53.210 56
=== 1-s peak spectral analysis ===
(Best model with acceptable fit: CPL)
Model Ph_index Ph_90err_low Ph_90err_hi Epeak Epeak_90err_low Epeak_90err_hi Norm Nomr_90err_low Norm_90err_hi chi2 dof
PL -1.703 -0.117 0.114 - - - 2.37e-02 -1.73e-03 1.72e-03 54.160 57
CPL -0.995 -0.481 0.542 67.048 -12.535 43.133 5.61e-02 -2.45e-02 5.14e-02 47.520 56
=== Fluence/Peak Flux Summary ===
Model Band1 Band2 Band3 Band4 Band5 Total
15-25 25-50 50-100 100-350 15-150 15-350 keV
Fluence PL 4.87e-07 6.98e-07 7.43e-07 1.47e-06 2.39e-06 3.40e-06 erg/cm2
90%_error_low -3.29e-08 -2.85e-08 -4.61e-08 -1.84e-07 -1.05e-07 -2.25e-07 erg/cm2
90%_error_hi 3.36e-08 2.85e-08 4.63e-08 2.02e-07 1.06e-07 2.38e-07 erg/cm2
Peak flux PL 1.18e+00 1.06e+00 6.49e-01 6.05e-01 3.14e+00 3.49e+00 ph/cm2/s
90%_error_low -1.22e-01 -7.17e-02 -6.11e-02 -1.05e-01 -2.12e-01 -2.35e-01 ph/cm2/s
90%_error_hi 1.26e-01 7.15e-02 6.09e-02 1.17e-01 2.12e-01 2.35e-01 ph/cm2/s
Fluence CPL 4.59e-07 7.23e-07 7.44e-07 7.97e-07 2.30e-06 2.72e-06 erg/cm2
90%_error_low -3.97e-08 -3.48e-08 -4.90e-08 -2.91e-07 -1.27e-07 -3.23e-07 erg/cm2
90%_error_hi 4.02e-08 3.53e-08 4.89e-08 4.99e-07 1.28e-07 5.13e-07 erg/cm2
Peak flux CPL 1.06e+00 1.14e+00 6.76e-01 2.80e-01 3.06e+00 3.16e+00 ph/cm2/s
90%_error_low -1.46e-01 -8.98e-02 -6.86e-02 -1.13e-01 -2.20e-01 -2.53e-01 ph/cm2/s
90%_error_hi 1.48e-01 9.18e-02 6.93e-02 1.87e-01 2.19e-01 2.78e-01 ph/cm2/s
======================================================================
Image
Pre-slew 15.0-350.0 keV image (Event data)
#   RAcent    DECcent   POSerr    Theta     Phi              Peak Cts       SNR   Name
  181.6826    66.0448   0.0065    20.9124   153.2869         2.4240792     29.696 TRIG_00846395

Foreground time interval of the image:
-15.920  27.269 (delta_t =  43.189 [sec])
Background time interval of the image:
-574.931 -556.881 (delta_t =  18.050 [sec])
-239.632 -15.920 (delta_t = 223.712 [sec])
Light Curves
Note: The mask-weighted lightcurves have units of either count/det or counts/sec/det, where a det is 0.4 x 0.4 = 0.16 sq cm.
Full-time range; 1 s binning
Other quick-look light curves:
- 64 ms binning (zoomed)
- 16 ms binning (zoomed)
- 8 ms binning (zoomed)
- 2 ms binning (zoomed)
- SN=5 or 10 s binning (full-time range)
- Raw light curve
Spectra
- 64 ms binning (zoomed)
- 16 ms binning (zoomed)
- 8 ms binning (zoomed)
- 2 ms binning (zoomed)
- SN=5 or 10 s binning (full-time range)
- Raw light curve
Spectra
Notes:
- 1) The fitting includes the systematic errors.
- 2) When the burst includes telescope slew time periods, the fitting uses an average response file made from multiple 5-s response files through out the slew time plus single time preiod for the non-slew times, and weighted by the total counts in the corresponding time period using addrmf. An average response file is needed becuase a spectral fit using the pre-slew DRM will introduce some errors in both a spectral shape and a normalization if the PHA file contains a lot of the slew/post-slew time interval.
- 3) For fits to more complicated models (e.g. a power-law over a cutoff power-law), the BAT team has decided to require a chi-square improvement of more than 6 for each extra dof.
Time averaged spectrum fit using the average DRM
Power-law model
Time interval is from  -15.920 sec. to   51.168 sec.

Spectral model in power-law:
------------------------------------------------------------
Parameters  : value       lower 90%   higher 90%
Photon index: -1.90941     ( -0.0796954   0.0787018 )
Norm@50keV  : 3.86718E-03    ( -0.000173676   0.000172558 )
------------------------------------------------------------
#Fit statistic : Chi-Squared =          57.69 using 59 PHA bins.
# Reduced chi-squared =          1.012 for     57 degrees of freedom
# Null hypothesis probability =   4.496416e-01

Photon flux (15-150 keV)    in 67.09 sec: 0.557246 ( -0.023687  0.023749 ) ph/cm2/s
Energy fluence (15-150 keV)             : 2.38593e-06 ( -1.05441e-07  1.06013e-07 ) ergs/cm2
Cutoff power-law model
Time interval is from  -15.920 sec. to   51.168 sec.
Spectral model in the cutoff power-law:
------------------------------------------------------------
Parameters  : value       lower 90%   higher 90%
Photon index: -1.51932     ( -0.317317   0.343696 )
Epeak [keV] : 57.0218      ( -10.5804 46.1234 )
Norm@50keV  : 6.21238E-03    ( -0.00194523   0.00315625 )
------------------------------------------------------------
#Fit statistic : Chi-Squared =          53.21 using 59 PHA bins.
# Reduced chi-squared =         0.9502 for     56 degrees of freedom
# Null hypothesis probability =   5.811268e-01

Photon flux (15-150 keV)    in 67.09 sec: 0.542837 ( -0.026253  0.026297 ) ph/cm2/s
Energy fluence (15-150 keV)             : 2.29534e-06 ( -1.26801e-07  1.27513e-07 ) ergs/cm2
1-s peak spectrum fit
Power-law model
Time interval is from   27.824 sec. to   28.824 sec.

Spectral model in power-law:
------------------------------------------------------------
Parameters  : value       lower 90%   higher 90%
Photon index: -1.70298     ( -0.116808   0.114163 )
Norm@50keV  : 2.36545E-02    ( -0.00173064   0.00171535 )
------------------------------------------------------------
#Fit statistic : Chi-Squared =          54.16 using 59 PHA bins.
# Reduced chi-squared =         0.9501 for     57 degrees of freedom
# Null hypothesis probability =   5.824869e-01

Photon flux (15-150 keV)    in 1 sec: 3.14499 ( -0.21153  0.21164 ) ph/cm2/s
Energy fluence (15-150 keV)             : 2.18993e-07 ( -1.67516e-08  1.69027e-08 ) ergs/cm2
Cutoff power-law model
Time interval is from   27.824 sec. to   28.824 sec.
Spectral model in the cutoff power-law:
------------------------------------------------------------
Parameters  : value       lower 90%   higher 90%
Photon index: -0.994779     ( -0.481162   0.541976 )
Epeak [keV] : 67.0482      ( -12.5355 43.1325 )
Norm@50keV  : 5.61007E-02    ( -0.0244647   0.051373 )
------------------------------------------------------------
#Fit statistic : Chi-Squared =          47.52 using 59 PHA bins.
# Reduced chi-squared =         0.8485 for     56 degrees of freedom
# Null hypothesis probability =   7.829541e-01

Photon flux (15-150 keV)    in 1 sec: 3.06011 ( -0.21957  0.21918 ) ph/cm2/s
Energy fluence (15-150 keV)             : 2.07778e-07 ( -1.83605e-08  1.853e-08 ) ergs/cm2
Time-resolved spectra
Distribution
T90 vs. Hardness ratio plot
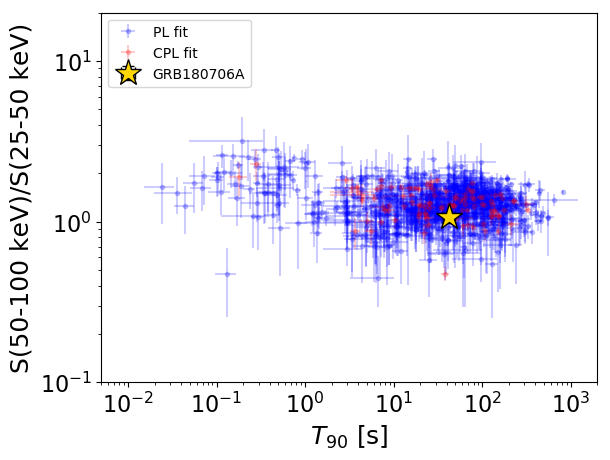
T90                                   = 42.444 sec.
Hardness ratio (energy fluence ratio) = 1.06485333865
S(15-50 keV) vs. S(50-150 keV) plot
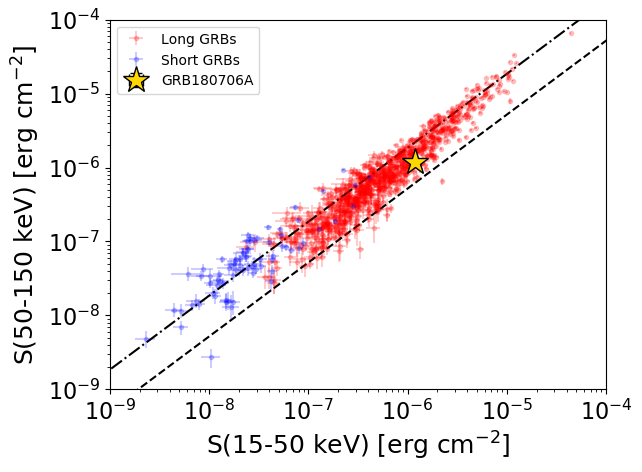
S(15-50 keV)  = 1.1854423e-06
S(50-150 keV) = 1.2005105e-06
The dash-dotted line and the dashed line traces the fluences calculated from the Band function with Epeak = 15 and 150 keV, respectively. Both lines assume a canonical values of alpha = -1 and beta = -2.5.
Mask shadow pattern
IMX = -3.413283865794583E-01, IMY = -1.717678515573294E-01
Spacecraft aspect plot
Bright source in the pre-burst/pre-slew/post-slew images
Pre-burst image of 15-350 keV band
Time interval of the image:
-574.931410 -556.881200
-239.632000 -15.920000

# RAcent  DECcent POSerr Theta    Phi  PeakCts   SNR AngSep     Name
#  [deg]    [deg]    ['] [deg]  [deg]                   [']
 41.7063  67.0069    2.3  27.0   19.3   1.0474   4.9 ------	UNKNOWN
 64.4481  76.8308    2.2  16.1   33.0   0.9419   5.2 ------	UNKNOWN
188.7841  52.6484    2.6  33.5  166.2   1.2644   4.3 ------	UNKNOWN
 40.8905  61.4671    1.3  31.4   12.5   2.2635   8.9 ------	UNKNOWN
 52.0073  53.6537    2.6  34.5   -4.7   1.1199   4.4 ------	UNKNOWN
Pre-slew background subtracted image of 15-350 keV band
Time interval of the image:
-15.920000 27.268610

# RAcent  DECcent POSerr Theta    Phi  PeakCts   SNR AngSep     Name
#  [deg]    [deg]    ['] [deg]  [deg]                   [']
325.1661  81.0776    2.2  27.0   70.3   0.5927   5.2 ------	UNKNOWN
221.7312  70.0633    2.3  28.9  121.9   0.6103   5.0 ------	UNKNOWN
181.6826  66.0448    0.4  20.9  153.3   2.4240  29.7 ------	UNKNOWN
 30.7365  37.3354    2.0  55.7    3.5   2.0487   5.7 ------	UNKNOWN
 85.3733  69.6200    2.4  12.5   -2.5   0.3878   4.9 ------	UNKNOWN
Post-slew image of 15-350 keV band
Time interval of the image:
76.068600 718.765300
720.368000 840.348000
840.368000 962.441600

# RAcent  DECcent POSerr Theta    Phi  PeakCts   SNR AngSep     Name
#  [deg]    [deg]    ['] [deg]  [deg]                   [']
212.6119  56.6953    3.2  17.3  110.9   2.0740   3.7 ------	UNKNOWN
351.3062  63.8051    3.8  49.9    9.0   3.9460   3.1 ------	UNKNOWN
 40.9180  61.4355    1.7  49.3  -20.5   7.1343   6.9 ------	UNKNOWN