Analysis Summary
Notes:
- 1) No attempt has been made to eliminate the non-significant decimal places.
- 2) This batgrbproduct analysis is done using the HEASARC data.
- 3) This batgrbproduct analysis is using the flight position for the mask-weighting calculation.
======================================================================
                  BAT GRB EVENT DATA PROCESSING REPORT
    Process Script Ver: batgrbproduct v2.46
    Process Start Time: Mon Aug  6 18:28:38 EDT 2018
             Host Name: bat1
   Current Working Dir: /local/data/bat1/alien/Swift_3rdBATcatalog/event/batevent_reproc/trigger848048
======================================================================

  Trigger: 00848048      Segment: 000

  BAT Trigger Time: 553370846.272   [s; MET]
      Trigger Stop: 553370846.784   [s; MET]
               UTC: 2018-07-15T18:07:05.003060    [includes UTCF correction]
       Where From?: TDRSS position message

  BAT
    RA: 235.068817047237   Dec: -0.924663860513124  [deg; J2000]

     Catalogged Source?: NO
     Point Source?:      YES
     GRB Indicated?:     YES    [ by BAT flight software ]
     Image S/N Ratio:    7.6
     Image Trigger?:     NO
     Rate S/N Ratio:     39.1918358845308  [ if not an image trigger ]
     Image S/N Ratio:    7.6

  Analysis Position:   [ source = BAT ]
    RA: 235.068817047237   Dec: -0.924663860513124  [deg; J2000]

  Refined Position:   [ source = BAT pre-slew burst ]
    RA: 235.085408155839   Dec: -0.8993132938297  [deg; J2000]
        { 15h 40m 20.5s , -00d 53' 57.5" }
         +/- 2.00178813528584 [arcmin] (estimated 90% radius based on SNR)
         +/- 0.723528537836484 [arcmin] (formal 1-sigma fit error)
    SNR: 11.2855071122324

  Angular difference between the analysis and refined position is 1.817759 arcmin

  Partial Coding Fraction: 0.8515625    [ including projection effects ]

  Duration
     T90: 0.684000015258789 +/- 0.0877268988477141
        Measured from: -0.111999988555908
                   to: 0.572000026702881     [s; relative to TRIGTIME]
     T50: 0.407999873161316 +/- 0.0863712781664672
        Measured from: 0.0480000972747803
                   to: 0.455999970436096     [s; relative to TRIGTIME]


  Fluence
     Peak Flux  (peak 1 second)
        Measured from: -0.25599992275238
                   to: 0.74400007724762     [s; relative to TRIGTIME]
     Total Fluence
        Measured from: -0.143999934196472
                   to: 0.632000088691711     [s; relative to TRIGTIME]

             Band 1     Band 2     Band 3     Band 4
              15-25      25-50     50-100    100-350     keV
 Total     0.024910   0.045797   0.067808   0.023059
           0.006746   0.007331   0.007436   0.007025 [error]
 Peak      0.025059   0.036479   0.071691   0.019743
           0.007521   0.008109   0.008029   0.007534 [error]

     [ fluence units of on-axis counts / fully illuminated detector ]

======================================================================


====== Table of the duration information =============================

        Value   tstart    tstop
T100    0.776   -0.144    0.632
T90     0.684   -0.112    0.572
T50     0.408    0.048    0.456
Peak    1.000   -0.256    0.744


====== Spectral Analysis Summary =====================================

Model      : spectral model: simple power-law (PL) and cutoff power-law (CPL)
Ph_index   : photon index: E^{Ph_index}
Ph_90err   : 90% error of the photon index
Epeak      : Epeak in keV
Epeak_90err: 90% error of Epeak
Norm       : normalization at 50 keV in both the PL model and CPL model
Nomr_90err : 90% error of the normalization
chi2       : Chi-Squared
dof        : degree of freedo

=== Time-averaged spectral analysis ===
(Best model with acceptable fit: PL)

Model Ph_index Ph_90err_low Ph_90err_hi  Epeak  Epeak_90err_low  Epeak_90err_hi  Norm       Nomr_90err_low    Norm_90err_hi    chi2    dof
PL      -0.737    -0.259      0.273       -           -               -         1.35e-02     -2.01e-03          1.97e-03      46.030   57
CPL     -0.589    -0.385      1.235      611.578    -611.578      -611.578      1.55e-02     -3.40e-03          2.77e-02      45.970   56


=== 1-s peak spectral analysis ===
(Best model with acceptable fit: PL)

Model Ph_index Ph_90err_low Ph_90err_hi  Epeak  Epeak_90err_low  Epeak_90err_hi  Norm       Nomr_90err_low    Norm_90err_hi    chi2    dof
PL      -0.677     -0.285     0.305       -           -               -         1.02e-02     -1.75e-03          1.70e-03      53.050   57
CPL     -0.157     -0.647     1.896      237.764    -237.764      -237.764      1.58e-02     -7.07e-03          4.94e-02      52.600   56


=== Fluence/Peak Flux Summary ===

              Model    Band1     Band2     Band3     Band4     Band5     Total
                       15-25     25-50    50-100    100-350    15-150    15-350    keV
Fluence         PL   6.60e-09  1.94e-08  4.66e-08  3.09e-07  1.26e-07  3.82e-07   erg/cm2
      90%_error_low -2.01e-09 -3.73e-09 -6.83e-09 -9.78e-08 -1.88e-08 -1.01e-07   erg/cm2
      90%_error_hi   2.29e-09  3.65e-09  6.74e-09  1.29e-07  1.89e-08  1.30e-07   erg/cm2
Peak flux       PL   1.92e-01  3.17e-01  3.97e-01  9.86e-01  1.18e+00  1.89e+00   ph/cm2/s
      90%_error_low -6.67e-02 -7.26e-02 -6.11e-02 -3.10e-01 -1.87e-01 -3.35e-01   ph/cm2/s
      90%_error_hi   7.90e-02  7.20e-02  6.08e-02  4.01e-01  1.88e-01  3.77e-01   ph/cm2/s

Fluence        CPL   6.28e-09  1.95e-08  4.74e-08  2.59e-07  1.26e-07  3.32e-07   erg/cm2
      90%_error_low -2.83e-09 -3.74e-09 -7.45e-09 -1.73e-07 -1.95e-08 -1.73e-07   erg/cm2
      90%_error_hi   1.95e-09  3.79e-09  8.92e-09  1.20e-07  1.91e-08  1.17e-07   erg/cm2
Peak flux      CPL   1.57e-01  3.12e-01  4.21e-01  6.63e-01  1.15e+00  1.86e+00   ph/cm2/s
      90%_error_low -1.57e-01 -8.72e-02 -7.95e-02 -3.88e-01 -2.05e-01 -7.86e-01   ph/cm2/s
      90%_error_hi   1.06e-01  7.71e-02  9.02e-02  4.24e-01  2.01e-01  2.64e-01   ph/cm2/s

======================================================================
Image
Pre-slew 15.0-350.0 keV image (Event data)
#   RAcent    DECcent   POSerr    Theta     Phi              Peak Cts       SNR   Name
  235.0854    -0.8993   0.0170    24.7069   170.8669         0.1698441     11.286 TRIG_00848048

Foreground time interval of the image:
 -0.144   0.632 (delta_t =   0.776 [sec])
Background time interval of the image:
-239.272  -0.144 (delta_t = 239.128 [sec])
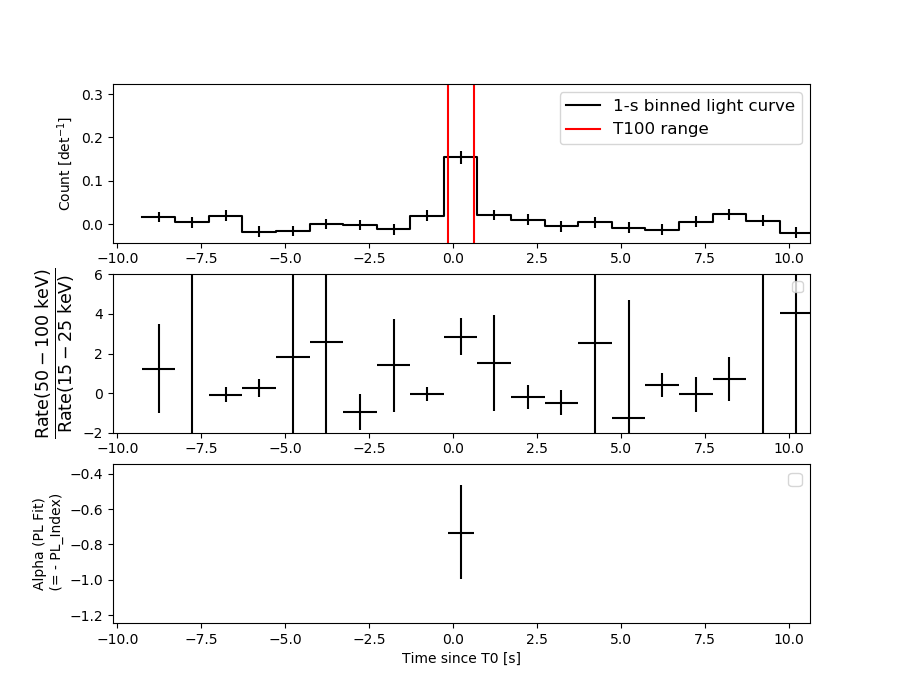
Light Curves
Note: The mask-weighted lightcurves have units of either count/det or counts/sec/det, where a det is 0.4 x 0.4 = 0.16 sq cm.
Full-time range; 1 s binning
Other quick-look light curves:
- 64 ms binning (zoomed)
- 16 ms binning (zoomed)
- 8 ms binning (zoomed)
- 2 ms binning (zoomed)
- SN=5 or 10 s binning (full-time range)
- Raw light curve
Spectra
- 64 ms binning (zoomed)
- 16 ms binning (zoomed)
- 8 ms binning (zoomed)
- 2 ms binning (zoomed)
- SN=5 or 10 s binning (full-time range)
- Raw light curve
Spectra
Notes:
- 1) The fitting includes the systematic errors.
- 2) When the burst includes telescope slew time periods, the fitting uses an average response file made from multiple 5-s response files through out the slew time plus single time preiod for the non-slew times, and weighted by the total counts in the corresponding time period using addrmf. An average response file is needed becuase a spectral fit using the pre-slew DRM will introduce some errors in both a spectral shape and a normalization if the PHA file contains a lot of the slew/post-slew time interval.
- 3) For fits to more complicated models (e.g. a power-law over a cutoff power-law), the BAT team has decided to require a chi-square improvement of more than 6 for each extra dof.
Time averaged spectrum fit using the average DRM
Power-law model
Time interval is from   -0.144 sec. to    0.632 sec.

Spectral model in power-law:
------------------------------------------------------------
Parameters  : value       lower 90%   higher 90%
Photon index: -0.73703     ( -0.258844   0.273434 )
Norm@50keV  : 1.35296E-02    ( -0.00201205   0.00197034 )
------------------------------------------------------------
#Fit statistic : Chi-Squared =          46.03 using 59 PHA bins.
# Reduced chi-squared =         0.8075 for     57 degrees of freedom
# Null hypothesis probability =   8.504854e-01

Photon flux (15-150 keV)    in 0.776 sec: 1.55979 ( -0.22035  0.2215 ) ph/cm2/s
Energy fluence (15-150 keV)             : 1.2607e-07 ( -1.88063e-08  1.89382e-08 ) ergs/cm2
Cutoff power-law model
Time interval is from   -0.144 sec. to    0.632 sec.
Spectral model in the cutoff power-law:
------------------------------------------------------------
Parameters  : value       lower 90%   higher 90%
Photon index: -0.589279     ( -0.38463   1.23499 )
Epeak [keV] : 611.578      ( -611.507 -611.507 )
Norm@50keV  : 1.54616E-02    ( -0.00340321   0.0276541 )
------------------------------------------------------------
#Fit statistic : Chi-Squared =          45.97 using 59 PHA bins.
# Reduced chi-squared =         0.8208 for     56 degrees of freedom
# Null hypothesis probability =   8.282993e-01

Photon flux (15-150 keV)    in 0.776 sec: 1.54914 ( -0.23271  0.2283 ) ph/cm2/s
Energy fluence (15-150 keV)             : 1.25514e-07 ( -1.94688e-08  1.90937e-08 ) ergs/cm2
1-s peak spectrum fit
Power-law model
Time interval is from   -0.256 sec. to    0.744 sec.

Spectral model in power-law:
------------------------------------------------------------
Parameters  : value       lower 90%   higher 90%
Photon index: -0.677033     ( -0.285083   0.304706 )
Norm@50keV  : 1.02104E-02    ( -0.00174781   0.0016969 )
------------------------------------------------------------
#Fit statistic : Chi-Squared =          53.05 using 59 PHA bins.
# Reduced chi-squared =         0.9308 for     57 degrees of freedom
# Null hypothesis probability =   6.238642e-01

Photon flux (15-150 keV)    in 1 sec: 1.18248 ( -0.186615  0.1878 ) ph/cm2/s
Energy fluence (15-150 keV)             : 1.25951e-07 ( -2.02887e-08  2.03947e-08 ) ergs/cm2
Cutoff power-law model
Time interval is from   -0.256 sec. to    0.744 sec.
Spectral model in the cutoff power-law:
------------------------------------------------------------
Parameters  : value       lower 90%   higher 90%
Photon index: -0.157066     ( -0.646902   1.89522 )
Epeak [keV] : 237.764      ( -237.657 -237.657 )
Norm@50keV  : 1.58420E-02    ( -0.0070746   0.0493481 )
------------------------------------------------------------
#Fit statistic : Chi-Squared =          52.60 using 59 PHA bins.
# Reduced chi-squared =         0.9394 for     56 degrees of freedom
# Null hypothesis probability =   6.041797e-01

Photon flux (15-150 keV)    in 1 sec: 1.15294 ( -0.204763  0.20083 ) ph/cm2/s
Energy fluence (15-150 keV)             : 1.2448e-07 ( -2.12276e-08  2.09118e-08 ) ergs/cm2
Time-resolved spectra
Distribution
T90 vs. Hardness ratio plot
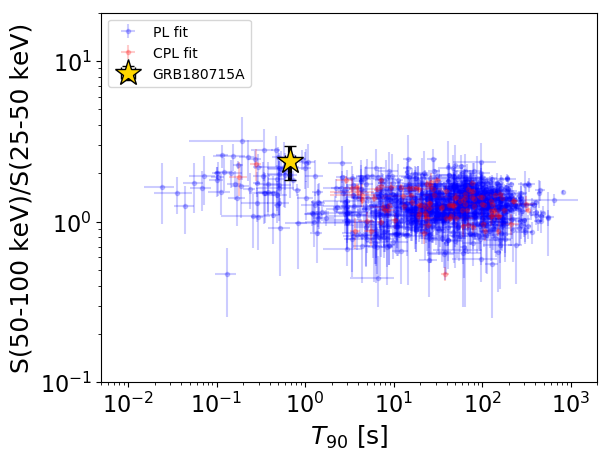
T90                                   = 0.684 sec.
Hardness ratio (energy fluence ratio) = 2.39993770064
S(15-50 keV) vs. S(50-150 keV) plot
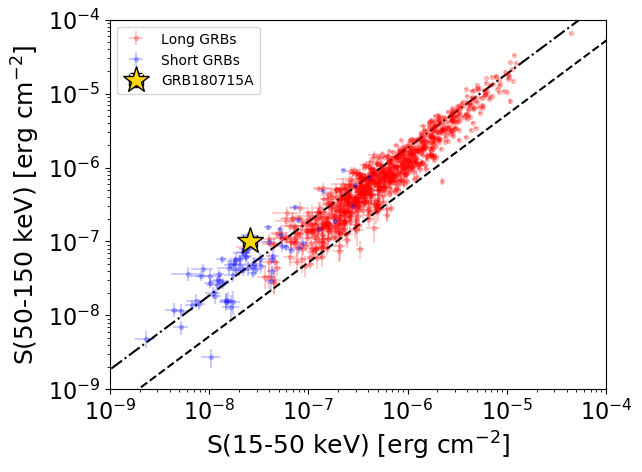
S(15-50 keV)  = 2.601867e-08
S(50-150 keV) = 1.0005308e-07
The dash-dotted line and the dashed line traces the fluences calculated from the Band function with Epeak = 15 and 150 keV, respectively. Both lines assume a canonical values of alpha = -1 and beta = -2.5.
Mask shadow pattern
IMX = -4.542611714895851E-01, IMY = -7.302989999228948E-02
Spacecraft aspect plot
Bright source in the pre-burst/pre-slew/post-slew images
Pre-burst image of 15-350 keV band
Time interval of the image:
-239.272000 -0.144000

# RAcent  DECcent POSerr Theta    Phi  PeakCts   SNR AngSep     Name
#  [deg]    [deg]    ['] [deg]  [deg]                   [']
244.9816 -15.6478    0.6  37.9  147.6   9.0611  19.9    0.5	Sco X-1
254.4854  35.3498    2.2  16.0    1.8   1.3002   5.3    1.4	Her X-1
268.5692  -1.4343    0.0  33.7  100.6  -0.2988  -0.5   12.1	SW J1753.5-0127
299.6424  35.1652    5.1  49.8   31.2   2.6847   2.3    3.4	Cyg X-1
256.4114 -22.7493    3.3  46.6  133.3   4.0466   3.5 ------	UNKNOWN
286.1580  61.8600    2.1  48.9   -6.0   2.4700   5.6 ------	UNKNOWN
196.4909  15.1218    3.3  45.4 -121.3   4.8025   3.5 ------	UNKNOWN
Pre-slew background subtracted image of 15-350 keV band
Time interval of the image:
-0.144000 0.632000

# RAcent  DECcent POSerr Theta    Phi  PeakCts   SNR AngSep     Name
#  [deg]    [deg]    ['] [deg]  [deg]                   [']
244.7763 -15.6854    6.4  37.9  147.9  -0.0453  -1.8   12.0	Sco X-1
254.3031  35.4143    6.2  16.0    1.2   0.0241   1.9    8.7	Her X-1
268.2021  -1.4945   25.0  33.5  101.1   0.0121   0.5   10.3	SW J1753.5-0127
299.6277  35.0756    5.4  49.8   31.3   0.1282   2.2    7.8	Cyg X-1
234.3621 -23.0912    2.4  46.3  161.4   0.1670   4.9 ------	UNKNOWN
231.8005 -11.3451    2.5  35.6  169.9   0.0811   4.6 ------	UNKNOWN
235.0855  -0.8992    1.0  24.7  170.9   0.1684  11.2 ------	UNKNOWN
Post-slew image of 15-350 keV band
Time interval of the image:
289.228600 635.028600

# RAcent  DECcent POSerr Theta    Phi  PeakCts   SNR AngSep     Name
#  [deg]    [deg]    ['] [deg]  [deg]                   [']
244.9658 -15.6350    0.8  38.2 -145.1   8.4123  14.7    0.8	Sco X-1
255.9643 -37.8241    1.5  42.0  177.4   4.5287   7.7    1.6	4U 1700-377
256.3721 -36.5053    7.8  40.8  178.3   0.7997   1.5    5.8	GX 349+2
263.1591 -24.6622    8.2  28.0 -175.7   0.5007   1.4    9.6	GX 1+4
264.6385 -44.3669   14.9  44.0  164.1  -0.5671  -0.8    6.7	4U 1735-44
268.5142  -1.3748   62.3  13.1 -116.6   0.0631   0.2    9.9	SW J1753.5-0127
270.3101 -25.1152    3.3  24.6  171.7   1.1558   3.5    2.6	GX 5-1
270.3096 -25.7897    2.4  25.2  171.0   1.6955   4.9    2.8	GRS 1758-258
274.0613 -13.9623    3.6  13.2 -179.8   1.0986   3.1    5.5	GX 17+2
275.6874 -30.4112    0.0  28.0  157.5   0.4400   1.1   12.6	H1820-303
285.1703 -24.9974   74.9  22.3  138.0  -0.0562  -0.2    8.6	HT1900.1-2455
288.7804  10.9649    1.3  15.7   -6.1   2.8037   8.9    1.6	GRS 1915+105
299.6011  35.1591    4.9  41.7  -10.9   1.0716   2.4    2.6	Cyg X-1
307.9894  41.0002   25.8  50.1   -7.4   0.3337   0.4    6.2	Cyg X-3
262.9364 -33.7558    4.0  35.3  174.0   1.3564   2.9    5.4	GX 354-0
329.3168  12.6417    3.5  49.9   37.4   5.7375   3.3 ------	UNKNOWN
303.7417 -33.3167    3.2  36.8  114.9   2.7711   3.6 ------	UNKNOWN
299.1864  27.0781    2.6  34.5   -4.9   1.7950   4.4 ------	UNKNOWN
262.1473 -20.2623    3.0  25.6 -167.2   1.2245   3.8 ------	UNKNOWN
275.0774   7.1803    1.6  12.0  -65.8   2.1647   7.1 ------	UNKNOWN
304.8588  44.7981    4.1  52.1  -12.5   2.4770   2.8 ------	UNKNOWN
	UNKNOWN
	UNKNOWN
	UNKNOWN