Analysis Summary
Notes:
- 1) No attempt has been made to eliminate the non-significant decimal places.
- 2) This batgrbproduct analysis is done using the HEASARC data.
- 3) This batgrbproduct analysis is using the flight position for the mask-weighting calculation.
==========================================================================
BAT GROUND-DETECTED GRB DATA PROCESSING REPORT
Process Script Ver: batgrbproduct v2.46
Process Start Time: Wed Jul 18 16:04:59 EDT 2018
Host Name: bat1
Current Working Dir: /local/data/bat1/alien/Swift_3rdBATcatalog/event/ground_detect_bursts/scripts
======================================================================
Trigger: 00848489 Segment: 000
BAT Trigger Time: 553571885.816
UTC: 20180718T01:57:44.530 [includes UTCF correction]
Where From?: Ground analysis (best_duration.txt)
NOTE: BAT trigger time for ground-detected burst is the T100 start time.
Analysis Position: [ source = GCN ]
RA: 336.0186 Dec: 2.7898
Refined Position: [ source = BAT pre-slew image ]
RA: 336.019 Dec: 2.7898 [deg; J2000]
{ 22h 24m 04.6s , +02d 47' 23.3" }
+/- 3.00825676649 [arcmin] (estimated 90% radius based on SNR)
SNR: 6.30765882123
Angular difference between the analysis and refined position is 0.023972 arcmin
Partial Coding Fraction: 0.25 [ including projection effects ]
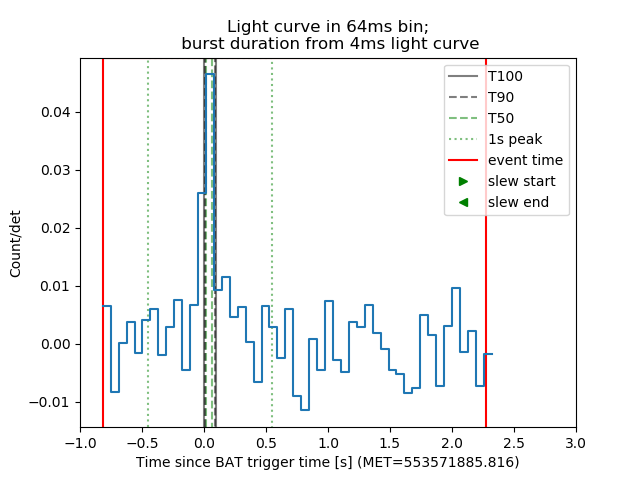
Duration
T90: 0.0839999914169312 +/- 0.0233238752907961
Measured from: 0.00800002
to: 0.092 [s; relative to TRIGTIME]
T50: 0.0519999265670776 +/- 0.0256125023115591
Measured from: 0.016
to: 0.068 [s; relative to TRIGTIME]
====== Table of the duration information =============================
Value tstart tstop
T100 0.100 0.000 0.100
T90 0.084 0.008 0.092
T50 0.052 0.016 0.068
Peak 1.000 -0.448 0.552
====== Spectral Analysis Summary =====================================
Model : spectral model: simple power-law (PL) and cutoff power-law (CPL)
Ph_index : photon index: E^{Ph_index}
Ph_90err : 90% error of the photon index
Epeak : Epeak in keV
Epeak_90err: 90% error of Epeak
Norm : normalization at 50 keV in both the PL model and CPL model
Nomr_90err : 90% error of the normalization
chi2 : Chi-Squared
dof : degree of freedo
=== Time-averaged spectral analysis ===
(Best model with acceptable fit: N/A)
Model Ph_index Ph_90err_low Ph_90err_hi Epeak Epeak_90err_low Epeak_90err_hi Norm Nomr_90err_low Norm_90err_hi chi2 dof
PL -4.657 -0.832 0.679 - - - 1.07e-03 -7.19e-04 6.92e-04 82.090 57
CPL -1.000 N/A N/A 80.000 N/A N/A 2.10e-04 N/A N/A 88.450 56
=== 1-s peak spectral analysis ===
(Best model with acceptable fit: PL)
Model Ph_index Ph_90err_low Ph_90err_hi Epeak Epeak_90err_low Epeak_90err_hi Norm Nomr_90err_low Norm_90err_hi chi2 dof
PL -1.757 -0.549 0.492 - - - 7.25e-03 -2.57e-03 2.48e-03 58.080 57
CPL -0.689 -1.491 4.886 53.933 -49.518 -53.933 2.90e-02 -2.90e-02 3.35e+01 57.300 56
=== Fluence/Peak Flux Summary ===
Model Band1 Band2 Band3 Band4 Band5 Total
15-25 25-50 50-100 100-350 15-150 15-350 keV
Fluence PL 2.94e-09 8.58e-10 1.36e-10 2.48e-11 3.95e-09 3.96e-09 erg/cm2
90%_error_low -1.98e-09 -5.11e-10 -9.80e-11 -2.09e-11 -2.52e-09 -2.52e-09 erg/cm2
90%_error_hi 2.00e-09 5.11e-10 9.75e-11 2.97e-11 2.52e-09 2.52e-09 erg/cm2
Peak flux PL 3.82e-01 3.31e-01 1.96e-01 1.74e-01 9.83e-01 1.08e+00 ph/cm2/s
90%_error_low -1.65e-01 -1.04e-01 -8.45e-02 -1.10e-01 -3.09e-01 -3.41e-01 ph/cm2/s
90%_error_hi 1.81e-01 1.04e-01 8.49e-02 1.78e-01 3.10e-01 3.43e-01 ph/cm2/s
Fluence CPL 2.32e-09 1.10e-08 2.34e-09 1.94e-12 1.56e-08 1.56e-08 erg/cm2
90%_error_low -1.55e-09 -4.70e-09 N/A -1.73e-12 -5.04e-09 -4.98e-09 erg/cm2
90%_error_hi 3.97e-09 4.66e-09 N/A 4.10e-12 5.94e-09 6.03e-09 erg/cm2
Peak flux CPL 3.43e-01 3.78e-01 2.02e-01 5.32e-02 9.62e-01 9.75e-01 ph/cm2/s
90%_error_low -1.86e-01 -1.34e-01 -2.02e-01 -5.32e-02 -3.15e-01 -3.26e-01 ph/cm2/s
90%_error_hi 1.97e-01 1.61e-01 1.04e-01 1.79e-01 3.13e-01 3.82e-01 ph/cm2/s
======================================================================
Image
Pre-slew 15.0-350.0 keV image (Event data)
#   RAcent    DECcent   POSerr    Theta     Phi              Peak Cts       SNR   Name
    336.019   2.790     0.000     34.670    69.207           0.079          6.308 TRIG_00848489

Image time interval: 0.065 to 2.273 [sec]
Light Curves
Note: The mask-weighted lightcurves have units of either count/det or counts/sec/det, where a det is 0.4 x 0.4 = 0.16 sq cm.
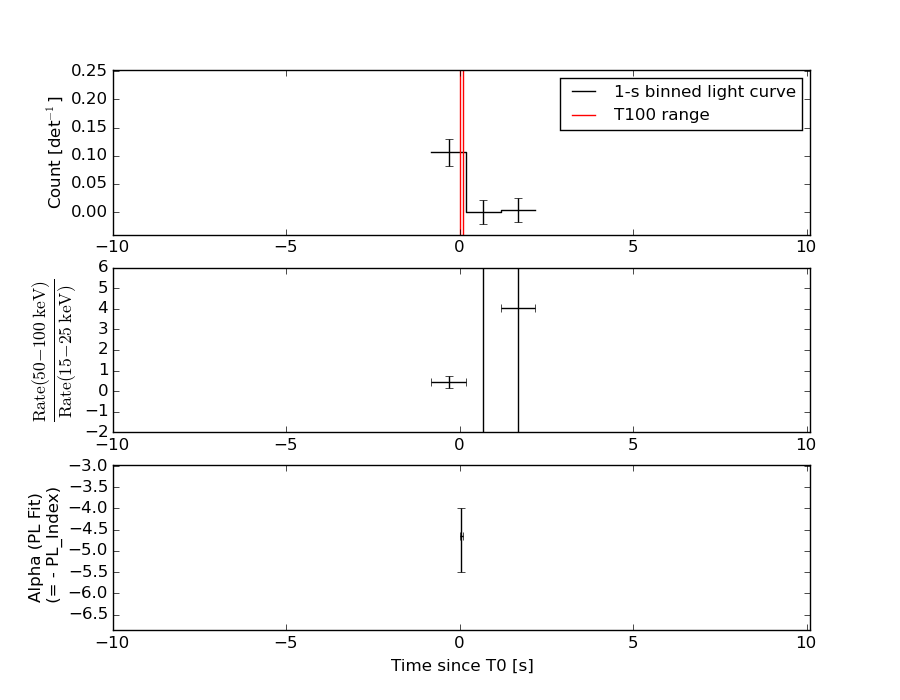
Best duration plot
Full-time range; 1 s binning
Other quick-look light curves:
- 64 ms binning (zoomed)
- 16 ms binning (zoomed)
- 8 ms binning (zoomed)
- 2 ms binning (zoomed)
- SN=5 or 10 s binning (full-time range)
- Raw light curve
Spectra
- 64 ms binning (zoomed)
- 16 ms binning (zoomed)
- 8 ms binning (zoomed)
- 2 ms binning (zoomed)
- SN=5 or 10 s binning (full-time range)
- Raw light curve
Spectra
Notes:
- 1) The fitting includes the systematic errors.
- 2) When the burst includes telescope slew time periods, the fitting uses an average response file made from multiple 5-s response files through out the slew time plus single time preiod for the non-slew times, and weighted by the total counts in the corresponding time period using addrmf. An average response file is needed becuase a spectral fit using the pre-slew DRM will introduce some errors in both a spectral shape and a normalization if the PHA file contains a lot of the slew/post-slew time interval.
- 3) For fits to more complicated models (e.g. a power-law over a cutoff power-law), the BAT team has decided to require a chi-square improvement of more than 6 for each extra dof.
Time averaged spectrum fit using the average DRM
Power-law model
Time interval is from    0.000 sec. to    0.100 sec.

Spectral model in power-law:
------------------------------------------------------------
Parameters  : value       lower 90%   higher 90%
Photon index: -4.6565     ( -0.833737   0.676788 )
Norm@50keV  : 1.07159E-03    ( -0.000719191   0.000691525 )
------------------------------------------------------------
#Fit statistic : Chi-Squared =          82.09 using 59 PHA bins.
# Reduced chi-squared =          1.440 for     57 degrees of freedom
# Null hypothesis probability =   1.642924e-02

Photon flux (15-150 keV)    in 0.1 sec: 1.19595 ( -0.785305  0.78978 ) ph/cm2/s
Energy fluence (15-150 keV)             : 3.94903e-09 ( -2.51948e-09  2.51674e-09 ) ergs/cm2
Cutoff power-law model
Time interval is from    0.000 sec. to    0.100 sec.
Spectral model in the cutoff power-law:
------------------------------------------------------------
Parameters  : value       lower 90%   higher 90%
Photon index: -1     (       )
Epeak [keV] : 80.0000      (   )
Norm@50keV  : 2.09740E-04    (     )
------------------------------------------------------------
#Fit statistic : Chi-Squared =          88.45 using 59 PHA bins.
# Reduced chi-squared =          1.580 for     56 degrees of freedom
# Null hypothesis probability =   3.697836e-03

Photon flux (15-150 keV)    in 0.1 sec:  (    ) ph/cm2/s
Energy fluence (15-150 keV)             : 1.56236e-08 ( -5.04008e-09  5.94341e-09 ) ergs/cm2
1-s peak spectrum fit
Power-law model

Time interval is from   -0.448 sec. to    0.552 sec.

Spectral model in power-law:
------------------------------------------------------------
Parameters  : value       lower 90%   higher 90%
Photon index: -1.75694     ( -0.549084   0.492331 )
Norm@50keV  : 7.25453E-03    ( -0.00257286   0.00247763 )
------------------------------------------------------------
#Fit statistic : Chi-Squared =          58.08 using 59 PHA bins.
# Reduced chi-squared =          1.019 for     57 degrees of freedom
# Null hypothesis probability =   4.353983e-01

Photon flux (15-150 keV)    in 1 sec: 0.983499 ( -0.309243  0.309631 ) ph/cm2/s
Energy fluence (15-150 keV)             : 6.69268e-08 ( -2.34958e-08  2.42701e-08 ) ergs/cm2
Cutoff power-law model
Time interval is from   -0.448 sec. to    0.552 sec.
Spectral model in the cutoff power-law:
------------------------------------------------------------
Parameters  : value       lower 90%   higher 90%
Photon index: -0.688847     ( -1.49091   4.88613 )
Epeak [keV] : 53.9330      ( -49.5157 -53.9309 )
Norm@50keV  : 2.89871E-02    ( -0.0289904   33.5399 )
------------------------------------------------------------
#Fit statistic : Chi-Squared =          57.30 using 59 PHA bins.
# Reduced chi-squared =          1.023 for     56 degrees of freedom
# Null hypothesis probability =   4.268534e-01

Photon flux (15-150 keV)    in 1 sec: 0.962432 ( -0.314628  0.313218 ) ph/cm2/s
Energy fluence (15-150 keV)             : 5.60544e-08 ( -5.41312e-08  2.39474e-08 ) ergs/cm2
Time-resolved spectra
Distribution
T90 vs. Hardness ratio plot
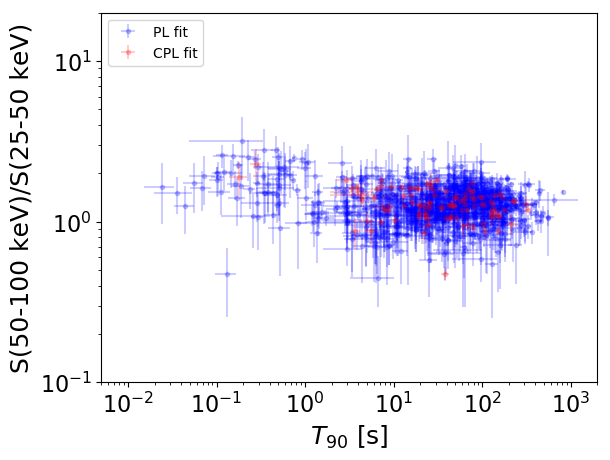
T90                                   = N/A sec.
Hardness ratio (energy fluence ratio) = N/A
S(15-50 keV) vs. S(50-150 keV) plot
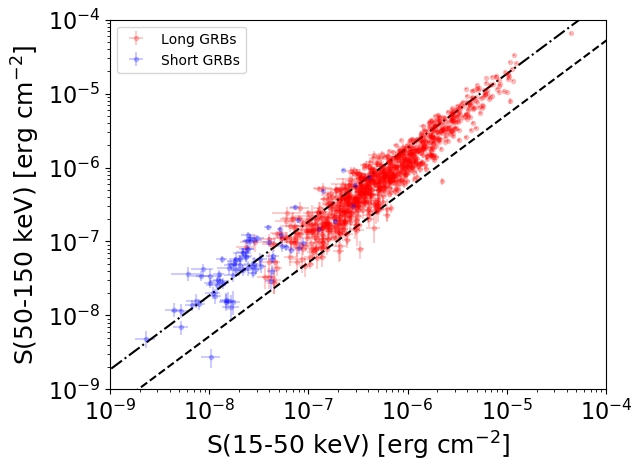
S(15-50 keV)  = N/A
S(50-150 keV) = N/A
The dash-dotted line and the dashed line traces the fluences calculated from the Band function with Epeak = 15 and 150 keV, respectively. Both lines assume a canonical values of alpha = -1 and beta = -2.5.
Spacecraft aspect plot
Bright source in the event data image
Event data image of 15-350 keV band
Time interval of the image:
0.065000 2.272600

# RAcent  DECcent POSerr Theta    Phi  PeakCts   SNR AngSep     Name
#  [deg]    [deg]    ['] [deg]  [deg]                   [']
299.6383  35.2947    5.0  47.9  140.8   0.1763   2.3    6.1	Cyg X-1
308.0524  40.9637   52.2  40.6  147.7   0.0076   0.2    2.7	Cyg X-3
326.1921  38.3167  331.0  26.6  144.0   0.0007   0.0    1.0	Cyg X-2
285.8998  64.6886    2.4  54.5  179.5   0.3288   4.8 ------	UNKNOWN
 16.0325  73.6841    2.2  43.8 -143.2   0.1692   5.2 ------	UNKNOWN
Webpage updated on:
Sat Aug 11 22:42:30 EDT 2018