Analysis Summary
Notes:
- 1) No attempt has been made to eliminate the non-significant decimal places.
- 2) This batgrbproduct analysis is done using the HEASARC data.
- 3) This batgrbproduct analysis is using the flight position for the mask-weighting calculation.
======================================================================
                  BAT GRB EVENT DATA PROCESSING REPORT
    Process Script Ver: batgrbproduct v2.46
    Process Start Time: Mon Aug  6 18:24:51 EDT 2018
             Host Name: bat1
   Current Working Dir: /local/data/bat1/alien/Swift_3rdBATcatalog/event/batevent_reproc/trigger848890
======================================================================

  Trigger: 00848890      Segment: 000

  BAT Trigger Time: 553789325.888   [s; MET]
      Trigger Stop: 553789326.912   [s; MET]
               UTC: 2018-07-20T14:21:44.593440    [includes UTCF correction]
       Where From?: TDRSS position message

  BAT
    RA: 0.52968200447337   Dec: -2.93344156841311  [deg; J2000]

     Catalogged Source?: NO
     Point Source?:      YES
     GRB Indicated?:     YES    [ by BAT flight software ]
     Image S/N Ratio:    12.41
     Image Trigger?:     NO
     Rate S/N Ratio:     135.970585054268  [ if not an image trigger ]
     Image S/N Ratio:    12.41

  Analysis Position:   [ source = BAT ]
    RA: 0.52968200447337   Dec: -2.93344156841311  [deg; J2000]

  Refined Position:   [ source = BAT pre-slew burst ]
    RA: 0.528571841222877   Dec: -2.92552612118528  [deg; J2000]
        { 00h 02m 06.9s , -02d 55' 31.9" }
         +/- 1.16091989332408 [arcmin] (estimated 90% radius based on SNR)
         +/- 0.41793099795083 [arcmin] (formal 1-sigma fit error)
    SNR: 24.5778411209893

  Angular difference between the analysis and refined position is 0.479563 arcmin

  Partial Coding Fraction: 0.08496094    [ including projection effects ]

  Duration
     T90: 108.399999856949 +/- 3.6884533781446
        Measured from: 0.220000028610229
                   to: 108.619999885559     [s; relative to TRIGTIME]
     T50: 20.067999958992 +/- 1.06384957132124
        Measured from: 8.28799998760223
                   to: 28.3559999465942     [s; relative to TRIGTIME]


  Fluence
     Peak Flux  (peak 1 second)
        Measured from: 10.9359999895096
                   to: 11.9359999895096     [s; relative to TRIGTIME]
     Total Fluence
        Measured from: -3.81599998474121
                   to: 527.728000044823     [s; relative to TRIGTIME]

             Band 1     Band 2     Band 3     Band 4
              15-25      25-50     50-100    100-350     keV
 Total    27.985309  42.002355  38.493172  13.089993
           0.287209   0.348442   0.353681   0.280679 [error]
 Peak      1.265924   2.649425   3.050419   1.236563
           0.064338   0.090272   0.105104   0.086043 [error]

     [ fluence units of on-axis counts / fully illuminated detector ]

======================================================================


====== Table of the duration information =============================

        Value   tstart    tstop
T100  531.544   -3.816  527.728
T90   108.400    0.220  108.620
T50    20.068    8.288   28.356
Peak    1.000   10.936   11.936


====== Spectral Analysis Summary =====================================

Model      : spectral model: simple power-law (PL) and cutoff power-law (CPL)
Ph_index   : photon index: E^{Ph_index}
Ph_90err   : 90% error of the photon index
Epeak      : Epeak in keV
Epeak_90err: 90% error of Epeak
Norm       : normalization at 50 keV in both the PL model and CPL model
Nomr_90err : 90% error of the normalization
chi2       : Chi-Squared
dof        : degree of freedo

=== Time-averaged spectral analysis ===
(Best model with acceptable fit: PL)

Model Ph_index Ph_90err_low Ph_90err_hi  Epeak  Epeak_90err_low  Epeak_90err_hi  Norm       Nomr_90err_low    Norm_90err_hi    chi2    dof
PL      -1.345    -0.027      0.027       -           -               -         1.62e-02     -2.42e-04          2.42e-04      34.850   57
CPL     -1.340    -0.028      0.054     9998.780    -9998.780      -9998.780      1.63e-02     -2.26e-04          8.28e-04      35.020   56


=== 1-s peak spectral analysis ===
(Best model with acceptable fit: N/A)

Model Ph_index Ph_90err_low Ph_90err_hi  Epeak  Epeak_90err_low  Epeak_90err_hi  Norm       Nomr_90err_low    Norm_90err_hi    chi2    dof
PL      -1.026     -0.063     0.063       -           -               -         5.89e-01     -2.20e-02          2.20e-02      74.420   57
CPL     -0.664     -0.251     0.266      214.739     -66.739       321.716      8.53e-01     -1.89e-01          2.58e-01      68.220   56


=== Fluence/Peak Flux Summary ===

              Model    Band1     Band2     Band3     Band4     Band5     Total
                       15-25     25-50    50-100    100-350    15-150    15-350    keV
Fluence         PL   9.53e-06  1.93e-05  3.03e-05  1.06e-04  8.44e-05  1.65e-04   erg/cm2
      90%_error_low -3.19e-07 -3.79e-07 -4.53e-07 -3.78e-06 -1.19e-06 -3.85e-06   erg/cm2
      90%_error_hi   3.24e-07  3.79e-07  4.53e-07  3.87e-06  1.19e-06  3.93e-06   erg/cm2
Peak flux       PL   1.44e-03  4.78e-02  5.32e-01  5.18e+01  2.39e+00  5.18e+01   ph/cm2/s
      90%_error_low     N/A       N/A       N/A       N/A       N/A       N/A     ph/cm2/s
      90%_error_hi      N/A       N/A       N/A       N/A       N/A       N/A     ph/cm2/s

Fluence        CPL   9.52e-06  1.93e-05  3.03e-05  1.05e-04  8.44e-05  1.72e-04   erg/cm2
      90%_error_low    N/A    -3.80e-07    N/A       N/A    -1.19e-06    N/A      erg/cm2
      90%_error_hi     N/A     3.79e-07    N/A       N/A     1.18e-06    N/A      erg/cm2
Peak flux      CPL   1.40e+01  2.10e+01  2.12e+01  2.53e+01  6.72e+01  8.16e+01   ph/cm2/s
      90%_error_low -1.43e+00 -1.01e+00 -1.07e+00 -5.20e+00 -2.63e+00 -5.81e+00   ph/cm2/s
      90%_error_hi   1.46e+00  1.02e+00  1.08e+00  6.87e+00  2.63e+00  7.16e+00   ph/cm2/s

======================================================================
Image
Pre-slew 15.0-350.0 keV image (Event data)
#   RAcent    DECcent   POSerr    Theta     Phi              Peak Cts       SNR   Name
    0.5286    -2.9255   0.0078    45.1652    47.0600        49.7042722     24.578 TRIG_00848890

Foreground time interval of the image:
 -3.816  12.013 (delta_t =  15.829 [sec])
Background time interval of the image:
-40.387  -3.816 (delta_t =  36.571 [sec])
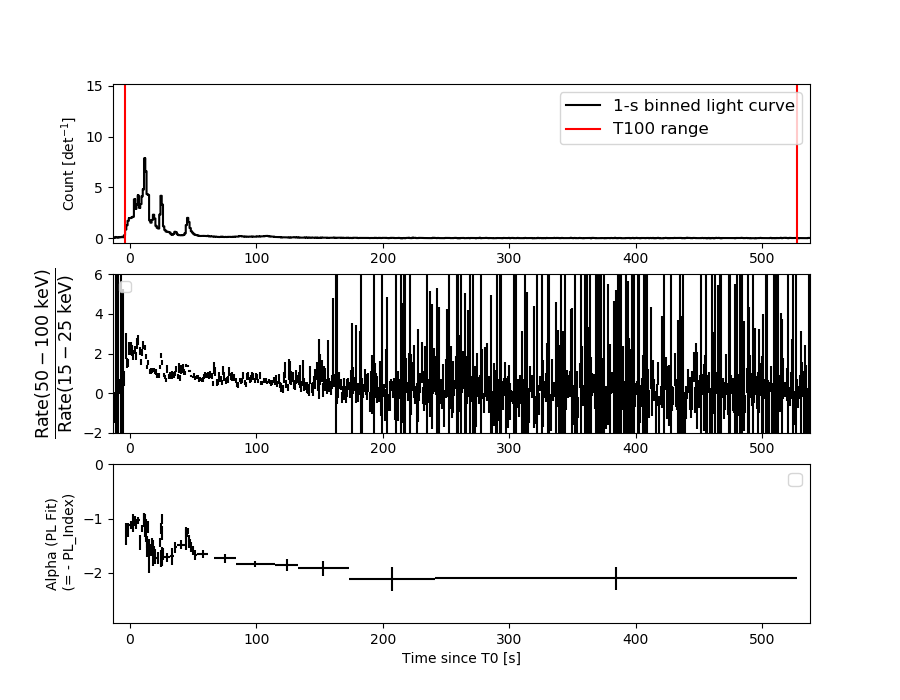
Light Curves
Note: The mask-weighted lightcurves have units of either count/det or counts/sec/det, where a det is 0.4 x 0.4 = 0.16 sq cm.
Full-time range; 1 s binning
Other quick-look light curves:
- 64 ms binning (zoomed)
- 16 ms binning (zoomed)
- 8 ms binning (zoomed)
- 2 ms binning (zoomed)
- SN=5 or 10 s binning (full-time range)
- Raw light curve
Spectra
- 64 ms binning (zoomed)
- 16 ms binning (zoomed)
- 8 ms binning (zoomed)
- 2 ms binning (zoomed)
- SN=5 or 10 s binning (full-time range)
- Raw light curve
Spectra
Notes:
- 1) The fitting includes the systematic errors.
- 2) When the burst includes telescope slew time periods, the fitting uses an average response file made from multiple 5-s response files through out the slew time plus single time preiod for the non-slew times, and weighted by the total counts in the corresponding time period using addrmf. An average response file is needed becuase a spectral fit using the pre-slew DRM will introduce some errors in both a spectral shape and a normalization if the PHA file contains a lot of the slew/post-slew time interval.
- 3) For fits to more complicated models (e.g. a power-law over a cutoff power-law), the BAT team has decided to require a chi-square improvement of more than 6 for each extra dof.
Time averaged spectrum fit using the average DRM
Power-law model
Time interval is from   -3.816 sec. to  527.728 sec.

Spectral model in power-law:
------------------------------------------------------------
Parameters  : value       lower 90%   higher 90%
Photon index: -1.34547     ( -0.0273285   0.0274723 )
Norm@50keV  : 1.62355E-02    ( -0.00024236   0.00024175 )
------------------------------------------------------------
#Fit statistic : Chi-Squared =          34.85 using 59 PHA bins.
# Reduced chi-squared =         0.6114 for     57 degrees of freedom
# Null hypothesis probability =   9.909425e-01

Photon flux (15-150 keV)    in 531.5 sec: 1.95412 ( -0.03432  0.03451 ) ph/cm2/s
Energy fluence (15-150 keV)             : 8.43751e-05 ( -1.1866e-06  1.18737e-06 ) ergs/cm2
Cutoff power-law model
Time interval is from   -3.816 sec. to  527.728 sec.
Spectral model in the cutoff power-law:
------------------------------------------------------------
Parameters  : value       lower 90%   higher 90%
Photon index: -1.34046     ( -0.0276626   0.0552421 )
Epeak [keV] : 9998.78      ( -9999.29 -9999.29 )
Norm@50keV  : 1.62850E-02    ( -0.000238793   0.000815327 )
------------------------------------------------------------
#Fit statistic : Chi-Squared =          35.02 using 59 PHA bins.
# Reduced chi-squared =         0.6253 for     56 degrees of freedom
# Null hypothesis probability =   9.874280e-01

Photon flux (15-150 keV)    in 531.5 sec: 1.05496 ( -0.060522  0.04154 ) ph/cm2/s
Energy fluence (15-150 keV)             : 8.43613e-05 ( -1.1881e-06  1.18346e-06 ) ergs/cm2
1-s peak spectrum fit
Power-law model
Time interval is from   10.936 sec. to   11.936 sec.

Spectral model in power-law:
------------------------------------------------------------
Parameters  : value       lower 90%   higher 90%
Photon index: -1.02558     ( -0.0631034   0.0633522 )
Norm@50keV  : 0.588910    ( -0.0220061   0.0219957 )
------------------------------------------------------------
#Fit statistic : Chi-Squared =          74.42 using 59 PHA bins.
# Reduced chi-squared =          1.306 for     57 degrees of freedom
# Null hypothesis probability =   6.045939e-02

Photon flux (15-150 keV)    in 1 sec: 2.39163 (    ) ph/cm2/s
Energy fluence (15-150 keV)             : 6.31204e-06 ( -2.59049e-07  2.59694e-07 ) ergs/cm2
Cutoff power-law model
Time interval is from   10.936 sec. to   11.936 sec.
Spectral model in the cutoff power-law:
------------------------------------------------------------
Parameters  : value       lower 90%   higher 90%
Photon index: -0.663509     ( -0.251136   0.266226 )
Epeak [keV] : 214.739      ( -66.7397 321.716 )
Norm@50keV  : 0.853391    ( -0.189165   0.25844 )
------------------------------------------------------------
#Fit statistic : Chi-Squared =          68.22 using 59 PHA bins.
# Reduced chi-squared =          1.218 for     56 degrees of freedom
# Null hypothesis probability =   1.267865e-01

Photon flux (15-150 keV)    in 1 sec: 67.1509 ( -2.6298  2.6306 ) ph/cm2/s
Energy fluence (15-150 keV)             : 6.36708e-07 ( -1.66673e-07  1.60607e-07 ) ergs/cm2
Time-resolved spectra
Distribution
T90 vs. Hardness ratio plot
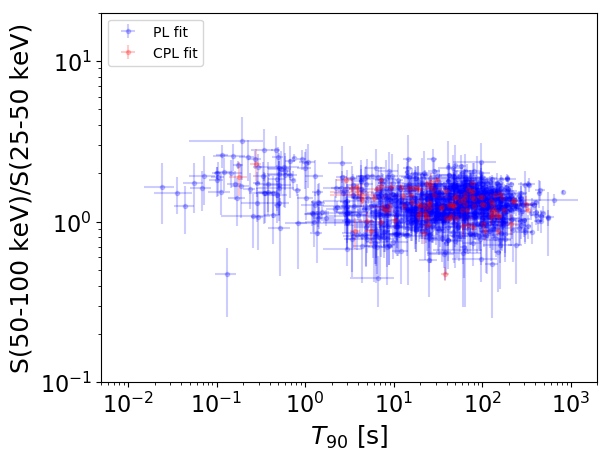
T90                                   = N/A sec.
Hardness ratio (energy fluence ratio) = N/A
S(15-50 keV) vs. S(50-150 keV) plot
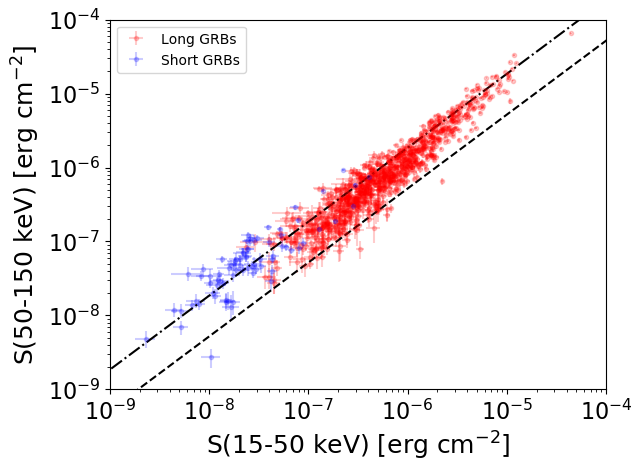
S(15-50 keV)  = N/A
S(50-150 keV) = N/A
The dash-dotted line and the dashed line traces the fluences calculated from the Band function with Epeak = 15 and 150 keV, respectively. Both lines assume a canonical values of alpha = -1 and beta = -2.5.
Mask shadow pattern
IMX = 6.851704927661812E-01, IMY = -7.363008159140418E-01
Spacecraft aspect plot
Bright source in the pre-burst/pre-slew/post-slew images
Pre-burst image of 15-350 keV band
Time interval of the image:
-40.387410 -3.816000

# RAcent  DECcent POSerr Theta    Phi  PeakCts   SNR AngSep     Name
#  [deg]    [deg]    ['] [deg]  [deg]                   [']
308.0550  41.0523    6.2  46.1  144.2   0.4671   1.9    6.5	Cyg X-3
326.3129  38.2324    7.2  33.9  132.4   0.2091   1.6    8.5	Cyg X-2
  0.5913  -2.9177    2.3  45.1   47.0   1.3785   4.9  178.6	UNKNOWN
 24.5764  26.3927    2.5  18.8   -9.2   0.3285   4.6 ------	UNKNOWN
 30.4738  41.7461    2.6  14.8  -65.8   0.3226   4.5 ------	UNKNOWN
 58.5222   4.6416    2.6  56.2  -30.1   1.9163   4.4 ------	UNKNOWN
Pre-slew background subtracted image of 15-350 keV band
Time interval of the image:
-3.816000 12.012600

# RAcent  DECcent POSerr Theta    Phi  PeakCts   SNR AngSep     Name
#  [deg]    [deg]    ['] [deg]  [deg]                   [']
308.0463  40.8408   10.3  46.2  144.0  -0.7500  -1.1    7.3	Cyg X-3
326.1673  38.3360   61.4  34.0  132.7  -0.1015  -0.2    0.9	Cyg X-2
  0.5286  -2.9255    0.5  45.2   47.1  49.6999  24.6  178.4	UNKNOWN
325.0491  44.2223    3.1  33.2  143.3   1.6391   3.8 ------	UNKNOWN
288.0484  66.7198    3.4  49.9 -178.2   1.1190   3.4 ------	UNKNOWN
293.7605  81.4080    2.7  47.3 -158.8   0.9713   4.3 ------	UNKNOWN
 46.7525  38.3379    2.5  27.6  -63.3   0.6485   4.5 ------	UNKNOWN
 52.2613   3.0117    3.2  53.4  -23.0   1.1711   3.6 ------	UNKNOWN
 51.8461  10.8020    4.0  47.2  -29.1   0.7866   2.9 ------	UNKNOWN
Post-slew image of 15-350 keV band
Time interval of the image:
75.412600 962.152000

# RAcent  DECcent POSerr Theta    Phi  PeakCts   SNR AngSep     Name
#  [deg]    [deg]    ['] [deg]  [deg]                   [']
326.2049  38.1540    3.9  51.9  167.8   7.3716   3.0   10.2	Cyg X-2
  0.5161  -2.9337    0.4   0.0  108.0  15.5100  26.0  178.7	UNKNOWN
350.3084  46.5312    3.0  50.3 -167.1   6.7565   3.9 ------	UNKNOWN