Analysis Summary
Notes:
- 1) No attempt has been made to eliminate the non-significant decimal places.
- 2) This batgrbproduct analysis is done using the HEASARC data.
- 3) This batgrbproduct analysis is using the flight position for the mask-weighting calculation.
======================================================================
                  BAT GRB EVENT DATA PROCESSING REPORT
    Process Script Ver: batgrbproduct v2.46
    Process Start Time: Mon Aug  6 18:19:31 EDT 2018
             Host Name: bat1
   Current Working Dir: /local/data/bat1/alien/Swift_3rdBATcatalog/event/batevent_reproc/trigger848932
======================================================================

  Trigger: 00848932      Segment: 000

  BAT Trigger Time: 553818258.944   [s; MET]
      Trigger Stop: 553818259.968   [s; MET]
               UTC: 2018-07-20T22:23:57.647680    [includes UTCF correction]
       Where From?: TDRSS position message

  BAT
    RA: 265.623311909688   Dec: -26.5838055962637  [deg; J2000]

     Catalogged Source?: NO
     Point Source?:      YES
     GRB Indicated?:     YES    [ by BAT flight software ]
     Image S/N Ratio:    9.38
     Image Trigger?:     NO
     Rate S/N Ratio:     18.6010752377383  [ if not an image trigger ]
     Image S/N Ratio:    9.38

  Analysis Position:   [ source = BAT ]
    RA: 265.623311909688   Dec: -26.5838055962637  [deg; J2000]

  Refined Position:   [ source = BAT pre-slew burst ]
    RA: 265.65478018523   Dec: -26.6330597934651  [deg; J2000]
        { 17h 42m 37.1s , -26d 37' 59.0" }
         +/- 1.63943636821766 [arcmin] (estimated 90% radius based on SNR)
         +/- 0.574202004641546 [arcmin] (formal 1-sigma fit error)
    SNR: 15.0110772040885

  Angular difference between the analysis and refined position is 3.403422 arcmin

  Partial Coding Fraction: 0.984375    [ including projection effects ]

  Duration
     T90: 122.987999916077 +/- 31.6700540667226
        Measured from: -112.22000002861
                   to: 10.7679998874664     [s; relative to TRIGTIME]
     T50: 40.8039999008179 +/- 29.5499460902793
        Measured from: -37.2039999961853
                   to: 3.59999990463257     [s; relative to TRIGTIME]


  Fluence
     Peak Flux  (peak 1 second)
        Measured from: 3.22000002861023
                   to: 4.22000002861023     [s; relative to TRIGTIME]
     Total Fluence
        Measured from: -150.519999980927
                   to: 13.444000005722     [s; relative to TRIGTIME]

             Band 1     Band 2     Band 3     Band 4
              15-25      25-50     50-100    100-350     keV
 Total     0.943616   1.286482   1.051983   0.302394
           0.090618   0.083619   0.071488   0.062669 [error]
 Peak      0.035440   0.050664   0.048450   0.017851
           0.007452   0.007331   0.006379   0.005432 [error]

     [ fluence units of on-axis counts / fully illuminated detector ]

======================================================================


====== Table of the duration information =============================

        Value   tstart    tstop
T100  163.964 -150.520   13.444
T90   122.988 -112.220   10.768
T50    40.804  -37.204    3.600
Peak    1.000    3.220    4.220


====== Spectral Analysis Summary =====================================

Model      : spectral model: simple power-law (PL) and cutoff power-law (CPL)
Ph_index   : photon index: E^{Ph_index}
Ph_90err   : 90% error of the photon index
Epeak      : Epeak in keV
Epeak_90err: 90% error of Epeak
Norm       : normalization at 50 keV in both the PL model and CPL model
Nomr_90err : 90% error of the normalization
chi2       : Chi-Squared
dof        : degree of freedo

=== Time-averaged spectral analysis ===
(Best model with acceptable fit: PL)

Model Ph_index Ph_90err_low Ph_90err_hi  Epeak  Epeak_90err_low  Epeak_90err_hi  Norm       Nomr_90err_low    Norm_90err_hi    chi2    dof
PL      -1.388    -0.131      0.131       -           -               -         1.44e-03     -9.90e-05          9.89e-05      53.030   57
CPL     -1.385    -0.131      0.230     9999.290    -9999.290      -9999.290      1.44e-03     -9.93e-05          4.68e-04      53.060   56


=== 1-s peak spectral analysis ===
(Best model with acceptable fit: PL)

Model Ph_index Ph_90err_low Ph_90err_hi  Epeak  Epeak_90err_low  Epeak_90err_hi  Norm       Nomr_90err_low    Norm_90err_hi    chi2    dof
PL      -1.239     -0.243     0.248       -           -               -         1.00e-02     -1.38e-03          1.38e-03      62.790   57
CPL     -0.831     -0.532     1.148      156.459    -156.459      -156.459      1.55e-02     -6.68e-03          3.47e-02      62.250   56


=== Fluence/Peak Flux Summary ===

              Model    Band1     Band2     Band3     Band4     Band5     Total
                       15-25     25-50    50-100    100-350    15-150    15-350    keV
Fluence         PL   2.71e-07  5.33e-07  8.15e-07  2.72e-06  2.28e-06  4.33e-06   erg/cm2
      90%_error_low -3.58e-08 -4.16e-08 -7.13e-08 -5.06e-07 -1.73e-07 -5.54e-07   erg/cm2
      90%_error_hi   3.74e-08  4.12e-08  7.09e-08  5.87e-07  1.74e-07  6.21e-07   erg/cm2
Peak flux       PL   3.22e-01  3.78e-01  3.21e-01  4.60e-01  1.18e+00  1.48e+00   ph/cm2/s
      90%_error_low -8.34e-02 -6.26e-02 -5.12e-02 -1.40e-01 -1.70e-01 -2.10e-01   ph/cm2/s
      90%_error_hi   9.12e-02  6.15e-02  5.05e-02  1.75e-01  1.70e-01  2.14e-01   ph/cm2/s

Fluence        CPL   2.75e-07  5.29e-07  8.09e-07  2.90e-06  2.30e-06  4.18e-06   erg/cm2
      90%_error_low    N/A    -5.27e-08 -9.07e-08 -1.12e-06 -1.88e-07 -7.93e-07   erg/cm2
      90%_error_hi     N/A     5.99e-08  1.01e-07  6.96e-08  1.60e-07  7.35e-07   erg/cm2
Peak flux      CPL   2.92e-01  3.88e-01  3.34e-01  3.03e-01  1.16e+00  1.32e+00   ph/cm2/s
      90%_error_low -1.05e-01 -6.70e-02 -5.93e-02 -1.80e-01 -1.79e-01 -2.72e-01   ph/cm2/s
      90%_error_hi   1.11e-01  6.93e-02  6.17e-02  2.07e-01  1.79e-01  2.85e-01   ph/cm2/s

======================================================================
Image
Pre-slew 15.0-350.0 keV image (Event data)
#   RAcent    DECcent   POSerr    Theta     Phi              Peak Cts       SNR   Name
  265.6548   -26.6331   0.0128    19.1842    -2.0787         3.9701766     15.011 TRIG_00848932

Foreground time interval of the image:
-150.520  13.444 (delta_t = 163.964 [sec])
Background time interval of the image:
-239.944 -150.520 (delta_t =  89.424 [sec])
Light Curves
Note: The mask-weighted lightcurves have units of either count/det or counts/sec/det, where a det is 0.4 x 0.4 = 0.16 sq cm.
Full-time range; 1 s binning
Other quick-look light curves:
- 64 ms binning (zoomed)
- 16 ms binning (zoomed)
- 8 ms binning (zoomed)
- 2 ms binning (zoomed)
- SN=5 or 10 s binning (full-time range)
- Raw light curve
Spectra
- 64 ms binning (zoomed)
- 16 ms binning (zoomed)
- 8 ms binning (zoomed)
- 2 ms binning (zoomed)
- SN=5 or 10 s binning (full-time range)
- Raw light curve
Spectra
Notes:
- 1) The fitting includes the systematic errors.
- 2) When the burst includes telescope slew time periods, the fitting uses an average response file made from multiple 5-s response files through out the slew time plus single time preiod for the non-slew times, and weighted by the total counts in the corresponding time period using addrmf. An average response file is needed becuase a spectral fit using the pre-slew DRM will introduce some errors in both a spectral shape and a normalization if the PHA file contains a lot of the slew/post-slew time interval.
- 3) For fits to more complicated models (e.g. a power-law over a cutoff power-law), the BAT team has decided to require a chi-square improvement of more than 6 for each extra dof.
Time averaged spectrum fit using the average DRM
Power-law model
Time interval is from -150.520 sec. to   13.444 sec.

Spectral model in power-law:
------------------------------------------------------------
Parameters  : value       lower 90%   higher 90%
Photon index: -1.38805     ( -0.130523   0.131492 )
Norm@50keV  : 1.43644E-03    ( -9.89996e-05   9.89009e-05 )
------------------------------------------------------------
#Fit statistic : Chi-Squared =          53.03 using 59 PHA bins.
# Reduced chi-squared =         0.9304 for     57 degrees of freedom
# Null hypothesis probability =   6.246793e-01

Photon flux (15-150 keV)    in 164 sec: 0.174467 ( -0.012614  0.012683 ) ph/cm2/s
Energy fluence (15-150 keV)             : 2.28221e-06 ( -1.73027e-07  1.74219e-07 ) ergs/cm2
Cutoff power-law model

Time interval is from -150.520 sec. to   13.444 sec.
Spectral model in the cutoff power-law:
------------------------------------------------------------
Parameters  : value       lower 90%   higher 90%
Photon index: -1.38485     ( -0.131319   0.230498 )
Epeak [keV] : 9999.29      ( -9999.36 -9999.36 )
Norm@50keV  : 1.44160E-03    ( -9.93206e-05   0.000468238 )
------------------------------------------------------------
#Fit statistic : Chi-Squared =          53.06 using 59 PHA bins.
# Reduced chi-squared =         0.9474 for     56 degrees of freedom
# Null hypothesis probability =   5.870245e-01

Photon flux (15-150 keV)    in 164 sec: 0.175594 ( -0.021736  0.016241 ) ph/cm2/s
Energy fluence (15-150 keV)             : 2.29575e-06 ( -1.8769e-07  1.59881e-07 ) ergs/cm2
1-s peak spectrum fit
Power-law model
Time interval is from    3.220 sec. to    4.220 sec.

Spectral model in power-law:
------------------------------------------------------------
Parameters  : value       lower 90%   higher 90%
Photon index: -1.2392     ( -0.242983   0.248021 )
Norm@50keV  : 1.00362E-02    ( -0.00137969   0.00137954 )
------------------------------------------------------------
#Fit statistic : Chi-Squared =          62.79 using 59 PHA bins.
# Reduced chi-squared =          1.102 for     57 degrees of freedom
# Null hypothesis probability =   2.785608e-01

Photon flux (15-150 keV)    in 1 sec: 1.18497 ( -0.16957  0.1703 ) ph/cm2/s
Energy fluence (15-150 keV)             : 1.00742e-07 ( -1.5123e-08  1.52639e-08 ) ergs/cm2
Cutoff power-law model
Time interval is from    3.220 sec. to    4.220 sec.
Spectral model in the cutoff power-law:
------------------------------------------------------------
Parameters  : value       lower 90%   higher 90%
Photon index: -0.830551     ( -0.532459   1.14769 )
Epeak [keV] : 156.459      ( -156.459 -156.459 )
Norm@50keV  : 1.55470E-02    ( -0.00668174   0.0346775 )
------------------------------------------------------------
#Fit statistic : Chi-Squared =          62.25 using 59 PHA bins.
# Reduced chi-squared =          1.112 for     56 degrees of freedom
# Null hypothesis probability =   2.635974e-01

Photon flux (15-150 keV)    in 1 sec: 1.16083 ( -0.179316  0.17884 ) ph/cm2/s
Energy fluence (15-150 keV)             : 3.39657e-08 ( -8.28836e-09  5.75711e-09 ) ergs/cm2
Time-resolved spectra

Distribution
T90 vs. Hardness ratio plot
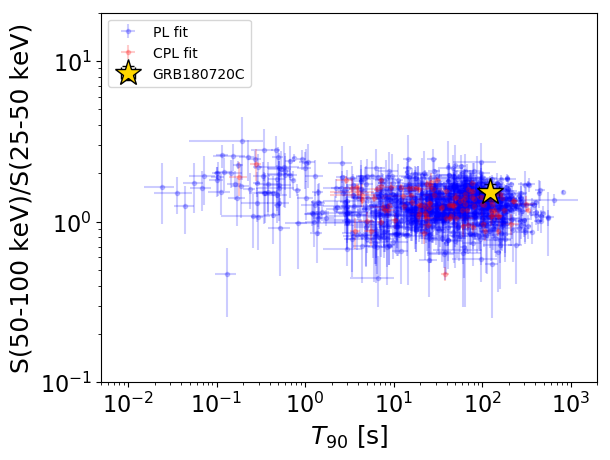
T90                                   = 122.988 sec.
Hardness ratio (energy fluence ratio) = 1.52834029288
S(15-50 keV) vs. S(50-150 keV) plot
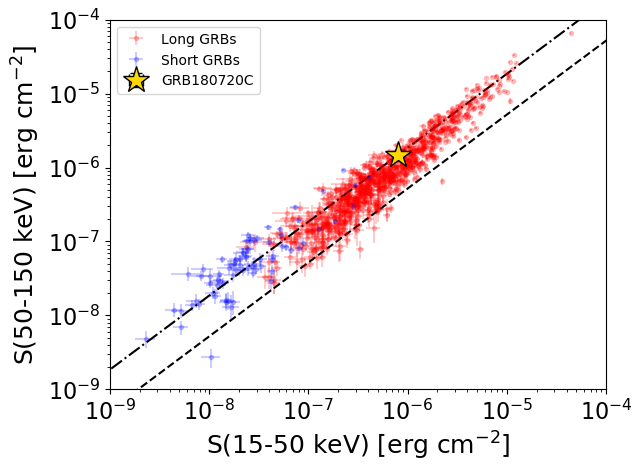
S(15-50 keV)  = 8.039045e-07
S(50-150 keV) = 1.4782971e-06
The dash-dotted line and the dashed line traces the fluences calculated from the Band function with Epeak = 15 and 150 keV, respectively. Both lines assume a canonical values of alpha = -1 and beta = -2.5.
Mask shadow pattern

IMX = 3.476987868010762E-01, IMY = 1.262000909967558E-02
Spacecraft aspect plot
Bright source in the pre-burst/pre-slew/post-slew images
Pre-burst image of 15-350 keV band
Time interval of the image:
-239.944000 -150.520000

# RAcent  DECcent POSerr Theta    Phi  PeakCts   SNR AngSep     Name
#  [deg]    [deg]    ['] [deg]  [deg]                   [']
244.9707 -15.6461    0.5  41.0  -10.6   4.5248  24.0    0.6	Sco X-1
256.2353 -37.8627    0.0  21.9  -41.2   0.0844   0.6   11.8	4U 1700-377
256.3166 -36.4666    6.7  22.1  -37.5   0.2377   1.7    6.3	GX 349+2
263.0222 -24.9504    0.0  22.1   -2.9   0.0406   0.3   12.3	GX 1+4
264.4586 -44.4523    8.0  16.1  -62.8  -0.1937  -1.4   12.2	4U 1735-44
268.1532  -1.4695    0.0  39.3   31.6   0.2320   1.0   12.9	SW J1753.5-0127
270.3531 -25.1237    5.8  17.3   11.0   0.2736   2.1    4.6	GX 5-1
270.3127 -25.5643    7.0  17.0    9.9   0.2317   1.8   10.7	GRS 1758-258
273.9598 -13.9827    5.4  25.6   34.0   0.3238   2.1    4.2	GX 17+2
275.6865 -30.3964    5.4  10.2   12.0  -0.2793  -2.1   12.5	H1820-303
285.1060 -25.0862    3.9  12.8   61.4   0.3940   3.0   10.6	HT1900.1-2455
263.0740 -33.6998    4.1  17.5  -25.2  -0.3564  -2.9    9.1	GX 354-0
251.8617   7.5511    2.1  54.5   16.8   3.8979   5.4 ------	UNKNOWN
295.7212 -26.2724    3.1  15.2  100.8   0.5128   3.7 ------	UNKNOWN
332.8590 -83.5212    2.9  48.0 -129.2   2.5345   4.1 ------	UNKNOWN
Pre-slew background subtracted image of 15-350 keV band
Time interval of the image:
-150.520000 13.444000

# RAcent  DECcent POSerr Theta    Phi  PeakCts   SNR AngSep     Name
#  [deg]    [deg]    ['] [deg]  [deg]                   [']
245.1474 -15.6692    5.7  40.8  -10.5   0.7749   2.0    9.9	Sco X-1
255.7940 -37.8720    3.9  22.3  -41.4   0.8230   3.0    9.3	4U 1700-377
256.2801 -36.4959    4.7  22.1  -37.6   0.6425   2.4    8.7	GX 349+2
262.8694 -24.7771    5.8  22.3   -2.7   0.5201   2.0    7.8	GX 1+4
264.5378 -44.5120    5.9  16.1  -63.1   0.5145   2.0    9.5	4U 1735-44
268.2389  -1.4208    5.8  39.3   31.8  -0.9528  -2.0    8.0	SW J1753.5-0127
270.2482 -24.8867    5.3  17.5   11.2   0.5707   2.2   11.7	GX 5-1
270.1785 -25.8371    3.5  16.9    9.0   0.8262   3.3    8.8	GRS 1758-258
273.9699 -13.8512   14.4  25.7   34.1  -0.2572  -0.8   11.3	GX 17+2
275.8124 -30.3369    5.5  10.2   12.7   0.5312   2.1    6.1	H1820-303
285.0991 -24.7807    6.2  13.1   61.3   0.4844   1.8    9.1	HT1900.1-2455
263.0490 -33.6782    4.0  17.6  -25.1   0.7210   2.9    9.9	GX 354-0
314.8426  -8.6224    2.6  40.3  108.7   4.7624   4.5 ------	UNKNOWN
265.6547 -26.6331    0.8  19.2   -2.1   3.9693  15.1 ------	UNKNOWN
249.3065 -15.8102    2.4  37.7   -6.4   1.5825   4.8 ------	UNKNOWN
Post-slew image of 15-350 keV band
Time interval of the image:
78.956610 424.056600

# RAcent  DECcent POSerr Theta    Phi  PeakCts   SNR AngSep     Name
#  [deg]    [deg]    ['] [deg]  [deg]                   [']
244.9785 -15.6438    0.2  22.1  -61.0  21.8353  47.4    0.2	Sco X-1
256.0941 -37.9114    9.9  13.9 -143.4   0.4146   1.2    6.5	4U 1700-377
256.3320 -36.3633    3.9  12.6 -139.7   1.0584   3.0    6.1	GX 349+2
262.9440 -24.8980    6.8   3.0  -52.8   0.6521   1.7    9.8	GX 1+4
264.8666 -44.3202   12.3  17.8 -174.6   0.3192   0.9    9.4	4U 1735-44
268.4913  -1.3083    4.6  25.4   10.2  -0.9530  -2.5   11.4	SW J1753.5-0127
270.2355 -25.0761    3.8   4.4   74.8   1.0308   3.0    2.7	GX 5-1
270.4652 -25.7018   12.6   4.4   83.4   0.3154   1.0    9.1	GRS 1758-258
274.1553 -14.0126    5.1  14.9   37.6   0.8388   2.2    8.8	GX 17+2
275.9102 -30.3993    6.7   9.8  119.0   0.6479   1.7    2.1	H1820-303
284.9068 -25.0921    0.0  17.4   93.0   0.1560   0.4   12.5	HT1900.1-2455
288.9199  10.9844    6.8  43.8   37.6   1.5897   1.7    7.5	GRS 1915+105
262.8028 -33.6902    0.0   7.5 -158.1   0.7743   2.0   12.7	GX 354-0
282.3330   8.9940    3.4  39.1   30.3   2.1927   3.4 ------	UNKNOWN
277.4194  15.9895    2.2  44.1   19.9   3.6941   5.3 ------	UNKNOWN
284.9384 -30.4398    2.8  17.4  111.0   1.5898   4.1 ------	UNKNOWN
275.1136   7.1620    2.1  34.9   20.1   2.8455   5.4 ------	UNKNOWN
243.3196  25.6923    3.0  56.5  -20.7   5.7389   3.9 ------	UNKNOWN