Analysis Summary
Notes:
- 1) No attempt has been made to eliminate the non-significant decimal places.
- 2) This batgrbproduct analysis is done using the HEASARC data.
- 3) This batgrbproduct analysis is using the flight position for the mask-weighting calculation.
======================================================================
                  BAT GRB EVENT DATA PROCESSING REPORT
    Process Script Ver: batgrbproduct v2.46
    Process Start Time: Fri Oct 26 17:11:16 EDT 2018
             Host Name: bat1
   Current Working Dir: /local/data/bat1/alien/Swift_3rdBATcatalog/event/batevent_reproc/trigger850231
======================================================================

  Trigger: 00850231      Segment: 000

  BAT Trigger Time: 554393750.016   [s; MET]
      Trigger Stop: 554393751.04   [s; MET]
               UTC: 2018-07-27T14:15:28.684460    [includes UTCF correction]
       Where From?: TDRSS position message

  BAT
    RA: 346.638589844321   Dec: -63.0635521810573  [deg; J2000]

     Catalogged Source?: NO
     Point Source?:      YES
     GRB Indicated?:     YES    [ by BAT flight software ]
     Image S/N Ratio:    18.03
     Image Trigger?:     NO
     Rate S/N Ratio:     49.2138191974571  [ if not an image trigger ]
     Image S/N Ratio:    18.03

  Analysis Position:   [ source = BAT ]
    RA: 346.638589844321   Dec: -63.0635521810573  [deg; J2000]

  Refined Position:   [ source = BAT pre-slew burst ]
    RA: 346.638682341704   Dec: -63.066072614268  [deg; J2000]
        { 23h 06m 33.3s , -63d 03' 57.9" }
         +/- 1.11315718085439 [arcmin] (estimated 90% radius based on SNR)
         +/- 0.378013336151439 [arcmin] (formal 1-sigma fit error)
    SNR: 26.0981128886752

  Angular difference between the analysis and refined position is 0.151247 arcmin

  Partial Coding Fraction: 0.859375    [ including projection effects ]

  Duration
     T90: 1.05599999427795 +/- 0.229120086267606
        Measured from: 0.0239999294281006
                   to: 1.07999992370605     [s; relative to TRIGTIME]
     T50: 0.452000021934509 +/- 0.0707672428107233
        Measured from: 0.25599992275238
                   to: 0.70799994468689     [s; relative to TRIGTIME]


  Fluence
     Peak Flux  (peak 1 second)
        Measured from: -0.0520000457763672
                   to: 0.947999954223633     [s; relative to TRIGTIME]
     Total Fluence
        Measured from: -0.0520000457763672
                   to: 1.33200001716614     [s; relative to TRIGTIME]

             Band 1     Band 2     Band 3     Band 4
              15-25      25-50     50-100    100-350     keV
 Total     0.148990   0.193082   0.134374   0.018533
           0.009851   0.010739   0.009288   0.006924 [error]
 Peak      0.129810   0.175371   0.126329   0.017944
           0.008712   0.009849   0.008540   0.006074 [error]

     [ fluence units of on-axis counts / fully illuminated detector ]

======================================================================


====== Table of the duration information =============================

        Value   tstart    tstop
T100    1.384   -0.052    1.332
T90     1.056    0.024    1.080
T50     0.452    0.256    0.708
Peak    1.000   -0.052    0.948


====== Spectral Analysis Summary =====================================

Model      : spectral model: simple power-law (PL) and cutoff power-law (CPL)
Ph_index   : photon index: E^{Ph_index}
Ph_90err   : 90% error of the photon index
Epeak      : Epeak in keV
Epeak_90err: 90% error of Epeak
Norm       : normalization at 50 keV in both the PL model and CPL model
Nomr_90err : 90% error of the normalization
chi2       : Chi-Squared
dof        : degree of freedo

=== Time-averaged spectral analysis ===
(Best model with acceptable fit: CPL)

Model Ph_index Ph_90err_low Ph_90err_hi  Epeak  Epeak_90err_low  Epeak_90err_hi  Norm       Nomr_90err_low    Norm_90err_hi    chi2    dof
PL      -1.599    -0.106      0.105       -           -               -         2.27e-02     -1.51e-03          1.50e-03      57.460   57
CPL     -0.588    -0.484      0.546       67.627      -9.583        20.056      7.58e-02     -3.27e-02          6.75e-02      43.230   56


=== 1-s peak spectral analysis ===
(Best model with acceptable fit: CPL)

Model Ph_index Ph_90err_low Ph_90err_hi  Epeak  Epeak_90err_low  Epeak_90err_hi  Norm       Nomr_90err_low    Norm_90err_hi    chi2    dof
PL      -1.540     -0.103     0.102       -           -               -         2.87e-02     -1.89e-03          1.88e-03      69.570   57
CPL     -0.449     -0.480     0.542       69.677      -9.466        18.474      1.05e-01     -4.45e-02          9.11e-02      52.330   56


=== Fluence/Peak Flux Summary ===

              Model    Band1     Band2     Band3     Band4     Band5     Total
                       15-25     25-50    50-100    100-350    15-150    15-350    keV
Fluence         PL   4.40e-08  7.62e-08  1.01e-07  2.71e-07  2.94e-07  4.91e-07   erg/cm2
      90%_error_low -4.31e-09 -4.87e-09 -8.73e-09 -4.55e-08 -2.10e-08 -5.39e-08   erg/cm2
      90%_error_hi   4.42e-09  4.87e-09  8.73e-09  5.10e-08  2.11e-08  5.82e-08   erg/cm2
Peak flux       PL   1.23e+00  1.21e+00  8.29e-01  8.98e-01  3.62e+00  4.16e+00   ph/cm2/s
      90%_error_low -1.22e-01 -7.90e-02 -6.79e-02 -1.37e-01 -2.30e-01 -2.67e-01   ph/cm2/s
      90%_error_hi   1.25e-01  7.88e-02  6.76e-02  1.50e-01  2.30e-01  2.67e-01   ph/cm2/s

Fluence        CPL   3.78e-08  8.48e-08  1.05e-07  7.65e-08  2.74e-07  3.05e-07   erg/cm2
      90%_error_low -5.22e-09 -6.37e-09 -1.01e-08 -3.11e-08 -2.25e-08 -3.79e-08   erg/cm2
      90%_error_hi   5.28e-09  6.52e-09  1.01e-08  5.47e-08  2.29e-08  5.69e-08   erg/cm2
Peak flux      CPL   1.02e+00  1.34e+00  9.00e-01  3.21e-01  3.50e+00  3.59e+00   ph/cm2/s
      90%_error_low -1.48e-01 -1.00e-01 -8.03e-02 -1.13e-01 -2.37e-01 -2.65e-01   ph/cm2/s
      90%_error_hi   1.51e-01  1.03e-01  8.13e-02  1.67e-01  2.37e-01  2.79e-01   ph/cm2/s

======================================================================
Image
Pre-slew 15.0-350.0 keV image (Event data)
#   RAcent    DECcent   POSerr    Theta     Phi              Peak Cts       SNR   Name
  346.6387   -63.0661   0.0074    16.9953    53.7999         0.5245691     26.098 TRIG_00850231

Foreground time interval of the image:
 -0.052   1.332 (delta_t =   1.384 [sec])
Background time interval of the image:
-239.016  -0.052 (delta_t = 238.964 [sec])
Light Curves
Note: The mask-weighted lightcurves have units of either count/det or counts/sec/det, where a det is 0.4 x 0.4 = 0.16 sq cm.
Full-time range; 1 s binning
Other quick-look light curves:
- 64 ms binning (zoomed)
- 16 ms binning (zoomed)
- 8 ms binning (zoomed)
- 2 ms binning (zoomed)
- SN=5 or 10 s binning (full-time range)
- Raw light curve
Spectra
- 64 ms binning (zoomed)
- 16 ms binning (zoomed)
- 8 ms binning (zoomed)
- 2 ms binning (zoomed)
- SN=5 or 10 s binning (full-time range)
- Raw light curve
Spectra
Notes:
- 1) The fitting includes the systematic errors.
- 2) When the burst includes telescope slew time periods, the fitting uses an average response file made from multiple 5-s response files through out the slew time plus single time preiod for the non-slew times, and weighted by the total counts in the corresponding time period using addrmf. An average response file is needed becuase a spectral fit using the pre-slew DRM will introduce some errors in both a spectral shape and a normalization if the PHA file contains a lot of the slew/post-slew time interval.
- 3) For fits to more complicated models (e.g. a power-law over a cutoff power-law), the BAT team has decided to require a chi-square improvement of more than 6 for each extra dof.
Time averaged spectrum fit using the average DRM
Power-law model
Time interval is from   -0.052 sec. to    1.332 sec.

Spectral model in power-law:
------------------------------------------------------------
Parameters  : value       lower 90%   higher 90%
Photon index: -1.59876     ( -0.106402   0.104776 )
Norm@50keV  : 2.27103E-02    ( -0.00151234   0.00150414 )
------------------------------------------------------------
#Fit statistic : Chi-Squared =          57.46 using 59 PHA bins.
# Reduced chi-squared =          1.008 for     57 degrees of freedom
# Null hypothesis probability =   4.580432e-01

Photon flux (15-150 keV)    in 1.384 sec: 2.91736 ( -0.18526  0.18537 ) ph/cm2/s
Energy fluence (15-150 keV)             : 2.94034e-07 ( -2.09874e-08  2.11446e-08 ) ergs/cm2
Cutoff power-law model
Time interval is from   -0.052 sec. to    1.332 sec.
Spectral model in the cutoff power-law:
------------------------------------------------------------
Parameters  : value       lower 90%   higher 90%
Photon index: -0.588052     ( -0.484203   0.545776 )
Epeak [keV] : 67.6269      ( -9.58309 20.0558 )
Norm@50keV  : 7.57856E-02    ( -0.0326754   0.0674652 )
------------------------------------------------------------
#Fit statistic : Chi-Squared =          43.23 using 59 PHA bins.
# Reduced chi-squared =         0.7720 for     56 degrees of freedom
# Null hypothesis probability =   8.940943e-01

Photon flux (15-150 keV)    in 1.384 sec: 2.80723 ( -0.19251  0.19236 ) ph/cm2/s
Energy fluence (15-150 keV)             : 2.74377e-07 ( -2.253e-08  2.28968e-08 ) ergs/cm2
1-s peak spectrum fit
Power-law model
Time interval is from   -0.052 sec. to    0.948 sec.

Spectral model in power-law:
------------------------------------------------------------
Parameters  : value       lower 90%   higher 90%
Photon index: -1.54038     ( -0.103043   0.101711 )
Norm@50keV  : 2.86945E-02    ( -0.00188634   0.00187848 )
------------------------------------------------------------
#Fit statistic : Chi-Squared =          69.57 using 59 PHA bins.
# Reduced chi-squared =          1.220 for     57 degrees of freedom
# Null hypothesis probability =   1.227152e-01

Photon flux (15-150 keV)    in 1 sec: 3.62263 ( -0.23014  0.23025 ) ph/cm2/s
Energy fluence (15-150 keV)             : 2.70545e-07 ( -1.92407e-08  1.93695e-08 ) ergs/cm2
Cutoff power-law model
Time interval is from   -0.052 sec. to    0.948 sec.
Spectral model in the cutoff power-law:
------------------------------------------------------------
Parameters  : value       lower 90%   higher 90%
Photon index: -0.44936     ( -0.479801   0.541507 )
Epeak [keV] : 69.6771      ( -9.46611 18.4737 )
Norm@50keV  : 0.104544    ( -0.0445468   0.0910979 )
------------------------------------------------------------
#Fit statistic : Chi-Squared =          52.33 using 59 PHA bins.
# Reduced chi-squared =         0.9344 for     56 degrees of freedom
# Null hypothesis probability =   6.146787e-01

Photon flux (15-150 keV)    in 1 sec: 3.49799 ( -0.23704  0.23674 ) ph/cm2/s
Energy fluence (15-150 keV)             : 2.53087e-07 ( -2.04654e-08  2.07297e-08 ) ergs/cm2
Time-resolved spectra
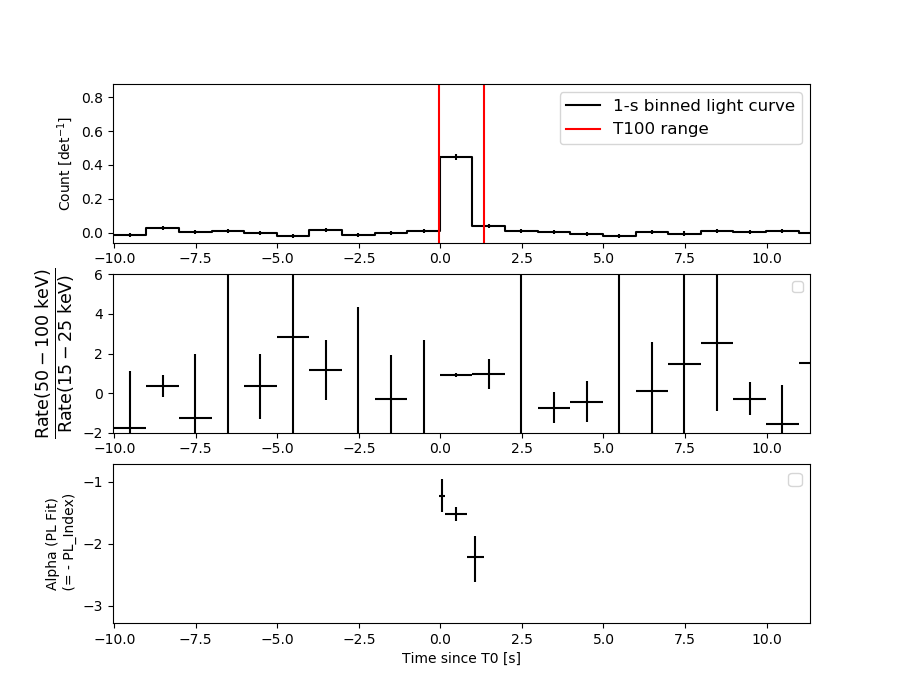
Distribution
T90 vs. Hardness ratio plot
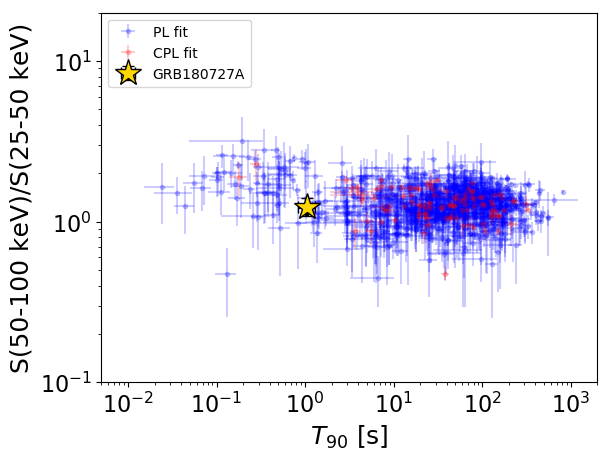
T90                                   = 1.056 sec.
Hardness ratio (energy fluence ratio) = 1.24273963622
S(15-50 keV) vs. S(50-150 keV) plot
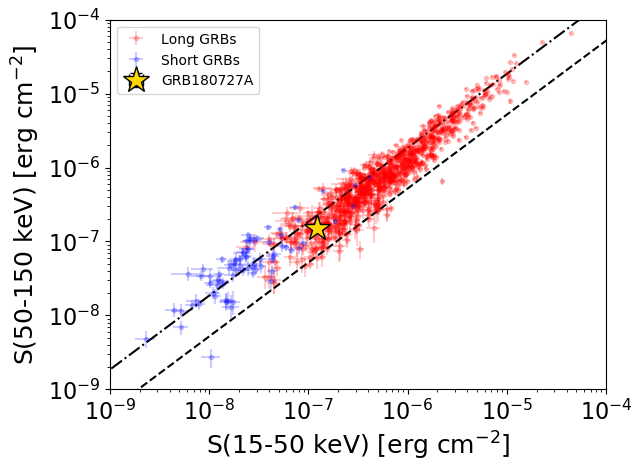
S(15-50 keV)  = 1.2258668e-07
S(50-150 keV) = 1.5179096e-07
The dash-dotted line and the dashed line traces the fluences calculated from the Band function with Epeak = 15 and 150 keV, respectively. Both lines assume a canonical values of alpha = -1 and beta = -2.5.
Mask shadow pattern
IMX = 1.805139349500686E-01, IMY = -2.466397747629926E-01
Spacecraft aspect plot
Bright source in the pre-burst/pre-slew/post-slew images
Pre-burst image of 15-350 keV band
Time interval of the image:
-239.016000 -0.052000

# RAcent  DECcent POSerr Theta    Phi  PeakCts   SNR AngSep     Name
#  [deg]    [deg]    ['] [deg]  [deg]                   [']
170.0935 -60.5779   25.5  58.2  -24.4   0.6764   0.5    7.1	Cen X-3
186.8030 -62.7862    4.4  57.9  -14.8   3.0083   2.6    4.1	GX 301-2
303.6396 -58.1132    2.5  38.2   49.4   2.2344   4.6 ------	UNKNOWN
 56.0102 -39.8771    3.0  29.1 -122.2   1.2008   3.9 ------	UNKNOWN
 68.9322 -48.9315    3.2  29.2  -95.5   1.2710   3.6 ------	UNKNOWN
 60.5981 -16.9365    2.7  50.9 -135.4   6.1991   4.3 ------	UNKNOWN
Pre-slew background subtracted image of 15-350 keV band
Time interval of the image:
-0.052000 1.332000

# RAcent  DECcent POSerr Theta    Phi  PeakCts   SNR AngSep     Name
#  [deg]    [deg]    ['] [deg]  [deg]                   [']
170.5887 -60.5932    3.9  58.3  -24.2  -0.3032  -3.0    8.2	Cen X-3
186.4959 -62.7253    4.7  58.0  -14.9   0.2104   2.4    5.2	GX 301-2
331.1148 -36.1819    2.3  39.2   95.5   0.3598   5.1 ------	UNKNOWN
  7.6073  -9.3519    2.0  50.5  155.6   0.4032   5.7 ------	UNKNOWN
346.6387 -63.0661    0.4  17.0   53.8   0.5246  26.1 ------	UNKNOWN
 55.0236 -36.3595    2.1  31.5 -127.5   0.1300   5.6 ------	UNKNOWN
114.3485 -56.5370    2.3  45.8  -57.3   0.3397   5.0 ------	UNKNOWN
Post-slew image of 15-350 keV band
Time interval of the image:
55.684610 363.104000

# RAcent  DECcent POSerr Theta    Phi  PeakCts   SNR AngSep     Name
#  [deg]    [deg]    ['] [deg]  [deg]                   [']
186.8624 -62.8153    6.1  53.2  -28.0  -1.1028  -1.9    6.3	GX 301-2
264.8770 -44.4279    5.3  47.9   32.9  -1.4674  -2.2    5.9	4U 1735-44
332.4278 -21.8234    3.0  42.4  120.9   2.7713   3.9 ------	UNKNOWN
249.4250 -44.6232    3.0  54.1   21.3   3.9331   3.9 ------	UNKNOWN
  6.6332 -29.9270    2.7  35.5  171.3   1.1076   4.2 ------	UNKNOWN
 72.6127 -55.7787    4.7  41.0  -98.2   2.0539   2.5 ------	UNKNOWN