Analysis Summary
Notes:
- 1) No attempt has been made to eliminate the non-significant decimal places.
- 2) This batgrbproduct analysis is done using the HEASARC data.
- 3) This batgrbproduct analysis is using the flight position for the mask-weighting calculation.
======================================================================
                  BAT GRB EVENT DATA PROCESSING REPORT
    Process Script Ver: batgrbproduct v2.46
    Process Start Time: Fri Oct 19 18:55:49 EDT 2018
             Host Name: bat1
   Current Working Dir: /local/data/bat1/alien/Swift_3rdBATcatalog/event/batevent_reproc/trigger850471
======================================================================

  Trigger: 00850471      Segment: 000

  BAT Trigger Time: 554491762.048   [s; MET]
      Trigger Stop: 554491762.56   [s; MET]
               UTC: 2018-07-28T17:29:00.710460    [includes UTCF correction]
       Where From?: TDRSS position message

  BAT
    RA: 253.569321153668   Dec: -54.0307606838017  [deg; J2000]

     Catalogged Source?: NO
     Point Source?:      YES
     GRB Indicated?:     YES    [ by BAT flight software ]
     Image S/N Ratio:    10.51
     Image Trigger?:     NO
     Rate S/N Ratio:     19.6468827043885  [ if not an image trigger ]
     Image S/N Ratio:    10.51

  Analysis Position:   [ source = BAT ]
    RA: 253.569321153668   Dec: -54.0307606838017  [deg; J2000]

  Refined Position:   [ source = BAT pre-slew burst ]
    RA: 253.573629224443   Dec: -54.037142488569  [deg; J2000]
        { 16h 54m 17.7s , -54d 02' 13.7" }
         +/- 0.498594483330955 [arcmin] (estimated 90% radius based on SNR)
         +/- 0.161336818625638 [arcmin] (formal 1-sigma fit error)
    SNR: 82.206793742066

  Angular difference between the analysis and refined position is 0.411904 arcmin

  Partial Coding Fraction: 0.5703125    [ including projection effects ]

  Duration
     T90: 8.6839998960495 +/- 0.297321378474679
        Measured from: 11.6720000505447
                   to: 20.3559999465942     [s; relative to TRIGTIME]
     T50: 2.46399998664856 +/- 0.035777160144337
        Measured from: 12.6840000152588
                   to: 15.1480000019073     [s; relative to TRIGTIME]


  Fluence
     Peak Flux  (peak 1 second)
        Measured from: 12.6119999885559
                   to: 13.6119999885559     [s; relative to TRIGTIME]
     Total Fluence
        Measured from: -0.24399995803833
                   to: 36.5119999647141     [s; relative to TRIGTIME]

             Band 1     Band 2     Band 3     Band 4
              15-25      25-50     50-100    100-350     keV
 Total    18.317970  20.133705  11.806000   2.307044
           0.102586   0.106955   0.087485   0.057004 [error]
 Peak      4.769779   5.525946   3.453081   0.768668
           0.046121   0.049667   0.040899   0.022944 [error]

     [ fluence units of on-axis counts / fully illuminated detector ]

======================================================================


====== Table of the duration information =============================

        Value   tstart    tstop
T100   36.756   -0.244   36.512
T90     8.684   11.672   20.356
T50     2.464   12.684   15.148
Peak    1.000   12.612   13.612


====== Spectral Analysis Summary =====================================

Model      : spectral model: simple power-law (PL) and cutoff power-law (CPL)
Ph_index   : photon index: E^{Ph_index}
Ph_90err   : 90% error of the photon index
Epeak      : Epeak in keV
Epeak_90err: 90% error of Epeak
Norm       : normalization at 50 keV in both the PL model and CPL model
Nomr_90err : 90% error of the normalization
chi2       : Chi-Squared
dof        : degree of freedo

=== Time-averaged spectral analysis ===
(Best model with acceptable fit: PL)

Model Ph_index Ph_90err_low Ph_90err_hi  Epeak  Epeak_90err_low  Epeak_90err_hi  Norm       Nomr_90err_low    Norm_90err_hi    chi2    dof
PL      -1.972    -0.026      0.026       -           -               -         8.88e-02     -1.19e-03          1.19e-03      44.770   57
CPL     -1.908    -0.100      0.103       88.337     -24.649       -88.337      9.43e-02     -4.43e-03          9.20e-03      43.610   56


=== 1-s peak spectral analysis ===
(Best model with acceptable fit: PL)

Model Ph_index Ph_90err_low Ph_90err_hi  Epeak  Epeak_90err_low  Epeak_90err_hi  Norm       Nomr_90err_low    Norm_90err_hi    chi2    dof
PL      -1.879     -0.031     0.031       -           -               -         9.25e-01     -1.48e-02          1.48e-02      42.730   57
CPL     -1.860     -0.048     0.120      430.784      N/A           N/A         9.43e-01        N/A               N/A         42.650   56


=== Fluence/Peak Flux Summary ===

              Model    Band1     Band2     Band3     Band4     Band5     Total
                       15-25     25-50    50-100    100-350    15-150    15-350    keV
Fluence         PL   6.51e-06  8.98e-06  9.15e-06  1.70e-05  3.01e-05  4.16e-05   erg/cm2
      90%_error_low -1.98e-07 -1.61e-07 -1.29e-07 -5.55e-07 -4.13e-07 -6.03e-07   erg/cm2
      90%_error_hi   2.01e-07  1.61e-07  1.29e-07  5.68e-07  4.13e-07  6.07e-07   erg/cm2
Peak flux       PL   5.49e+01  4.42e+01  2.40e+01  1.91e+01  1.32e+02  1.42e+02   ph/cm2/s
      90%_error_low -1.94e+00 -9.28e-01 -4.23e-01 -7.33e-01 -2.85e+00 -2.70e+00   ph/cm2/s
      90%_error_hi   1.98e+00  9.28e-01  4.22e-01  7.50e-01  2.87e+00  2.72e+00   ph/cm2/s

Fluence        CPL   6.37e-06  8.98e-06  9.21e-06  1.60e-05  2.99e-05  4.05e-05   erg/cm2
      90%_error_low -2.85e-07 -1.62e-07 -1.59e-07 -1.51e-06 -4.64e-07 -1.65e-06   erg/cm2
      90%_error_hi   2.78e-07  1.62e-07  1.59e-07  1.23e-06  4.65e-07  1.43e-06   erg/cm2
Peak flux      CPL     N/A      N/A      N/A      N/A      N/A      N/A     ph/cm2/s
      90%_error_low -1.94e+00 -9.28e-01 -4.23e-01 -7.33e-01 -2.85e+00 -2.70e+00   ph/cm2/s
      90%_error_hi   1.98e+00  9.28e-01  4.22e-01  7.50e-01  2.87e+00  2.72e+00   ph/cm2/s

======================================================================
Image
Pre-slew 15.0-350.0 keV image (Event data)
#   RAcent    DECcent   POSerr    Theta     Phi              Peak Cts       SNR   Name
  253.5736   -54.0371   0.0023    35.8346    15.4028        54.2269690     82.207 TRIG_00850471

Foreground time interval of the image:
 -0.244  36.512 (delta_t =  36.756 [sec])
Background time interval of the image:
-239.048  -0.244 (delta_t = 238.804 [sec])
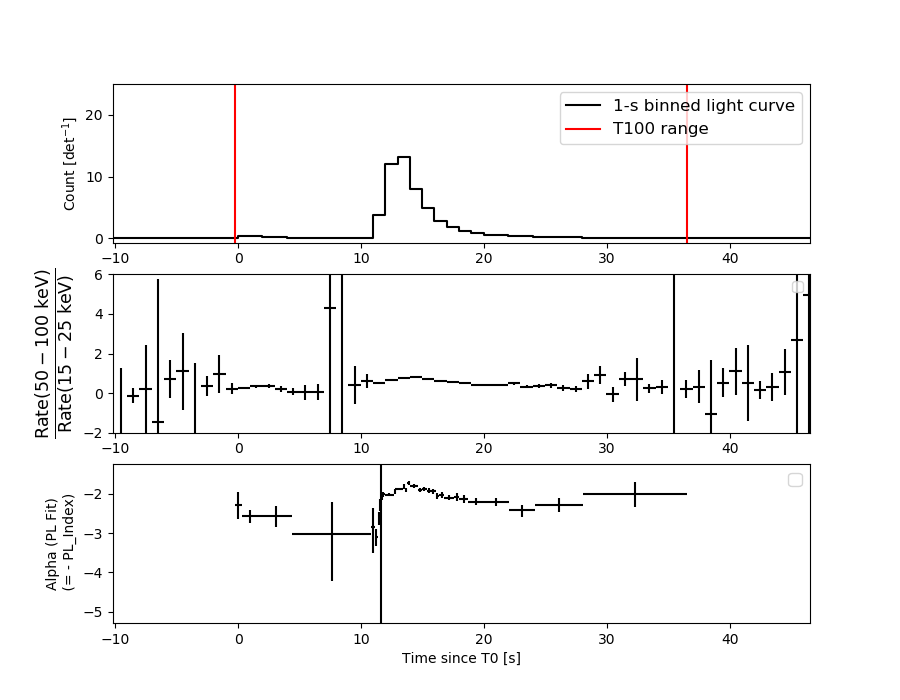
Light Curves
Note: The mask-weighted lightcurves have units of either count/det or counts/sec/det, where a det is 0.4 x 0.4 = 0.16 sq cm.
Full-time range; 1 s binning
Other quick-look light curves:
- 64 ms binning (zoomed)
- 16 ms binning (zoomed)
- 8 ms binning (zoomed)
- 2 ms binning (zoomed)
- SN=5 or 10 s binning (full-time range)
- Raw light curve
Spectra
- 64 ms binning (zoomed)
- 16 ms binning (zoomed)
- 8 ms binning (zoomed)
- 2 ms binning (zoomed)
- SN=5 or 10 s binning (full-time range)
- Raw light curve
Spectra
Notes:
- 1) The fitting includes the systematic errors.
- 2) When the burst includes telescope slew time periods, the fitting uses an average response file made from multiple 5-s response files through out the slew time plus single time preiod for the non-slew times, and weighted by the total counts in the corresponding time period using addrmf. An average response file is needed becuase a spectral fit using the pre-slew DRM will introduce some errors in both a spectral shape and a normalization if the PHA file contains a lot of the slew/post-slew time interval.
- 3) For fits to more complicated models (e.g. a power-law over a cutoff power-law), the BAT team has decided to require a chi-square improvement of more than 6 for each extra dof.
Time averaged spectrum fit using the average DRM
Power-law model
Time interval is from   -0.244 sec. to   36.512 sec.

Spectral model in power-law:
------------------------------------------------------------
Parameters  : value       lower 90%   higher 90%
Photon index: -1.97205     ( -0.0256071   0.0256499 )
Norm@50keV  : 8.88207E-02    ( -0.00119416   0.00119252 )
------------------------------------------------------------
#Fit statistic : Chi-Squared =          44.77 using 59 PHA bins.
# Reduced chi-squared =         0.7854 for     57 degrees of freedom
# Null hypothesis probability =   8.801782e-01

Photon flux (15-150 keV)    in 36.76 sec: 13.1557 ( -0.2603  0.2623 ) ph/cm2/s
Energy fluence (15-150 keV)             : 3.00764e-05 ( -4.1334e-07  4.12793e-07 ) ergs/cm2
Cutoff power-law model
Time interval is from   -0.244 sec. to   36.512 sec.
Spectral model in the cutoff power-law:
------------------------------------------------------------
Parameters  : value       lower 90%   higher 90%
Photon index: -1.90825     ( -0.100381   0.102503 )
Epeak [keV] : 88.3366      ( -24.6494 -88.3366 )
Norm@50keV  : 9.42692E-02    ( -0.00443166   0.00919912 )
------------------------------------------------------------
#Fit statistic : Chi-Squared =          43.61 using 59 PHA bins.
# Reduced chi-squared =         0.7787 for     56 degrees of freedom
# Null hypothesis probability =   8.861206e-01

Photon flux (15-150 keV)    in 36.76 sec:  (    ) ph/cm2/s
Energy fluence (15-150 keV)             : 2.99361e-05 ( -4.63731e-07  4.65404e-07 ) ergs/cm2
1-s peak spectrum fit
Power-law model
Time interval is from   12.612 sec. to   13.612 sec.

Spectral model in power-law:
------------------------------------------------------------
Parameters  : value       lower 90%   higher 90%
Photon index: -1.87901     ( -0.0310366   0.0310338 )
Norm@50keV  : 0.925161    ( -0.0147612   0.0147553 )
------------------------------------------------------------
#Fit statistic : Chi-Squared =          42.73 using 59 PHA bins.
# Reduced chi-squared =         0.7496 for     57 degrees of freedom
# Null hypothesis probability =   9.199135e-01

Photon flux (15-150 keV)    in 1 sec: 131.611 ( -2.854  2.872 ) ph/cm2/s
Energy fluence (15-150 keV)             : 8.50629e-06 ( -1.35624e-07  1.35625e-07 ) ergs/cm2
Cutoff power-law model
Time interval is from   12.612 sec. to   13.612 sec.
Spectral model in the cutoff power-law:
------------------------------------------------------------
Parameters  : value       lower 90%   higher 90%
Photon index: -1.85975     ( -0.0478875   0.119846 )
Epeak [keV] : 430.784      (   )
Norm@50keV  : 0.942773    (     )
------------------------------------------------------------
#Fit statistic : Chi-Squared =          42.65 using 59 PHA bins.
# Reduced chi-squared =         0.7616 for     56 degrees of freedom
# Null hypothesis probability =   9.056243e-01

Photon flux (15-150 keV)    in 1 sec:  (    ) ph/cm2/s
Energy fluence (15-150 keV)             : 8.07477e-06 ( -2.54171e-07  1.45231e-06 ) ergs/cm2
Time-resolved spectra
Distribution
T90 vs. Hardness ratio plot
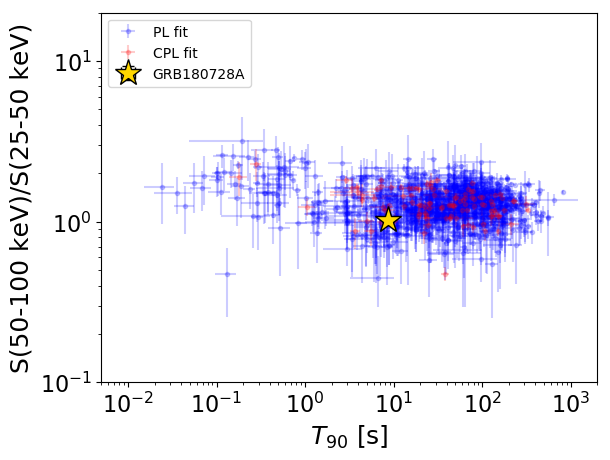
T90                                   = 8.684 sec.
Hardness ratio (energy fluence ratio) = 1.01957692048
S(15-50 keV) vs. S(50-150 keV) plot
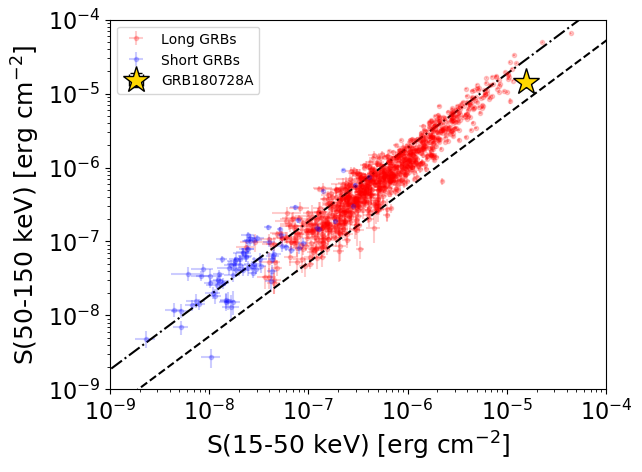
S(15-50 keV)  = 1.5484742e-05
S(50-150 keV) = 1.4591213e-05
The dash-dotted line and the dashed line traces the fluences calculated from the Band function with Epeak = 15 and 150 keV, respectively. Both lines assume a canonical values of alpha = -1 and beta = -2.5.
Mask shadow pattern
IMX = 6.962036737757912E-01, IMY = -1.918027696107422E-01
Spacecraft aspect plot
Bright source in the pre-burst/pre-slew/post-slew images
Pre-burst image of 15-350 keV band
Time interval of the image:
-239.048000 -0.244000

# RAcent  DECcent POSerr Theta    Phi  PeakCts   SNR AngSep     Name
#  [deg]    [deg]    ['] [deg]  [deg]                   [']
170.4255 -60.5979    4.3  38.1  -58.2   1.3658   2.7    3.6	Cen X-3
187.0866 -62.7626    5.9  35.2  -45.4   0.6663   2.0   11.8	GX 301-2
255.7995 -37.8456   27.7  51.3   23.0  -0.4271  -0.4    8.9	4U 1700-377
256.3260 -36.4822  472.7  52.5   23.8  -0.0318  -0.0    6.4	GX 349+2
264.9325 -44.5267    4.3  43.3   30.3   1.3736   2.7    9.3	4U 1735-44
242.8767 -55.0027    3.2  36.5    4.8   1.0866   3.6 ------	UNKNOWN
 40.1307 -29.7518    2.4  56.6  179.4   7.6049   4.9 ------	UNKNOWN
232.7111 -52.9952    3.0  40.0   -3.7   1.3410   3.9 ------	UNKNOWN
198.4931 -57.1114    2.7  39.9  -34.8   1.5030   4.3 ------	UNKNOWN
Pre-slew background subtracted image of 15-350 keV band
Time interval of the image:
-0.244000 36.512000

# RAcent  DECcent POSerr Theta    Phi  PeakCts   SNR AngSep     Name
#  [deg]    [deg]    ['] [deg]  [deg]                   [']
170.5722 -60.7150    5.4  38.0  -58.1  -1.9348  -2.1    9.3	Cen X-3
186.4298 -62.8662   11.9  35.1  -46.0   0.6778   1.0    8.5	GX 301-2
255.9977 -37.9992    0.0  51.1   23.1  -4.4594  -2.3    9.3	4U 1700-377
256.4452 -36.4173   58.9  52.6   24.0  -0.4806  -0.2    0.6	GX 349+2
264.7000 -44.3878   10.3  43.5   30.1   1.1272   1.1    4.2	4U 1735-44
263.1401 -39.3924    2.4  48.6   29.9   8.1810   4.9 ------	UNKNOWN
 23.2101 -29.4146    3.4  54.7  161.7   9.3500   3.3 ------	UNKNOWN
  8.2038 -45.8874    2.7  36.7  148.4   3.2834   4.3 ------	UNKNOWN
 26.8714 -29.5259    4.1  55.0  165.6   8.1146   2.8 ------	UNKNOWN
253.5736 -54.0371    0.1  35.8   15.4  54.2226  82.2 ------	UNKNOWN
 56.9199 -65.1766    2.9  24.8 -149.4   1.7751   4.0 ------	UNKNOWN
 62.5960 -33.4069    3.5  56.4 -157.2   7.9249   3.3 ------	UNKNOWN
Post-slew image of 15-350 keV band
Time interval of the image:
186.452590 459.052600

# RAcent  DECcent POSerr Theta    Phi  PeakCts   SNR AngSep     Name
#  [deg]    [deg]    ['] [deg]  [deg]                   [']
170.4000 -60.6089    2.4  36.3  -45.4   2.1455   4.8    2.6	Cen X-3
186.7483 -62.6312    6.3  34.4  -32.0   0.6022   1.8    8.7	GX 301-2
264.9515 -44.4220    4.4  47.1   40.2   2.7430   2.6    9.1	4U 1735-44
357.6996 -37.1702    3.0  45.8  138.8   3.9838   3.9 ------	UNKNOWN
277.4681 -56.4403    2.8  33.8   48.7   1.8010   4.1 ------	UNKNOWN
228.0206 -45.5413    2.3  49.7    5.5   2.8634   4.9 ------	UNKNOWN
 21.1488 -67.5923    2.7  15.8  170.2   1.1026   4.3 ------	UNKNOWN
 67.7953 -32.1733    3.0  55.0 -146.1   6.6082   3.8 ------	UNKNOWN