Analysis Summary
Notes:
- 1) No attempt has been made to eliminate the non-significant decimal places.
- 2) This batgrbproduct analysis is done using the HEASARC data.
- 3) This batgrbproduct analysis is using the flight position for the mask-weighting calculation.
======================================================================
BAT GRB EVENT DATA PROCESSING REPORT
Process Script Ver: batgrbproduct v2.46
Process Start Time: Fri Oct 19 18:53:03 EDT 2018
Host Name: bat1
Current Working Dir: /local/data/bat1/alien/Swift_3rdBATcatalog/event/batevent_reproc/trigger851829
======================================================================
Trigger: 00851829 Segment: 000
BAT Trigger Time: 555152710.4 [s; MET]
Trigger Stop: 555152711.424 [s; MET]
UTC: 2018-08-05T09:04:49.021980 [includes UTCF correction]
Where From?: TDRSS position message
BAT
RA: 167.530004406896 Dec: -45.3308970672546 [deg; J2000]
Catalogged Source?: NO
Point Source?: YES
GRB Indicated?: YES [ by BAT flight software ]
Image S/N Ratio: 7.46
Image Trigger?: NO
Rate S/N Ratio: 11.8321595661992 [ if not an image trigger ]
Image S/N Ratio: 7.46
Analysis Position: [ source = BAT ]
RA: 167.530004406896 Dec: -45.3308970672546 [deg; J2000]
Refined Position: [ source = BAT pre-slew burst ]
RA: 167.575257824607 Dec: -45.3266205270777 [deg; J2000]
{ 11h 10m 18.1s , -45d 19' 35.8" }
+/- 2.1404842271886 [arcmin] (estimated 90% radius based on SNR)
+/- 0.944234550083564 [arcmin] (formal 1-sigma fit error)
SNR: 10.2555353123739
Angular difference between the analysis and refined position is 1.926060 arcmin
Partial Coding Fraction: 0.640625 [ including projection effects ]
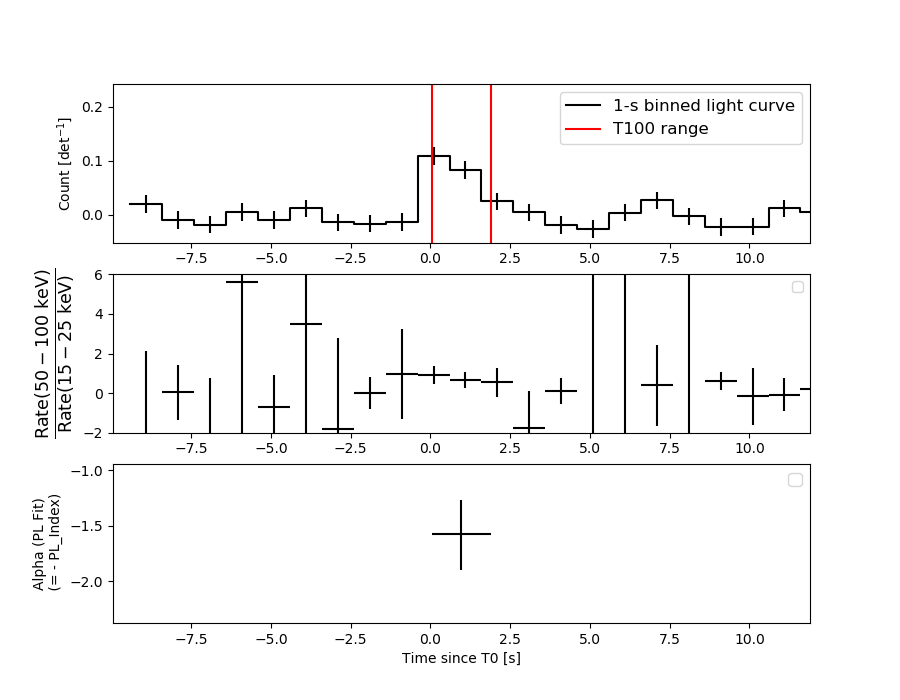
Duration
T90: 1.67599987983704 +/- 0.408803108661506
Measured from: 0.116000056266785
to: 1.79199993610382 [s; relative to TRIGTIME]
T50: 0.863999962806702 +/- 0.378227475672485
Measured from: 0.340000033378601
to: 1.2039999961853 [s; relative to TRIGTIME]
Fluence
Peak Flux (peak 1 second)
Measured from: 0.128000020980835
to: 1.12800002098083 [s; relative to TRIGTIME]
Total Fluence
Measured from: 0.0360000133514404
to: 1.89999997615814 [s; relative to TRIGTIME]
Band 1 Band 2 Band 3 Band 4
15-25 25-50 50-100 100-350 keV
Total 0.071355 0.069467 0.047089 0.032694
0.011993 0.012731 0.011461 0.011116 [error]
Peak 0.045114 0.053232 0.028976 0.016086
0.008975 0.009910 0.008758 0.008174 [error]
[ fluence units of on-axis counts / fully illuminated detector ]
======================================================================
====== Table of the duration information =============================
Value tstart tstop
T100 1.864 0.036 1.900
T90 1.676 0.116 1.792
T50 0.864 0.340 1.204
Peak 1.000 0.128 1.128
====== Spectral Analysis Summary =====================================
Model : spectral model: simple power-law (PL) and cutoff power-law (CPL)
Ph_index : photon index: E^{Ph_index}
Ph_90err : 90% error of the photon index
Epeak : Epeak in keV
Epeak_90err: 90% error of Epeak
Norm : normalization at 50 keV in both the PL model and CPL model
Nomr_90err : 90% error of the normalization
chi2 : Chi-Squared
dof : degree of freedo
=== Time-averaged spectral analysis ===
(Best model with acceptable fit: PL)
Model Ph_index Ph_90err_low Ph_90err_hi Epeak Epeak_90err_low Epeak_90err_hi Norm Nomr_90err_low Norm_90err_hi chi2 dof
PL -1.577 -0.322 0.313 - - - 6.46e-03 -1.36e-03 1.33e-03 56.430 57
CPL -0.165 -1.487 2.321 54.082 -14.930 -54.082 4.23e-02 -4.23e-02 9.62e-01 53.880 56
=== 1-s peak spectral analysis ===
(Best model with acceptable fit: PL)
Model Ph_index Ph_90err_low Ph_90err_hi Epeak Epeak_90err_low Epeak_90err_hi Norm Nomr_90err_low Norm_90err_hi chi2 dof
PL -1.610 -0.341 0.327 - - - 8.50e-03 -1.94e-03 1.90e-03 49.950 57
CPL 0.618 -1.986 3.161 47.232 -10.231 61.713 1.73e-01 -1.73e-01 1.20e+01 46.200 56
=== Fluence/Peak Flux Summary ===
Model Band1 Band2 Band3 Band4 Band5 Total
15-25 25-50 50-100 100-350 15-150 15-350 keV
Fluence PL 1.65e-08 2.90e-08 3.88e-08 1.07e-07 1.13e-07 1.91e-07 erg/cm2
90%_error_low -4.54e-09 -5.53e-09 -1.05e-08 -4.84e-08 -2.52e-08 -6.06e-08 erg/cm2
90%_error_hi 4.76e-09 5.52e-09 1.07e-08 7.06e-08 2.60e-08 7.89e-08 erg/cm2
Peak flux PL 3.89e-01 3.67e-01 2.40e-01 2.44e-01 1.10e+00 1.24e+00 ph/cm2/s
90%_error_low -1.12e-01 -7.51e-02 -6.81e-02 -1.11e-01 -2.23e-01 -2.61e-01 ph/cm2/s
90%_error_hi 1.18e-01 7.50e-02 6.92e-02 1.57e-01 2.23e-01 2.66e-01 ph/cm2/s
Fluence CPL 1.48e-08 3.44e-08 3.61e-08 1.37e-08 9.57e-08 9.90e-08 erg/cm2
90%_error_low -5.23e-09 -8.02e-09 -1.57e-08 N/A -2.59e-08 -2.91e-08 erg/cm2
90%_error_hi 5.26e-09 8.66e-09 1.33e-08 N/A 3.13e-08 1.09e-07 erg/cm2
Peak flux CPL 3.24e-01 4.70e-01 2.14e-01 1.98e-02 1.03e+00 1.03e+00 ph/cm2/s
90%_error_low -1.37e-01 -1.19e-01 -9.96e-02 -1.98e-02 -2.24e-01 -2.25e-01 ph/cm2/s
90%_error_hi 1.37e-01 1.23e-01 9.45e-02 1.54e-01 2.29e-01 2.40e-01 ph/cm2/s
======================================================================
Image
Pre-slew 15.0-350.0 keV image (Event data)
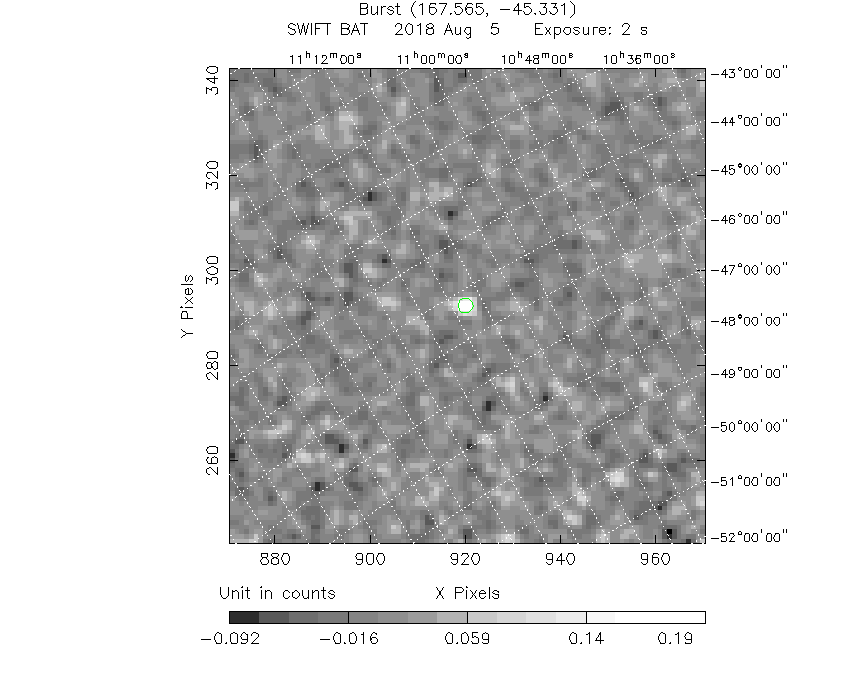
#   RAcent    DECcent   POSerr    Theta     Phi              Peak Cts       SNR   Name
  167.5753   -45.3266   0.0187    21.5988   102.3988         0.2538748     10.256 TRIG_00851829

Foreground time interval of the image:
  0.036   1.900 (delta_t =   1.864 [sec])
Background time interval of the image:
-239.400   0.036 (delta_t = 239.436 [sec])
Light Curves
Note: The mask-weighted lightcurves have units of either count/det or counts/sec/det, where a det is 0.4 x 0.4 = 0.16 sq cm.
Full-time range; 1 s binning
Other quick-look light curves:
- 64 ms binning (zoomed)
- 16 ms binning (zoomed)
- 8 ms binning (zoomed)
- 2 ms binning (zoomed)
- SN=5 or 10 s binning (full-time range)
- Raw light curve
Spectra
- 64 ms binning (zoomed)
- 16 ms binning (zoomed)
- 8 ms binning (zoomed)
- 2 ms binning (zoomed)
- SN=5 or 10 s binning (full-time range)
- Raw light curve
Spectra
Notes:
- 1) The fitting includes the systematic errors.
- 2) When the burst includes telescope slew time periods, the fitting uses an average response file made from multiple 5-s response files through out the slew time plus single time preiod for the non-slew times, and weighted by the total counts in the corresponding time period using addrmf. An average response file is needed becuase a spectral fit using the pre-slew DRM will introduce some errors in both a spectral shape and a normalization if the PHA file contains a lot of the slew/post-slew time interval.
- 3) For fits to more complicated models (e.g. a power-law over a cutoff power-law), the BAT team has decided to require a chi-square improvement of more than 6 for each extra dof.
Time averaged spectrum fit using the average DRM
Power-law model
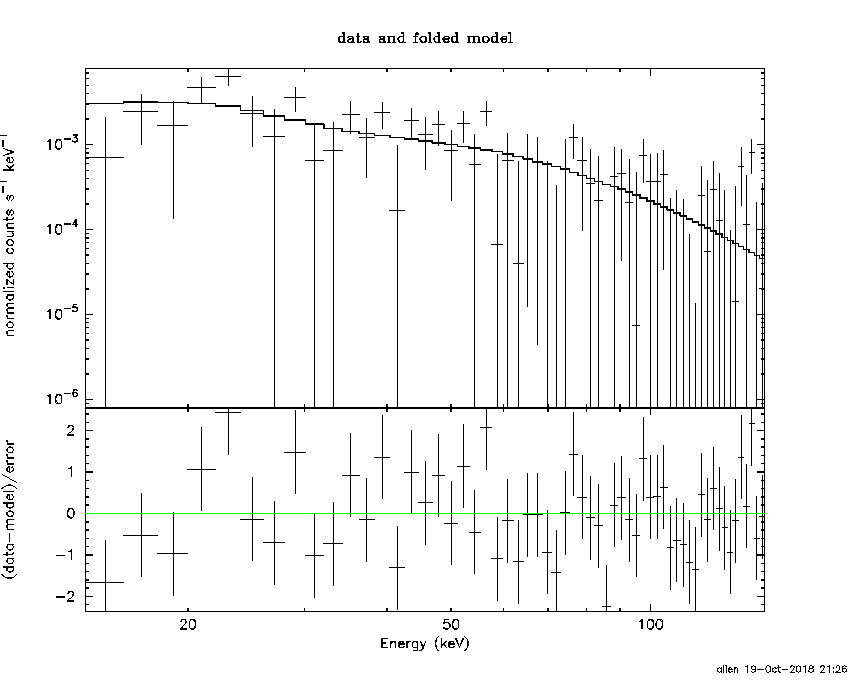
Time interval is from    0.036 sec. to    1.900 sec.

Spectral model in power-law:
------------------------------------------------------------
Parameters  : value       lower 90%   higher 90%
Photon index: -1.57674     ( -0.321812   0.312837 )
Norm@50keV  : 6.45978E-03    ( -0.00135537   0.00133015 )
------------------------------------------------------------
#Fit statistic : Chi-Squared =          56.43 using 59 PHA bins.
# Reduced chi-squared =         0.9899 for     57 degrees of freedom
# Null hypothesis probability =   4.965964e-01

Photon flux (15-150 keV)    in 1.864 sec: 0.824271 ( -0.156526  0.156566 ) ph/cm2/s
Energy fluence (15-150 keV)             : 1.1295e-07 ( -2.51757e-08  2.60345e-08 ) ergs/cm2
Cutoff power-law model

Time interval is from    0.036 sec. to    1.900 sec.
Spectral model in the cutoff power-law:
------------------------------------------------------------
Parameters  : value       lower 90%   higher 90%
Photon index: -0.165453     ( -1.49041   2.31753 )
Epeak [keV] : 54.0818      ( -14.8626 -54.014 )
Norm@50keV  : 4.23430E-02    ( -0.0426594   0.961397 )
------------------------------------------------------------
#Fit statistic : Chi-Squared =          53.88 using 59 PHA bins.
# Reduced chi-squared =         0.9621 for     56 degrees of freedom
# Null hypothesis probability =   5.557057e-01

Photon flux (15-150 keV)    in 1.864 sec: 0.784504 ( -0.160172  0.162057 ) ph/cm2/s
Energy fluence (15-150 keV)             : 9.57339e-08 ( -2.58567e-08  3.13105e-08 ) ergs/cm2
1-s peak spectrum fit
Power-law model
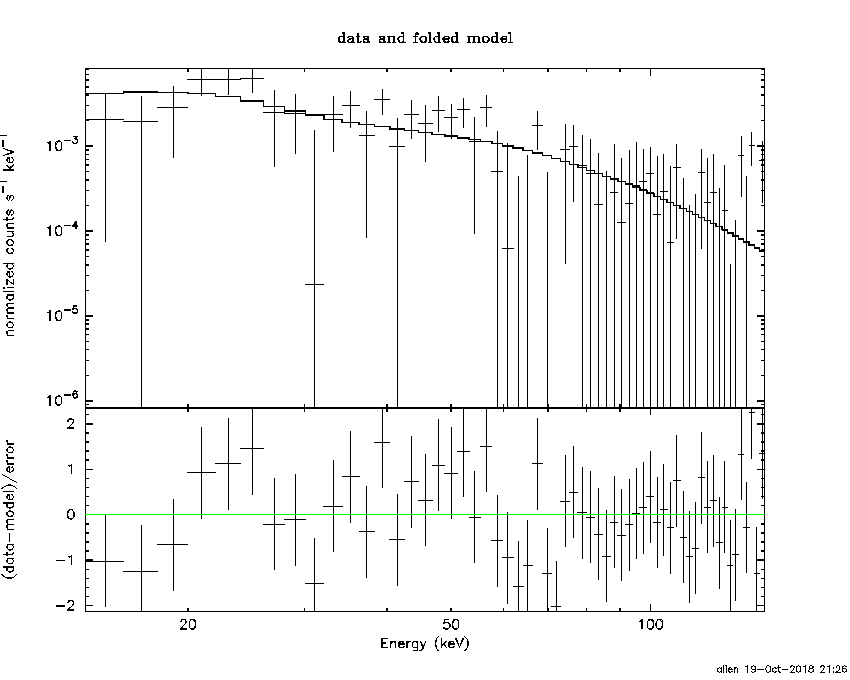
Time interval is from    0.128 sec. to    1.128 sec.

Spectral model in power-law:
------------------------------------------------------------
Parameters  : value       lower 90%   higher 90%
Photon index: -1.61048     ( -0.340707   0.327057 )
Norm@50keV  : 8.49635E-03    ( -0.00193836   0.00189801 )
------------------------------------------------------------
#Fit statistic : Chi-Squared =          49.95 using 59 PHA bins.
# Reduced chi-squared =         0.8763 for     57 degrees of freedom
# Null hypothesis probability =   7.345108e-01

Photon flux (15-150 keV)    in 1 sec: 1.09543 ( -0.222646  0.22266 ) ph/cm2/s
Energy fluence (15-150 keV)             : 7.93725e-08 ( -1.90027e-08  1.96742e-08 ) ergs/cm2
Cutoff power-law model
Time interval is from    0.128 sec. to    1.128 sec.
Spectral model in the cutoff power-law:
------------------------------------------------------------
Parameters  : value       lower 90%   higher 90%
Photon index: 0.617681     ( -2.01637   3.13074 )
Epeak [keV] : 47.2318      ( -10.0144 61.9306 )
Norm@50keV  : 0.173406    ( -0.186973   11.9823 )
------------------------------------------------------------
#Fit statistic : Chi-Squared =          46.20 using 59 PHA bins.
# Reduced chi-squared =         0.8250 for     56 degrees of freedom
# Null hypothesis probability =   8.218724e-01

Photon flux (15-150 keV)    in 1 sec: 1.02583 ( -0.223951  0.22868 ) ph/cm2/s
Energy fluence (15-150 keV)             : 6.30188e-08 ( -1.65213e-08  2.28529e-08 ) ergs/cm2
Time-resolved spectra
Distribution
T90 vs. Hardness ratio plot
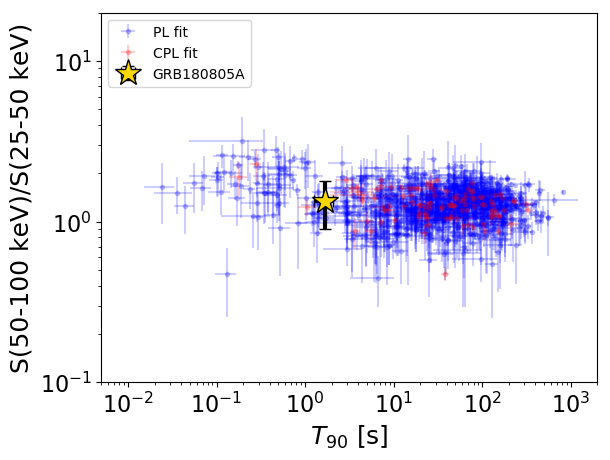
T90                                   = 1.676 sec.
Hardness ratio (energy fluence ratio) = 1.3408803182
S(15-50 keV) vs. S(50-150 keV) plot
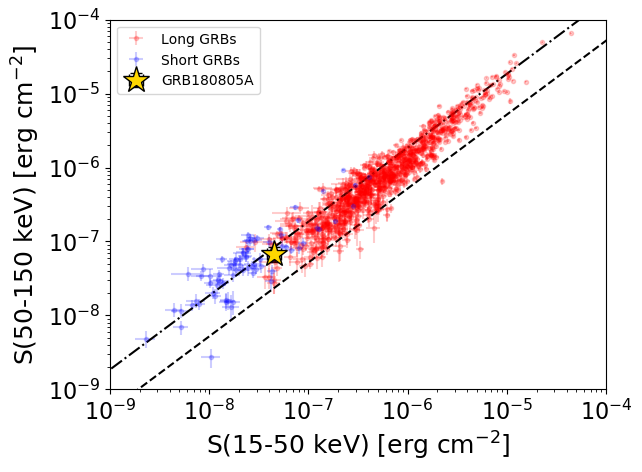
S(15-50 keV)  = 4.549833e-08
S(50-150 keV) = 6.745283e-08
The dash-dotted line and the dashed line traces the fluences calculated from the Band function with Epeak = 15 and 150 keV, respectively. Both lines assume a canonical values of alpha = -1 and beta = -2.5.
Mask shadow pattern
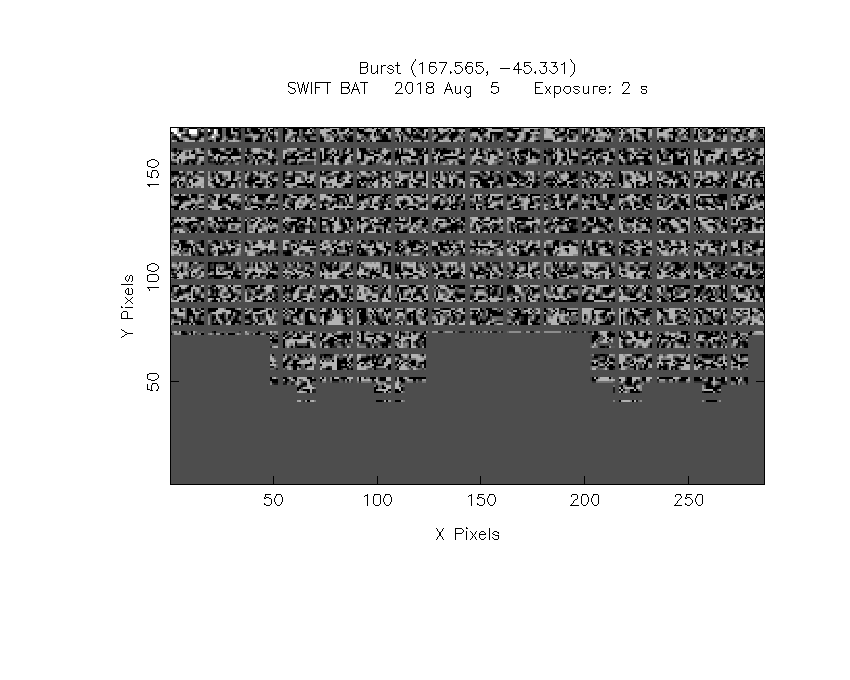
IMX = -8.500682077132886E-02, IMY = -3.866702760115799E-01
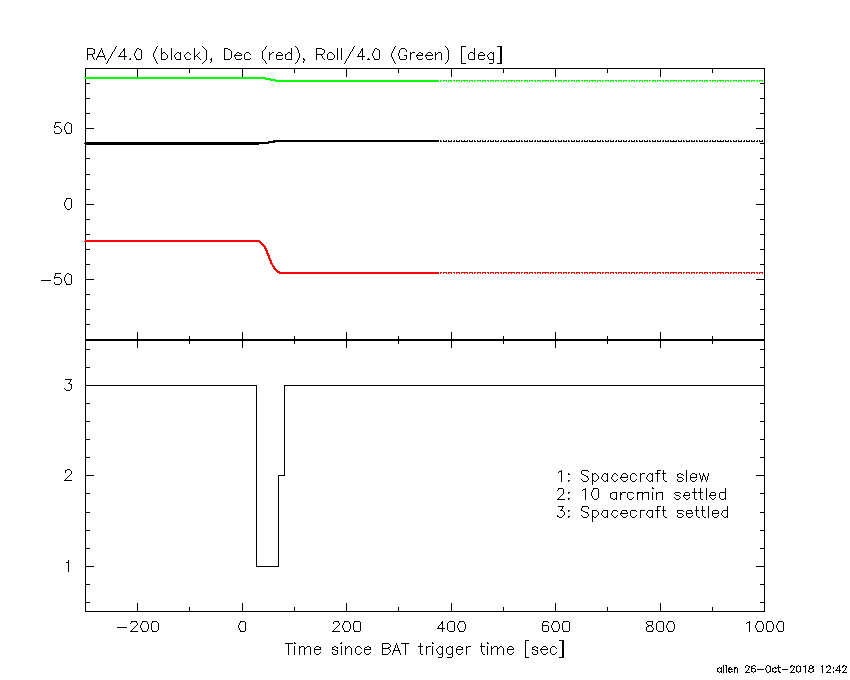
Spacecraft aspect plot
Bright source in the pre-burst/pre-slew/post-slew images
Pre-burst image of 15-350 keV band
Time interval of the image:
-239.400000 0.036000

# RAcent  DECcent POSerr Theta    Phi  PeakCts   SNR AngSep     Name
#  [deg]    [deg]    ['] [deg]  [deg]                   [']
135.2952 -40.4460   11.5  26.8  162.1   0.3077   1.0   12.5	Vela X-1
170.4064 -60.6214    8.5  36.8  107.4   0.9317   1.4    2.7	Cen X-3
193.0344 -49.8972    2.7  35.6   79.1   2.7379   4.3 ------	UNKNOWN
125.6439   4.7127    3.2  45.0 -119.3   4.0789   3.7 ------	UNKNOWN
Pre-slew background subtracted image of 15-350 keV band
Time interval of the image:
0.036000 1.900000

# RAcent  DECcent POSerr Theta    Phi  PeakCts   SNR AngSep     Name
#  [deg]    [deg]    ['] [deg]  [deg]                   [']
135.4242 -40.4433   12.3  26.7  162.0  -0.0223  -0.9    8.2	Vela X-1
170.5764 -60.6150    4.8  36.8  107.3   0.1155   2.4    7.7	Cen X-3
167.5752 -45.3266    1.1  21.6  102.4   0.2539  10.3 ------	UNKNOWN
214.6573  -3.7323    2.0  55.6   12.2   0.6257   5.7 ------	UNKNOWN
Post-slew image of 15-350 keV band
Time interval of the image:
70.500600 962.667300

# RAcent  DECcent POSerr Theta    Phi  PeakCts   SNR AngSep     Name
#  [deg]    [deg]    ['] [deg]  [deg]                   [']
135.3317 -40.5446    7.2  23.9 -146.7   1.1444   1.6    9.0	Vela X-1
170.4187 -60.6190    2.2  15.4  118.0   4.0723   5.2    3.0	Cen X-3
186.6969 -62.7384    1.9  20.6   98.0   5.0345   6.0    2.2	GX 301-2
206.0194  -1.6530    3.3  55.2   -7.4   7.0570   3.6 ------	UNKNOWN
126.3913 -18.7338    3.8  43.1 -122.4   6.8158   3.0 ------	UNKNOWN