Analysis Summary
Notes:
- 1) No attempt has been made to eliminate the non-significant decimal places.
- 2) This batgrbproduct analysis is done using the HEASARC data.
- 3) This batgrbproduct analysis is using the flight position for the mask-weighting calculation.
======================================================================
BAT GRB EVENT DATA PROCESSING REPORT
Process Script Ver: batgrbproduct v2.46
Process Start Time: Fri Oct 19 18:50:22 EDT 2018
Host Name: bat1
Current Working Dir: /local/data/bat1/alien/Swift_3rdBATcatalog/event/batevent_reproc/trigger851855
======================================================================
Trigger: 00851855 Segment: 000
BAT Trigger Time: 555166977.856 [s; MET]
Trigger Stop: 555166978.112 [s; MET]
UTC: 2018-08-05T13:02:36.477100 [includes UTCF correction]
Where From?: TDRSS position message
BAT
RA: 25.8134664618429 Dec: -17.5033792589829 [deg; J2000]
Catalogged Source?: NO
Point Source?: YES
GRB Indicated?: YES [ by BAT flight software ]
Image S/N Ratio: 10.44
Image Trigger?: NO
Rate S/N Ratio: 27.9821371592664 [ if not an image trigger ]
Image S/N Ratio: 10.44
Analysis Position: [ source = BAT ]
RA: 25.8134664618429 Dec: -17.5033792589829 [deg; J2000]
Refined Position: [ source = BAT pre-slew burst ]
RA: 25.8683304030413 Dec: -17.4813917776302 [deg; J2000]
{ 01h 43m 28.4s , -17d 28' 53.0" }
+/- 3.18066339331012 [arcmin] (estimated 90% radius based on SNR)
+/- 1.51010569104555 [arcmin] (formal 1-sigma fit error)
SNR: 5.82419539117454
Angular difference between the analysis and refined position is 3.405522 arcmin
Partial Coding Fraction: 0.6796875 [ including projection effects ]
Duration
T90: 122.239999890327 +/- 18.0105578431205
Measured from: 0.116000056266785
to: 122.355999946594 [s; relative to TRIGTIME]
T50: 64.972000002861 +/- 32.5822332280177
Measured from: 31.8880000114441
to: 96.8600000143051 [s; relative to TRIGTIME]
Fluence
Peak Flux (peak 1 second)
Measured from: -0.107999920845032
to: 0.892000079154968 [s; relative to TRIGTIME]
Total Fluence
Measured from: -0.0999999046325684
to: 126.53200006485 [s; relative to TRIGTIME]
Band 1 Band 2 Band 3 Band 4
15-25 25-50 50-100 100-350 keV
Total 0.311885 0.380356 0.393929 0.280514
0.073273 0.076450 0.067945 0.061943 [error]
Peak 0.033836 0.058124 0.096342 0.029780
0.008145 0.009456 0.009015 0.007657 [error]
[ fluence units of on-axis counts / fully illuminated detector ]
======================================================================
====== Table of the duration information =============================
Value tstart tstop
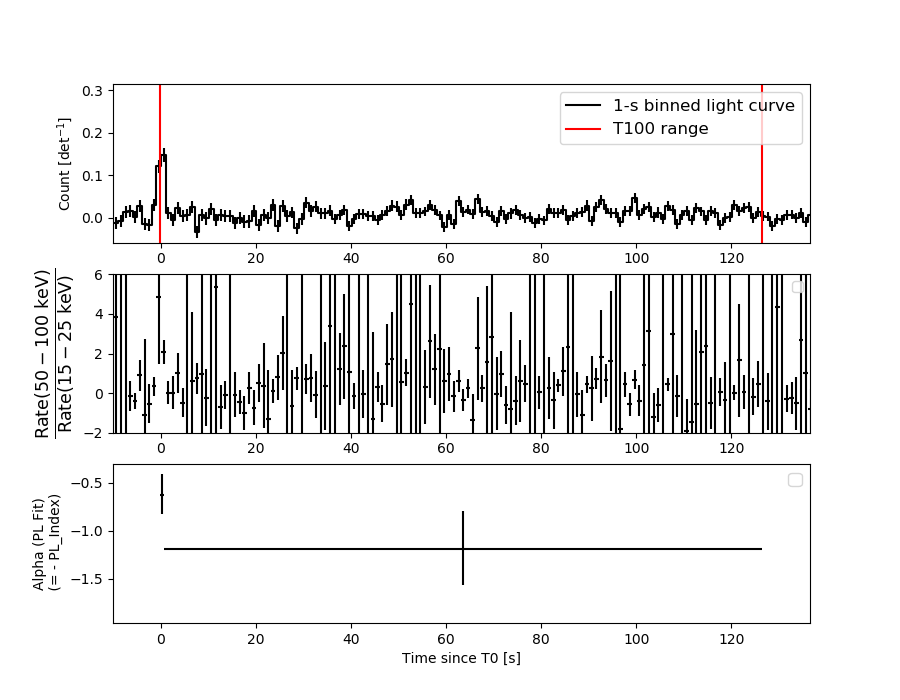
T100 126.632 -0.100 126.532
T90 122.240 0.116 122.356
T50 64.972 31.888 96.860
Peak 1.000 -0.108 0.892
====== Spectral Analysis Summary =====================================
Model : spectral model: simple power-law (PL) and cutoff power-law (CPL)
Ph_index : photon index: E^{Ph_index}
Ph_90err : 90% error of the photon index
Epeak : Epeak in keV
Epeak_90err: 90% error of Epeak
Norm : normalization at 50 keV in both the PL model and CPL model
Nomr_90err : 90% error of the normalization
chi2 : Chi-Squared
dof : degree of freedo
=== Time-averaged spectral analysis ===
(Best model with acceptable fit: PL)
Model Ph_index Ph_90err_low Ph_90err_hi Epeak Epeak_90err_low Epeak_90err_hi Norm Nomr_90err_low Norm_90err_hi chi2 dof
PL -1.085 -0.311 0.330 - - - 6.49e-04 -1.14e-04 1.13e-04 54.420 57
CPL -1.085 -0.309 0.337 9999.360 -9999.360 -9999.360 6.52e-04 -1.13e-04 1.66e-03 54.430 56
=== 1-s peak spectral analysis ===
(Best model with acceptable fit: CPL)
Model Ph_index Ph_90err_low Ph_90err_hi Epeak Epeak_90err_low Epeak_90err_hi Norm Nomr_90err_low Norm_90err_hi chi2 dof
PL -0.786 -0.205 0.216 - - - 1.49e-02 -1.96e-03 1.93e-03 57.830 57
CPL 0.764 -1.123 1.615 111.252 -26.264 119.953 6.15e-02 -3.89e-02 1.71e-01 51.660 56
=== Fluence/Peak Flux Summary ===
Model Band1 Band2 Band3 Band4 Band5 Total
15-25 25-50 50-100 100-350 15-150 15-350 keV
Fluence PL 7.12e-08 1.69e-07 3.18e-07 1.45e-06 8.63e-07 2.01e-06 erg/cm2
90%_error_low -2.40e-08 -3.61e-08 -6.48e-08 -5.73e-07 -1.65e-07 -6.22e-07 erg/cm2
90%_error_hi 2.66e-08 3.48e-08 6.36e-08 8.20e-07 1.67e-07 8.36e-07 erg/cm2
Peak flux PL 3.10e-01 4.79e-01 5.55e-01 1.24e+00 1.71e+00 2.58e+00 ph/cm2/s
90%_error_low -8.00e-02 -8.14e-02 -6.95e-02 -3.00e-01 -2.18e-01 -3.51e-01 ph/cm2/s
90%_error_hi 8.89e-02 8.07e-02 6.93e-02 3.60e-01 2.19e-01 3.70e-01 ph/cm2/s
Fluence CPL 7.16e-08 1.68e-07 3.16e-07 1.44e-06 8.65e-07 2.02e-06 erg/cm2
90%_error_low N/A -2.72e-08 -6.54e-08 N/A -1.79e-07 -1.15e-06 erg/cm2
90%_error_hi N/A 3.98e-08 7.55e-08 N/A 1.67e-07 3.82e-07 erg/cm2
Peak flux CPL 1.85e-01 4.80e-01 6.55e-01 4.49e-01 1.61e+00 1.77e+00 ph/cm2/s
90%_error_low -9.77e-02 -1.03e-01 -9.83e-02 -2.10e-01 -2.35e-01 -3.28e-01 ph/cm2/s
90%_error_hi 1.18e-01 9.70e-02 1.02e-01 4.32e-01 2.33e-01 4.78e-01 ph/cm2/s
======================================================================
Image
Pre-slew 15.0-350.0 keV image (Event data)
#   RAcent    DECcent   POSerr    Theta     Phi              Peak Cts       SNR   Name
   25.8683   -17.4814   0.0330    28.7501   -42.1467         0.3396585      5.824 TRIG_00851855

Foreground time interval of the image:
 -0.100  15.445 (delta_t =  15.545 [sec])
Background time interval of the image:
-239.856  -0.100 (delta_t = 239.756 [sec])
Light Curves
Note: The mask-weighted lightcurves have units of either count/det or counts/sec/det, where a det is 0.4 x 0.4 = 0.16 sq cm.
Full-time range; 1 s binning
Other quick-look light curves:
- 64 ms binning (zoomed)
- 16 ms binning (zoomed)
- 8 ms binning (zoomed)
- 2 ms binning (zoomed)
- SN=5 or 10 s binning (full-time range)
- Raw light curve
Spectra
- 64 ms binning (zoomed)
- 16 ms binning (zoomed)
- 8 ms binning (zoomed)
- 2 ms binning (zoomed)
- SN=5 or 10 s binning (full-time range)
- Raw light curve
Spectra
Notes:
- 1) The fitting includes the systematic errors.
- 2) When the burst includes telescope slew time periods, the fitting uses an average response file made from multiple 5-s response files through out the slew time plus single time preiod for the non-slew times, and weighted by the total counts in the corresponding time period using addrmf. An average response file is needed becuase a spectral fit using the pre-slew DRM will introduce some errors in both a spectral shape and a normalization if the PHA file contains a lot of the slew/post-slew time interval.
- 3) For fits to more complicated models (e.g. a power-law over a cutoff power-law), the BAT team has decided to require a chi-square improvement of more than 6 for each extra dof.
Time averaged spectrum fit using the average DRM
Power-law model
Time interval is from   -0.100 sec. to  126.532 sec.

Spectral model in power-law:
------------------------------------------------------------
Parameters  : value       lower 90%   higher 90%
Photon index: -1.08548     ( -0.311049   0.330275 )
Norm@50keV  : 6.48936E-04    ( -0.000113679   0.000113388 )
------------------------------------------------------------
#Fit statistic : Chi-Squared =          54.42 using 59 PHA bins.
# Reduced chi-squared =         0.9548 for     57 degrees of freedom
# Null hypothesis probability =   5.723494e-01

Photon flux (15-150 keV)    in 126.6 sec: 7.51699E-02 ( -0.0135163  0.0135796 ) ph/cm2/s
Energy fluence (15-150 keV)             : 8.63065e-07 ( -1.65293e-07  1.67354e-07 ) ergs/cm2
Cutoff power-law model
Time interval is from   -0.100 sec. to  126.532 sec.
Spectral model in the cutoff power-law:
------------------------------------------------------------
Parameters  : value       lower 90%   higher 90%
Photon index: -1.08468     ( -0.310154   0.335684 )
Epeak [keV] : 9999.36      ( -9999.36 -9999.36 )
Norm@50keV  : 6.52062E-04    ( -0.000113513   0.00165585 )
------------------------------------------------------------
#Fit statistic : Chi-Squared =          54.43 using 59 PHA bins.
# Reduced chi-squared =         0.9719 for     56 degrees of freedom
# Null hypothesis probability =   5.346306e-01

Photon flux (15-150 keV)    in 126.6 sec: 7.52970E-02 ( -0.0139106  0.0135709 ) ph/cm2/s
Energy fluence (15-150 keV)             : 8.64875e-07 ( -1.79302e-07  1.67063e-07 ) ergs/cm2
1-s peak spectrum fit
Power-law model
Time interval is from   -0.108 sec. to    0.892 sec.

Spectral model in power-law:
------------------------------------------------------------
Parameters  : value       lower 90%   higher 90%
Photon index: -0.785931     ( -0.205117   0.216181 )
Norm@50keV  : 1.48578E-02    ( -0.00195805   0.00193259 )
------------------------------------------------------------
#Fit statistic : Chi-Squared =          57.83 using 59 PHA bins.
# Reduced chi-squared =          1.015 for     57 degrees of freedom
# Null hypothesis probability =   4.444942e-01

Photon flux (15-150 keV)    in 1 sec: 1.70854 ( -0.218  0.21897 ) ph/cm2/s
Energy fluence (15-150 keV)             : 1.74679e-07 ( -2.24666e-08  2.25542e-08 ) ergs/cm2
Cutoff power-law model
Time interval is from   -0.108 sec. to    0.892 sec.
Spectral model in the cutoff power-law:
------------------------------------------------------------
Parameters  : value       lower 90%   higher 90%
Photon index: 0.763505     ( -1.123   1.61431 )
Epeak [keV] : 111.252      ( -26.2527 119.964 )
Norm@50keV  : 6.15484E-02    ( -0.0388905   0.170903 )
------------------------------------------------------------
#Fit statistic : Chi-Squared =          51.66 using 59 PHA bins.
# Reduced chi-squared =         0.9225 for     56 degrees of freedom
# Null hypothesis probability =   6.396535e-01

Photon flux (15-150 keV)    in 1 sec: 1.60611 ( -0.23475  0.23344 ) ph/cm2/s
Energy fluence (15-150 keV)             : 1.65863e-07 ( -2.45344e-08  2.42361e-08 ) ergs/cm2
Time-resolved spectra
Distribution
T90 vs. Hardness ratio plot
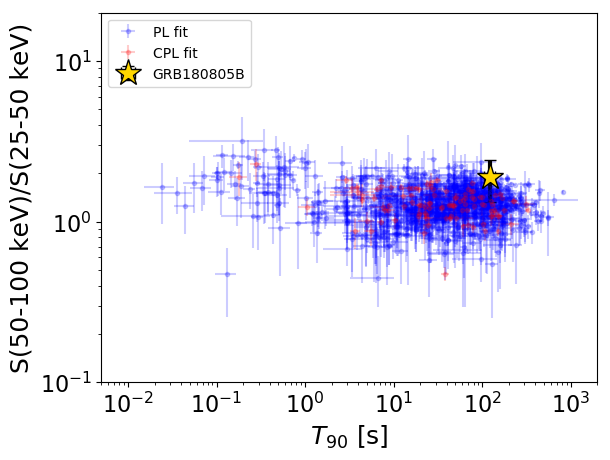
T90                                   = 122.24 sec.
Hardness ratio (energy fluence ratio) = 1.88499415138
S(15-50 keV) vs. S(50-150 keV) plot
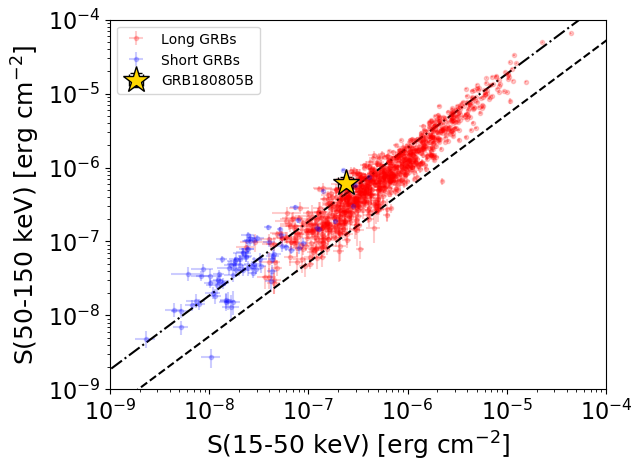
S(15-50 keV)  = 2.4017861e-07
S(50-150 keV) = 6.228993e-07
The dash-dotted line and the dashed line traces the fluences calculated from the Band function with Epeak = 15 and 150 keV, respectively. Both lines assume a canonical values of alpha = -1 and beta = -2.5.
Mask shadow pattern
IMX = 4.067641114553334E-01, IMY = 3.681423310960769E-01
Spacecraft aspect plot
Bright source in the pre-burst/pre-slew/post-slew images
Pre-burst image of 15-350 keV band
Time interval of the image:
-239.856000 -0.100000

# RAcent  DECcent POSerr Theta    Phi  PeakCts   SNR AngSep     Name
#  [deg]    [deg]    ['] [deg]  [deg]                   [']
326.2718  38.4038    5.2  52.1  161.8   2.3689   2.2    6.8	Cyg X-2
340.2847 -44.0150    3.1  44.8   36.5   2.2151   3.7 ------	UNKNOWN
  8.9877 -27.7380    2.4  26.0   -1.4   1.1075   4.8 ------	UNKNOWN
Pre-slew background subtracted image of 15-350 keV band
Time interval of the image:
-0.100000 15.444590

# RAcent  DECcent POSerr Theta    Phi  PeakCts   SNR AngSep     Name
#  [deg]    [deg]    ['] [deg]  [deg]                   [']
326.1119  38.1971    5.7  52.0  161.5   0.4263   2.0    8.0	Cyg X-2
333.6822  -6.8009    2.1  27.0   96.7   0.3757   5.5 ------	UNKNOWN
 12.5695 -45.1981    2.0  43.5    3.5   0.4426   5.9 ------	UNKNOWN
 25.8683 -17.4814    2.0  28.8  -42.1   0.3398   5.8 ------	UNKNOWN
 47.2112 -26.3316    2.1  50.4  -41.9   1.1314   5.7 ------	UNKNOWN
Post-slew image of 15-350 keV band
Time interval of the image:
65.644590 962.184400

# RAcent  DECcent POSerr Theta    Phi  PeakCts   SNR AngSep     Name
#  [deg]    [deg]    ['] [deg]  [deg]                   [']
 34.8294 -38.9119    4.0  22.8   -6.9   1.7996   2.9 ------	UNKNOWN
 66.9446 -70.1167    3.7  58.2   -3.8  12.9879   3.1 ------	UNKNOWN
 71.3835 -68.8457    3.1  58.6   -6.1  13.6531   3.7 ------	UNKNOWN