Analysis Summary
Notes:
- 1) No attempt has been made to eliminate the non-significant decimal places.
- 2) This batgrbproduct analysis is done using the HEASARC data.
- 3) This batgrbproduct analysis is using the flight position for the mask-weighting calculation.
======================================================================
                  BAT GRB EVENT DATA PROCESSING REPORT
    Process Script Ver: batgrbproduct v2.46
    Process Start Time: Fri Oct 19 18:47:35 EDT 2018
             Host Name: bat1
   Current Working Dir: /local/data/bat1/alien/Swift_3rdBATcatalog/event/batevent_reproc/trigger852553
======================================================================

  Trigger: 00852553      Segment: 000

  BAT Trigger Time: 555539349.504   [s; MET]
      Trigger Stop: 555539350.528   [s; MET]
               UTC: 2018-08-09T20:28:48.102240    [includes UTCF correction]
       Where From?: TDRSS position message

  BAT
    RA: 299.71241182161   Dec: -15.3020410499128  [deg; J2000]

     Catalogged Source?: NO
     Point Source?:      YES
     GRB Indicated?:     YES    [ by BAT flight software ]
     Image S/N Ratio:    20.89
     Image Trigger?:     NO
     Rate S/N Ratio:     69.8140387028282  [ if not an image trigger ]
     Image S/N Ratio:    20.89

  Analysis Position:   [ source = BAT ]
    RA: 299.71241182161   Dec: -15.3020410499128  [deg; J2000]

  Refined Position:   [ source = BAT pre-slew burst ]
    RA: 299.711804743507   Dec: -15.2927685976229  [deg; J2000]
        { 19h 58m 50.8s , -15d 17' 34.0" }
         +/- 0.56225299484388 [arcmin] (estimated 90% radius based on SNR)
         +/- 0.133240301652705 [arcmin] (formal 1-sigma fit error)
    SNR: 69.2402612765424

  Angular difference between the analysis and refined position is 0.557455 arcmin

  Partial Coding Fraction: 0.6328125    [ including projection effects ]

  Duration
     T90: 233.243999958038 +/- 1.12445540263143
        Measured from: 3.62800002098083
                   to: 236.871999979019     [s; relative to TRIGTIME]
     T50: 37.595999956131 +/- 1.16756849842931
        Measured from: 20.1759999990463
                   to: 57.7719999551773     [s; relative to TRIGTIME]


  Fluence
     Peak Flux  (peak 1 second)
        Measured from: 35.0960000753403
                   to: 36.0960000753403     [s; relative to TRIGTIME]
     Total Fluence
        Measured from: -36.0799999237061
                   to: 302.308000087738     [s; relative to TRIGTIME]

             Band 1     Band 2     Band 3     Band 4
              15-25      25-50     50-100    100-350     keV
 Total    23.428057  38.318789  35.257398  10.272070
           0.157600   0.172922   0.161166   0.122978 [error]
 Peak      0.594344   1.156054   1.204186   0.402962
           0.016147   0.021153   0.022643   0.016796 [error]

     [ fluence units of on-axis counts / fully illuminated detector ]

======================================================================


====== Table of the duration information =============================

        Value   tstart    tstop
T100  338.388  -36.080  302.308
T90   233.244    3.628  236.872
T50    37.596   20.176   57.772
Peak    1.000   35.096   36.096


====== Spectral Analysis Summary =====================================

Model      : spectral model: simple power-law (PL) and cutoff power-law (CPL)
Ph_index   : photon index: E^{Ph_index}
Ph_90err   : 90% error of the photon index
Epeak      : Epeak in keV
Epeak_90err: 90% error of Epeak
Norm       : normalization at 50 keV in both the PL model and CPL model
Nomr_90err : 90% error of the normalization
chi2       : Chi-Squared
dof        : degree of freedo

=== Time-averaged spectral analysis ===
(Best model with acceptable fit: PL)

Model Ph_index Ph_90err_low Ph_90err_hi  Epeak  Epeak_90err_low  Epeak_90err_hi  Norm       Nomr_90err_low    Norm_90err_hi    chi2    dof
PL      -1.240    -0.021      0.021       -           -               -         2.13e-02     -2.71e-04          2.71e-04      35.420   57
CPL     -1.105    -0.086      0.088      449.104    -147.573       644.476      2.39e-02     -1.64e-03          1.80e-03      28.250   56


=== 1-s peak spectral analysis ===
(Best model with acceptable fit: N/A)

Model Ph_index Ph_90err_low Ph_90err_hi  Epeak  Epeak_90err_low  Epeak_90err_hi  Norm       Nomr_90err_low    Norm_90err_hi    chi2    dof
PL      -1.002     -0.041     0.041       -           -               -         2.24e-01     -5.11e-03          5.10e-03      43.070   57
CPL     -0.793     -0.160     0.167      344.914    -125.556       831.736      2.75e-01     -3.85e-02          4.75e-02      38.130   56


=== Fluence/Peak Flux Summary ===

              Model    Band1     Band2     Band3     Band4     Band5     Total
                       15-25     25-50    50-100    100-350    15-150    15-350    keV
Fluence         PL   7.23e-06  1.56e-05  2.64e-05  1.03e-04  7.24e-05  1.52e-04   erg/cm2
      90%_error_low -2.01e-07 -2.65e-07 -2.93e-07 -2.61e-06 -7.99e-07 -2.61e-06   erg/cm2
      90%_error_hi   2.04e-07  2.64e-07  2.93e-07  2.65e-06  7.98e-07  2.65e-06   erg/cm2
Peak flux       PL   2.64e-03  3.26e-02  3.77e-01  3.28e+01  1.22e+00  3.20e+01   ph/cm2/s
      90%_error_low     N/A       N/A       N/A       N/A       N/A       N/A     ph/cm2/s
      90%_error_hi      N/A       N/A       N/A       N/A       N/A       N/A     ph/cm2/s

Fluence        CPL   6.87e-06  1.55e-05  2.68e-05  9.04e-05  7.22e-05  1.40e-04   erg/cm2
      90%_error_low -2.92e-07 -2.69e-07 -4.07e-07 -6.91e-06 -8.07e-07 -6.88e-06   erg/cm2
      90%_error_hi   2.98e-07  2.69e-07  4.09e-07  7.62e-06  8.09e-07  7.59e-06   erg/cm2
Peak flux      CPL   5.39e+00  7.82e+00  7.96e+00  1.14e+01  2.55e+01  3.26e+01   ph/cm2/s
      90%_error_low -3.67e-01 -2.34e-01 -2.41e-01 -1.63e+00 -6.31e-01 -1.77e+00   ph/cm2/s
      90%_error_hi   3.75e-01  2.35e-01  2.42e-01  1.96e+00  6.32e-01  2.07e+00   ph/cm2/s

======================================================================
Image
Pre-slew 15.0-350.0 keV image (Event data)
#   RAcent    DECcent   POSerr    Theta     Phi              Peak Cts       SNR   Name
  299.7118   -15.2928   0.0028    21.6894   100.2788        17.4390250     69.240 TRIG_00852553

Foreground time interval of the image:
-36.080  12.197 (delta_t =  48.277 [sec])
Background time interval of the image:
-239.504 -36.080 (delta_t = 203.424 [sec])
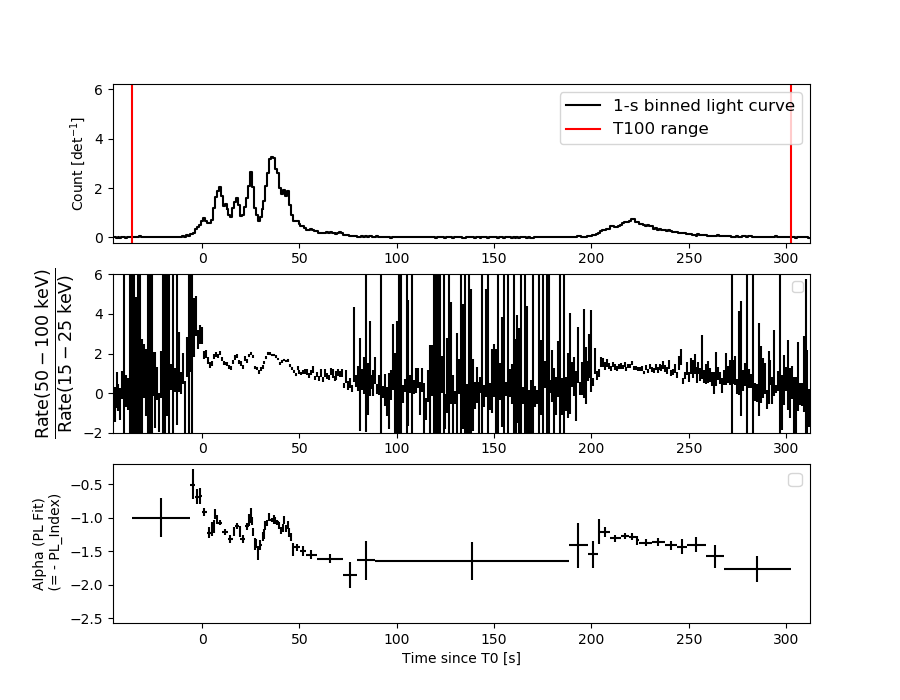
Light Curves
Note: The mask-weighted lightcurves have units of either count/det or counts/sec/det, where a det is 0.4 x 0.4 = 0.16 sq cm.
Full-time range; 1 s binning
Other quick-look light curves:
- 64 ms binning (zoomed)
- 16 ms binning (zoomed)
- 8 ms binning (zoomed)
- 2 ms binning (zoomed)
- SN=5 or 10 s binning (full-time range)
- Raw light curve
Spectra
- 64 ms binning (zoomed)
- 16 ms binning (zoomed)
- 8 ms binning (zoomed)
- 2 ms binning (zoomed)
- SN=5 or 10 s binning (full-time range)
- Raw light curve
Spectra
Notes:
- 1) The fitting includes the systematic errors.
- 2) When the burst includes telescope slew time periods, the fitting uses an average response file made from multiple 5-s response files through out the slew time plus single time preiod for the non-slew times, and weighted by the total counts in the corresponding time period using addrmf. An average response file is needed becuase a spectral fit using the pre-slew DRM will introduce some errors in both a spectral shape and a normalization if the PHA file contains a lot of the slew/post-slew time interval.
- 3) For fits to more complicated models (e.g. a power-law over a cutoff power-law), the BAT team has decided to require a chi-square improvement of more than 6 for each extra dof.
Time averaged spectrum fit using the average DRM
Power-law model
Time interval is from  -36.080 sec. to  302.308 sec.

Spectral model in power-law:
------------------------------------------------------------
Parameters  : value       lower 90%   higher 90%
Photon index: -1.23993     ( -0.0207847   0.0208776 )
Norm@50keV  : 2.13272E-02    ( -0.000271273   0.000270639 )
------------------------------------------------------------
#Fit statistic : Chi-Squared =          35.42 using 59 PHA bins.
# Reduced chi-squared =         0.6213 for     57 degrees of freedom
# Null hypothesis probability =   9.889731e-01

Photon flux (15-150 keV)    in 338.4 sec: 2.51838 ( -0.03679  0.03691 ) ph/cm2/s
Energy fluence (15-150 keV)             : 7.24305e-05 ( -7.99568e-07  7.98076e-07 ) ergs/cm2
Cutoff power-law model
Time interval is from  -36.080 sec. to  302.308 sec.
Spectral model in the cutoff power-law:
------------------------------------------------------------
Parameters  : value       lower 90%   higher 90%
Photon index: -1.10491     ( -0.0859186   0.0875752 )
Epeak [keV] : 449.104      ( -147.568 644.478 )
Norm@50keV  : 2.39150E-02    ( -0.0016394   0.00180231 )
------------------------------------------------------------
#Fit statistic : Chi-Squared =          28.25 using 59 PHA bins.
# Reduced chi-squared =         0.5045 for     56 degrees of freedom
# Null hypothesis probability =   9.992751e-01

Photon flux (15-150 keV)    in 338.4 sec: 1.46388 (    ) ph/cm2/s
Energy fluence (15-150 keV)             : 7.22322e-05 ( -8.07138e-07  8.09456e-07 ) ergs/cm2
1-s peak spectrum fit
Power-law model
Time interval is from   35.096 sec. to   36.096 sec.

Spectral model in power-law:
------------------------------------------------------------
Parameters  : value       lower 90%   higher 90%
Photon index: -1.00168     ( -0.0409705   0.0411196 )
Norm@50keV  : 0.224092    ( -0.00510883   0.00510409 )
------------------------------------------------------------
#Fit statistic : Chi-Squared =          43.07 using 59 PHA bins.
# Reduced chi-squared =         0.7557 for     57 degrees of freedom
# Null hypothesis probability =   9.138772e-01

Photon flux (15-150 keV)    in 1 sec: 1.21964 (    ) ph/cm2/s
Energy fluence (15-150 keV)             : 2.42203e-06 ( -5.93767e-08  5.94455e-08 ) ergs/cm2
Cutoff power-law model
Time interval is from   35.096 sec. to   36.096 sec.
Spectral model in the cutoff power-law:
------------------------------------------------------------
Parameters  : value       lower 90%   higher 90%
Photon index: -0.793032     ( -0.160094   0.166757 )
Epeak [keV] : 344.914      ( -125.556 831.738 )
Norm@50keV  : 0.275150    ( -0.0384653   0.0475488 )
------------------------------------------------------------
#Fit statistic : Chi-Squared =          38.13 using 59 PHA bins.
# Reduced chi-squared =         0.6808 for     56 degrees of freedom
# Null hypothesis probability =   9.676332e-01

Photon flux (15-150 keV)    in 1 sec: 25.5400 ( -0.6308  0.6316 ) ph/cm2/s
Energy fluence (15-150 keV)             : 2.40077e-06 ( -6.21482e-08  6.20348e-08 ) ergs/cm2
Time-resolved spectra
Distribution
T90 vs. Hardness ratio plot
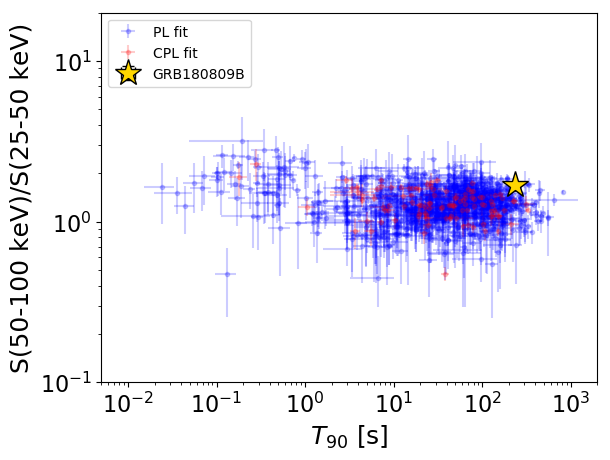
T90                                   = 233.244 sec.
Hardness ratio (energy fluence ratio) = 1.69359647659
S(15-50 keV) vs. S(50-150 keV) plot
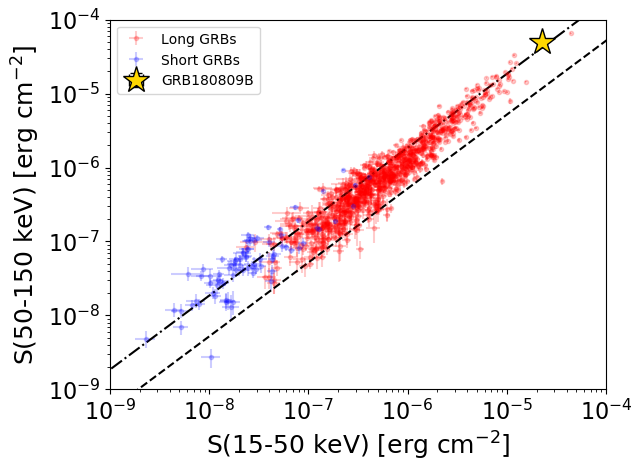
S(15-50 keV)  = 2.2802173e-05
S(50-150 keV) = 4.962791e-05
The dash-dotted line and the dashed line traces the fluences calculated from the Band function with Epeak = 15 and 150 keV, respectively. Both lines assume a canonical values of alpha = -1 and beta = -2.5.
Mask shadow pattern
IMX = -7.097095438667057E-02, IMY = -3.913512946175454E-01
Spacecraft aspect plot
Bright source in the pre-burst/pre-slew/post-slew images
Pre-burst image of 15-350 keV band
Time interval of the image:
-239.504000 -36.080000

# RAcent  DECcent POSerr Theta    Phi  PeakCts   SNR AngSep     Name
#  [deg]    [deg]    ['] [deg]  [deg]                   [']
244.9879 -15.6495    0.6  31.2  -91.1   9.3691  20.0    0.7	Sco X-1
254.4632  35.3488  105.8  54.3  -17.6   0.0796   0.1    0.5	Her X-1
255.9723 -37.8286    1.0  30.0 -139.7   3.8681  12.0    1.2	4U 1700-377
256.4577 -36.3900    4.1  28.7 -138.2   0.8330   2.8    2.3	GX 349+2
263.1702 -24.6877    5.0  16.7 -124.4   0.5648   2.3    9.4	GX 1+4
264.9320 -44.5424  165.7  31.8 -157.9  -0.0213  -0.1    9.8	4U 1735-44
268.4232  -1.2986    8.1  15.8  -29.0  -0.3391  -1.4    9.8	SW J1753.5-0127
270.2912 -25.0504    3.1  12.4 -143.9   0.8357   3.7    1.8	GX 5-1
270.4290 -25.7388    5.0  12.9 -146.1   0.5368   2.4    6.8	GRS 1758-258
273.9491 -14.1909    9.3   3.2  -79.6   0.3018   1.2    9.8	GX 17+2
275.7712 -30.3127    4.5  15.9 -170.0   0.5775   2.6    8.6	H1820-303
285.2161 -25.0361   10.6  12.9  151.2   0.2547   1.1   12.0	HT1900.1-2455
288.8103  10.9476    1.8  27.9   30.1   1.8210   6.3    0.7	GRS 1915+105
262.8199 -33.8985    6.0  23.4 -143.2  -0.4582  -1.9    9.3	GX 354-0
312.7842 -50.5517    3.7  46.0  154.5   2.2483   3.1 ------	UNKNOWN
247.3741  37.7541    2.1  59.3  -22.0   8.5558   5.5 ------	UNKNOWN
Pre-slew background subtracted image of 15-350 keV band
Time interval of the image:
-36.080000 12.196600

# RAcent  DECcent POSerr Theta    Phi  PeakCts   SNR AngSep     Name
#  [deg]    [deg]    ['] [deg]  [deg]                   [']
245.1327 -15.6897   18.8  31.0  -91.1  -0.2204  -0.6    9.3	Sco X-1
254.4308  35.2419    6.0  54.3  -17.7  -1.1447  -1.9    6.2	Her X-1
255.9764 -37.7429    8.6  29.9 -139.6   0.4059   1.3    6.1	4U 1700-377
256.5482 -36.5221   78.7  28.8 -138.5  -0.0422  -0.1    8.1	GX 349+2
262.8503 -24.8892    0.0  17.1 -124.4   0.2274   1.0   12.2	GX 1+4
264.8891 -44.4101    6.6  31.7 -157.8   0.3994   1.7    6.7	4U 1735-44
268.2181  -1.3787   13.7  15.9  -29.8  -0.1678  -0.8   10.0	SW J1753.5-0127
270.4369 -24.9247    0.0  12.2 -144.1  -0.1193  -0.6   12.4	GX 5-1
270.1491 -25.8971    0.0  13.2 -145.5   0.3436   1.7   12.4	GRS 1758-258
273.8636 -14.1974    0.0   3.3  -79.9   0.1835   1.0   12.7	GX 17+2
275.9068 -30.3563   96.8  15.9 -170.4  -0.0242  -0.1    1.1	H1820-303
285.0392 -24.8460    6.2  12.7  151.3   0.3676   1.9    4.5	HT1900.1-2455
288.8195  11.0925    6.5  28.0   30.0  -0.4349  -1.8    8.9	GRS 1915+105
263.1575 -33.7535   17.4  23.1 -143.6   0.1464   0.7    9.7	GX 354-0
312.4939 -45.3274    3.0  42.8  148.6   1.9554   3.8 ------	UNKNOWN
301.6222 -18.2001    2.7  23.6  107.6   1.1826   4.3 ------	UNKNOWN
299.7118 -15.2928    0.2  21.7  100.3  17.4393  69.3 ------	UNKNOWN
288.1732  36.4268    2.8  52.0   16.4   3.1290   4.1 ------	UNKNOWN
271.3304 -16.7727    2.6   6.2 -107.1   0.8664   4.5 ------	UNKNOWN
265.0159 -42.3705    2.9  29.8 -156.3   0.8696   4.1 ------	UNKNOWN
234.5257 -19.5784    3.4  41.1  -98.0   2.8817   3.5 ------	UNKNOWN
	UNKNOWN
Post-slew image of 15-350 keV band
Time interval of the image:
59.796630 718.579000
720.496000 962.533900

# RAcent  DECcent POSerr Theta    Phi  PeakCts   SNR AngSep     Name
#  [deg]    [deg]    ['] [deg]  [deg]                   [']
255.9794 -37.8530    1.7  44.6 -132.6  15.1702   6.9    0.6	4U 1700-377
256.3252 -36.5155   23.2  43.9 -130.9   0.9842   0.5    7.7	GX 349+2
262.8466 -24.7457   18.0  35.8 -114.9  -0.9958  -0.6    8.9	GX 1+4
264.6376 -44.2484    8.5  41.4 -145.2  -2.0235  -1.4   12.9	4U 1735-44
268.3829  -1.3885   33.3  33.9  -72.4   0.5463   0.3    3.9	SW J1753.5-0127
270.2226 -24.9987    4.3  29.2 -117.7   2.9398   2.7    5.9	GX 5-1
270.2491 -25.8701   11.8  29.4 -119.4   1.0528   1.0    8.1	GRS 1758-258
273.8557 -13.9989    5.8  25.0  -94.0   2.0674   2.0    9.0	GX 17+2
275.8965 -30.3944    4.3  26.5 -132.4   2.4271   2.7    2.2	H1820-303
284.9640 -24.7605    7.3  16.8 -130.3   1.1261   1.6   10.4	HT1900.1-2455
288.8024  10.9172    1.6  28.3  -26.6   6.3821   7.3    1.7	GRS 1915+105
299.7069  35.1929    4.3  50.5   -3.6   4.2406   2.7    5.7	Cyg X-1
308.1745  40.9556    7.2  56.8    4.0   8.3734   1.6    2.9	Cyg X-3
263.1396 -33.8069    6.4  37.8 -129.7   2.7170   1.8    7.7	GX 354-0
299.7075 -15.3000    0.3   0.0  135.0  29.8043  35.0 ------	UNKNOWN
278.8092 -14.8486    2.5  20.2  -95.1   4.0769   4.7 ------	UNKNOWN
269.7236   8.6274    2.2  38.1  -56.7   8.4848   5.3 ------	UNKNOWN