Analysis Summary
Notes:
- 1) No attempt has been made to eliminate the non-significant decimal places.
- 2) This batgrbproduct analysis is done using the HEASARC data.
- 3) This batgrbproduct analysis is using the flight position for the mask-weighting calculation.
======================================================================
                  BAT GRB EVENT DATA PROCESSING REPORT
    Process Script Ver: batgrbproduct v2.46
    Process Start Time: Fri Oct 19 18:44:01 EDT 2018
             Host Name: bat1
   Current Working Dir: /local/data/bat1/alien/Swift_3rdBATcatalog/event/batevent_reproc/trigger852903
======================================================================

  Trigger: 00852903      Segment: 000

  BAT Trigger Time: 555754971.648   [s; MET]
      Trigger Stop: 555754973.696   [s; MET]
               UTC: 2018-08-12T08:22:30.233000    [includes UTCF correction]
       Where From?: TDRSS position message

  BAT
    RA: 245.885624105366   Dec: 74.6697837972354  [deg; J2000]

     Catalogged Source?: NO
     Point Source?:      YES
     GRB Indicated?:     YES    [ by BAT flight software ]
     Image S/N Ratio:    7.57
     Image Trigger?:     NO
     Rate S/N Ratio:     11.2249721603218  [ if not an image trigger ]
     Image S/N Ratio:    7.57

  Analysis Position:   [ source = BAT ]
    RA: 245.885624105366   Dec: 74.6697837972354  [deg; J2000]

  Refined Position:   [ source = BAT pre-slew burst ]
    RA: 245.831368581864   Dec: 74.6685742511222  [deg; J2000]
        { 16h 23m 19.5s , +74d 40' 06.9" }
         +/- 2.26589837941564 [arcmin] (estimated 90% radius based on SNR)
         +/- 1.3777879542677 [arcmin] (formal 1-sigma fit error)
    SNR: 9.45435821307488

  Angular difference between the analysis and refined position is 0.863737 arcmin

  Partial Coding Fraction: 0.2617188    [ including projection effects ]

  Duration
     T90: 16.527999997139 +/- 0.970154591757242
        Measured from: -0.0880000591278076
                   to: 16.4399999380112     [s; relative to TRIGTIME]
     T50: 13.663999915123 +/- 6.0850797955308
        Measured from: 1.24000000953674
                   to: 14.9039999246597     [s; relative to TRIGTIME]


  Fluence
     Peak Flux  (peak 1 second)
        Measured from: 15.62399995327
                   to: 16.62399995327     [s; relative to TRIGTIME]
     Total Fluence
        Measured from: -0.840000033378601
                   to: 16.6280000209808     [s; relative to TRIGTIME]

             Band 1     Band 2     Band 3     Band 4
              15-25      25-50     50-100    100-350     keV
 Total     0.178123   0.429186   0.324501   0.109422
           0.057951   0.061071   0.055662   0.052230 [error]
 Peak      0.046360   0.093747   0.056042   0.032646
           0.015625   0.016160   0.015621   0.012653 [error]

     [ fluence units of on-axis counts / fully illuminated detector ]

======================================================================


====== Table of the duration information =============================

        Value   tstart    tstop
T100   17.468   -0.840   16.628
T90    16.528   -0.088   16.440
T50    13.664    1.240   14.904
Peak    1.000   15.624   16.624


====== Spectral Analysis Summary =====================================

Model      : spectral model: simple power-law (PL) and cutoff power-law (CPL)
Ph_index   : photon index: E^{Ph_index}
Ph_90err   : 90% error of the photon index
Epeak      : Epeak in keV
Epeak_90err: 90% error of Epeak
Norm       : normalization at 50 keV in both the PL model and CPL model
Nomr_90err : 90% error of the normalization
chi2       : Chi-Squared
dof        : degree of freedo

=== Time-averaged spectral analysis ===
(Best model with acceptable fit: PL)

Model Ph_index Ph_90err_low Ph_90err_hi  Epeak  Epeak_90err_low  Epeak_90err_hi  Norm       Nomr_90err_low    Norm_90err_hi    chi2    dof
PL      -1.237    -0.267      0.274       -           -               -         4.59e-03     -7.17e-04          7.17e-04      58.920   57
CPL     -0.489    -0.949      1.739      106.886      N/A           N/A         1.05e-02        N/A               N/A         57.910   56


=== 1-s peak spectral analysis ===
(Best model with acceptable fit: PL)

Model Ph_index Ph_90err_low Ph_90err_hi  Epeak  Epeak_90err_low  Epeak_90err_hi  Norm       Nomr_90err_low    Norm_90err_hi    chi2    dof
PL      -1.303     -0.355     0.361       -           -               -         1.53e-02     -3.32e-03          3.32e-03      61.520   57
CPL     -0.453     -1.864     2.731       91.702      N/A           N/A         4.12e-02        N/A               N/A         60.750   56


=== Fluence/Peak Flux Summary ===

              Model    Band1     Band2     Band3     Band4     Band5     Total
                       15-25     25-50    50-100    100-350    15-150    15-350    keV
Fluence         PL   8.02e-08  1.73e-07  2.94e-07  1.14e-06  8.06e-07  1.69e-06   erg/cm2
      90%_error_low -2.28e-08 -3.15e-08 -5.40e-08 -4.02e-07 -1.36e-07 -4.45e-07   erg/cm2
      90%_error_hi   2.49e-08  3.08e-08  5.33e-08  5.36e-07  1.37e-07  5.57e-07   erg/cm2
Peak flux       PL   5.22e-01  5.91e-01  4.79e-01  6.47e-01  1.83e+00  2.24e+00   ph/cm2/s
      90%_error_low -1.91e-01 -1.47e-01 -1.21e-01 -2.80e-01 -4.08e-01 -4.95e-01   ph/cm2/s
      90%_error_hi   2.14e-01  1.44e-01  1.19e-01  3.83e-01  4.10e-01  5.03e-01   ph/cm2/s

Fluence        CPL   6.88e-08  1.85e-07  3.11e-07  4.41e-07  7.66e-07  1.01e-06   erg/cm2
      90%_error_low -2.91e-08 -3.71e-08 -6.18e-08 -3.33e-07 -1.63e-07 -3.66e-07   erg/cm2
      90%_error_hi   3.08e-08  3.96e-08  6.42e-08  8.41e-07  1.54e-07  1.14e-06   erg/cm2
Peak flux      CPL   4.50e-01  6.43e-01  5.15e-01  2.74e-01  1.78e+00  1.88e+00   ph/cm2/s
      90%_error_low -2.30e-01 -1.76e-01 -1.40e-01 -2.74e-01 -4.28e-01 -5.14e-01   ph/cm2/s
      90%_error_hi   2.52e-01  1.99e-01  1.48e-01  4.99e-01  4.22e-01  6.69e-01   ph/cm2/s

======================================================================
Image
Pre-slew 15.0-350.0 keV image (Event data)
#   RAcent    DECcent   POSerr    Theta     Phi              Peak Cts       SNR   Name
  245.8314    74.6686   0.0203    38.3541   139.0684         1.1376932      9.454 TRIG_00852903

Foreground time interval of the image:
 -0.840  16.628 (delta_t =  17.468 [sec])
Background time interval of the image:
-385.547 -370.517 (delta_t =  15.030 [sec])
-239.648  -0.840 (delta_t = 238.808 [sec])
Light Curves
Note: The mask-weighted lightcurves have units of either count/det or counts/sec/det, where a det is 0.4 x 0.4 = 0.16 sq cm.
Full-time range; 1 s binning
Other quick-look light curves:
- 64 ms binning (zoomed)
- 16 ms binning (zoomed)
- 8 ms binning (zoomed)
- 2 ms binning (zoomed)
- SN=5 or 10 s binning (full-time range)
- Raw light curve
Spectra
- 64 ms binning (zoomed)
- 16 ms binning (zoomed)
- 8 ms binning (zoomed)
- 2 ms binning (zoomed)
- SN=5 or 10 s binning (full-time range)
- Raw light curve
Spectra
Notes:
- 1) The fitting includes the systematic errors.
- 2) When the burst includes telescope slew time periods, the fitting uses an average response file made from multiple 5-s response files through out the slew time plus single time preiod for the non-slew times, and weighted by the total counts in the corresponding time period using addrmf. An average response file is needed becuase a spectral fit using the pre-slew DRM will introduce some errors in both a spectral shape and a normalization if the PHA file contains a lot of the slew/post-slew time interval.
- 3) For fits to more complicated models (e.g. a power-law over a cutoff power-law), the BAT team has decided to require a chi-square improvement of more than 6 for each extra dof.
Time averaged spectrum fit using the average DRM
Power-law model
Time interval is from   -0.840 sec. to   16.628 sec.

Spectral model in power-law:
------------------------------------------------------------
Parameters  : value       lower 90%   higher 90%
Photon index: -1.2374     ( -0.266943   0.274365 )
Norm@50keV  : 4.59390E-03    ( -0.000716943   0.000716577 )
------------------------------------------------------------
#Fit statistic : Chi-Squared =          58.92 using 59 PHA bins.
# Reduced chi-squared =          1.034 for     57 degrees of freedom
# Null hypothesis probability =   4.052475e-01

Photon flux (15-150 keV)    in 17.47 sec: 0.542244 ( -0.088106  0.08853 ) ph/cm2/s
Energy fluence (15-150 keV)             : 8.05977e-07 ( -1.35841e-07  1.37069e-07 ) ergs/cm2
Cutoff power-law model
Time interval is from   -0.840 sec. to   16.628 sec.
Spectral model in the cutoff power-law:
------------------------------------------------------------
Parameters  : value       lower 90%   higher 90%
Photon index: -0.488558     ( -0.950681   1.73688 )
Epeak [keV] : 106.886      (   )
Norm@50keV  : 1.04840E-02    (     )
------------------------------------------------------------
#Fit statistic : Chi-Squared =          57.91 using 59 PHA bins.
# Reduced chi-squared =          1.034 for     56 degrees of freedom
# Null hypothesis probability =   4.048106e-01

Photon flux (15-150 keV)    in 17.47 sec: 0.524325 ( -0.095157  0.093825 ) ph/cm2/s
Energy fluence (15-150 keV)             : 7.65866e-07 ( -1.62608e-07  1.53743e-07 ) ergs/cm2
1-s peak spectrum fit
Power-law model
Time interval is from   15.624 sec. to   16.624 sec.

Spectral model in power-law:
------------------------------------------------------------
Parameters  : value       lower 90%   higher 90%
Photon index: -1.30317     ( -0.354886   0.361335 )
Norm@50keV  : 1.53239E-02    ( -0.00332504   0.00331969 )
------------------------------------------------------------
#Fit statistic : Chi-Squared =          61.52 using 59 PHA bins.
# Reduced chi-squared =          1.079 for     57 degrees of freedom
# Null hypothesis probability =   3.174539e-01

Photon flux (15-150 keV)    in 1 sec: 1.82928 ( -0.40795  0.4097 ) ph/cm2/s
Energy fluence (15-150 keV)             : 1.51328e-07 ( -3.54556e-08  3.5835e-08 ) ergs/cm2
Cutoff power-law model
Time interval is from   15.624 sec. to   16.624 sec.
Spectral model in the cutoff power-law:
------------------------------------------------------------
Parameters  : value       lower 90%   higher 90%
Photon index: -0.452763     ( -1.86473   2.72939 )
Epeak [keV] : 91.7016      (   )
Norm@50keV  : 4.11930E-02    (     )
------------------------------------------------------------
#Fit statistic : Chi-Squared =          60.75 using 59 PHA bins.
# Reduced chi-squared =          1.085 for     56 degrees of freedom
# Null hypothesis probability =   3.088556e-01

Photon flux (15-150 keV)    in 1 sec: 1.78114 ( -0.42816  0.42162 ) ph/cm2/s
Energy fluence (15-150 keV)             : 1.42699e-07 ( -4.30025e-08  3.99806e-08 ) ergs/cm2
Time-resolved spectra
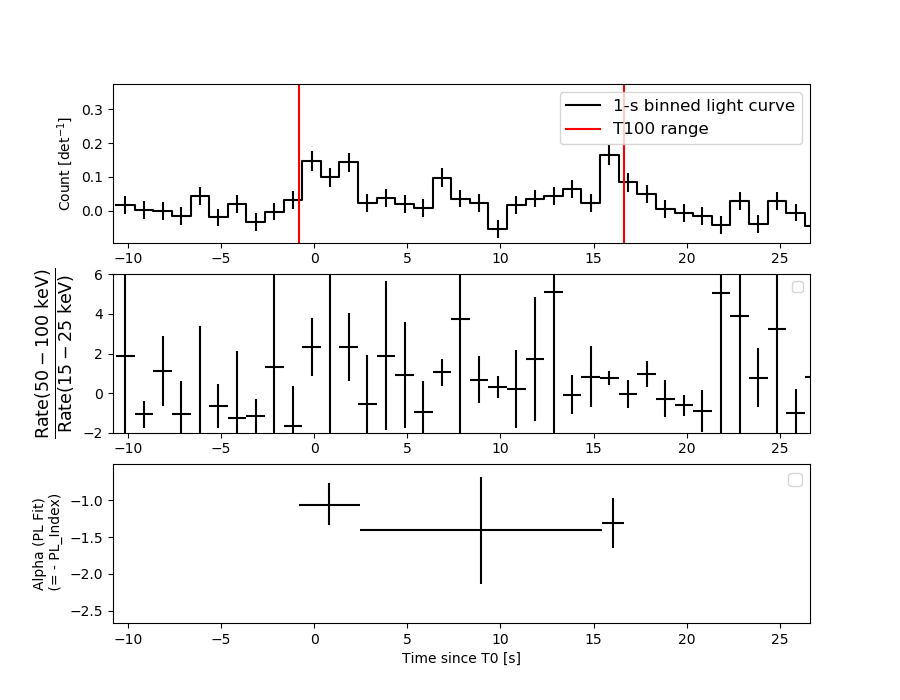
Distribution
T90 vs. Hardness ratio plot
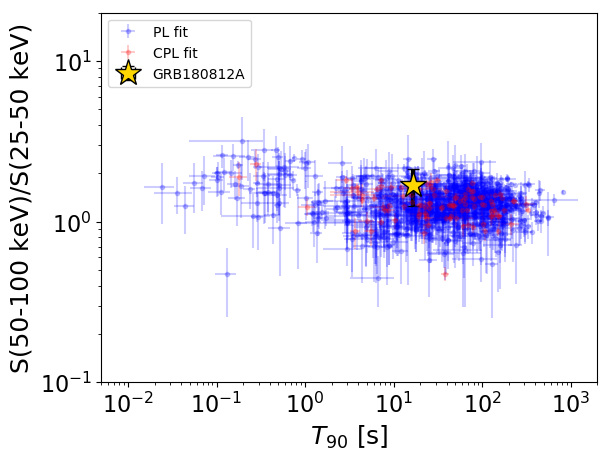
T90                                   = 16.528 sec.
Hardness ratio (energy fluence ratio) = 1.69656230409
S(15-50 keV) vs. S(50-150 keV) plot
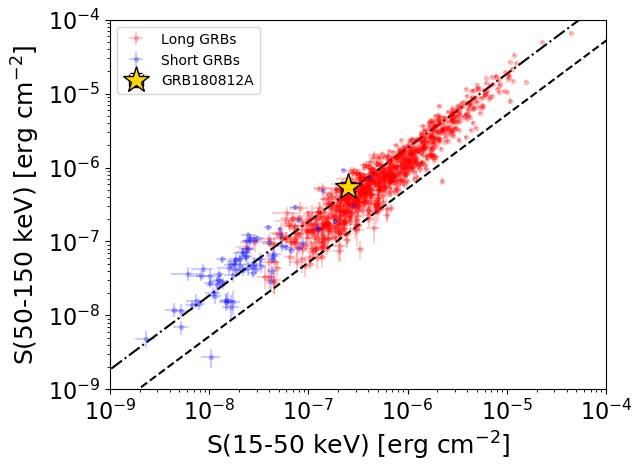
S(15-50 keV)  = 2.532367e-07
S(50-150 keV) = 5.527452e-07
The dash-dotted line and the dashed line traces the fluences calculated from the Band function with Epeak = 15 and 150 keV, respectively. Both lines assume a canonical values of alpha = -1 and beta = -2.5.
Mask shadow pattern
IMX = -5.978117210152792E-01, IMY = -5.184177835825062E-01
Spacecraft aspect plot
Bright source in the pre-burst/pre-slew/post-slew images
Pre-burst image of 15-350 keV band
Time interval of the image:
-385.547400 -370.517300
-239.648000 -0.840000

# RAcent  DECcent POSerr Theta    Phi  PeakCts   SNR AngSep     Name
#  [deg]    [deg]    ['] [deg]  [deg]                   [']
 83.6198  22.0068    0.7  49.5   -4.9   8.8035  16.8    0.9	Crab
 55.4600  55.2352    2.6  36.6   51.3   2.3061   4.5 ------	UNKNOWN
 68.0536  55.3668    2.6  30.8   43.6   1.6308   4.5 ------	UNKNOWN
159.3095  66.6462    2.5  14.8  171.5   1.2075   4.5 ------	UNKNOWN
149.7931  26.1358    3.3  38.0  -96.2   2.8526   3.5 ------	UNKNOWN
Pre-slew background subtracted image of 15-350 keV band
Time interval of the image:
-0.840000 16.628000

# RAcent  DECcent POSerr Theta    Phi  PeakCts   SNR AngSep     Name
#  [deg]    [deg]    ['] [deg]  [deg]                   [']
 83.6998  22.1039    5.9  49.4   -4.9   0.2327   1.9    6.5	Crab
245.8311  74.6684    1.2  38.4  139.1   1.1376   9.5 ------	UNKNOWN
 62.5285  86.2286    3.1  27.5  109.6   0.3219   3.7 ------	UNKNOWN
194.3503  27.0203    2.1  55.4 -146.7   1.5827   5.6 ------	UNKNOWN
Post-slew image of 15-350 keV band
Time interval of the image:
91.252600 962.386300

# RAcent  DECcent POSerr Theta    Phi  PeakCts   SNR AngSep     Name
#  [deg]    [deg]    ['] [deg]  [deg]                   [']
254.3529  35.3025    4.6  39.6  152.1   3.2267   2.5    5.7	Her X-1
 30.8847  67.0368    2.9  36.5    5.0   3.3059   4.0 ------	UNKNOWN
246.4685  88.2131    3.4  13.5  -17.0   2.0651   3.4 ------	UNKNOWN
 65.2841  54.4366    2.8  50.9  -16.6   5.9206   4.2 ------	UNKNOWN
183.4829  67.4682    3.0  20.3  -94.9   2.7727   3.8 ------	UNKNOWN
206.0231  21.8688    3.5  56.8 -151.8  15.5593   3.3 ------	UNKNOWN