Analysis Summary
Notes:
- 1) No attempt has been made to eliminate the non-significant decimal places.
- 2) This batgrbproduct analysis is done using the HEASARC data.
- 3) This batgrbproduct analysis is using the flight position for the mask-weighting calculation.
======================================================================
                  BAT GRB EVENT DATA PROCESSING REPORT
    Process Script Ver: batgrbproduct v2.46
    Process Start Time: Fri Oct 19 18:41:40 EDT 2018
             Host Name: bat1
   Current Working Dir: /local/data/bat1/alien/Swift_3rdBATcatalog/event/batevent_reproc/trigger853824
======================================================================

  Trigger: 00853824      Segment: 000

  BAT Trigger Time: 556254745.472   [s; MET]
      Trigger Stop: 556254747.52   [s; MET]
               UTC: 2018-08-18T03:12:04.026320    [includes UTCF correction]
       Where From?: TDRSS position message

  BAT
    RA: 169.611178716171   Dec: -48.3444485884011  [deg; J2000]

     Catalogged Source?: NO
     Point Source?:      YES
     GRB Indicated?:     YES    [ by BAT flight software ]
     Image S/N Ratio:    7.09
     Image Trigger?:     NO
     Rate S/N Ratio:     8.30662386291807  [ if not an image trigger ]
     Image S/N Ratio:    7.09

  Analysis Position:   [ source = BAT ]
    RA: 169.611178716171   Dec: -48.3444485884011  [deg; J2000]

  Refined Position:   [ source = BAT pre-slew burst ]
    RA: 169.697910172213   Dec: -48.3441283355387  [deg; J2000]
        { 11h 18m 47.5s , -48d 20' 38.9" }
         +/- 2.25807854736247 [arcmin] (estimated 90% radius based on SNR)
         +/- 0.878051906165051 [arcmin] (formal 1-sigma fit error)
    SNR: 9.50116559434281

  Angular difference between the analysis and refined position is 3.458833 arcmin

  Partial Coding Fraction: 0.7890625    [ including projection effects ]

  Duration
     T90: 13.7120000123978 +/- 4.05053675162408
        Measured from: -1.60000002384186
                   to: 12.1119999885559     [s; relative to TRIGTIME]
     T50: 5.91999995708466 +/- 2.40474200278857
        Measured from: 1.18400001525879
                   to: 7.10399997234344     [s; relative to TRIGTIME]


  Fluence
     Peak Flux  (peak 1 second)
        Measured from: 1.6360000371933
                   to: 2.6360000371933     [s; relative to TRIGTIME]
     Total Fluence
        Measured from: -2.14400005340576
                   to: 14.095999956131     [s; relative to TRIGTIME]

             Band 1     Band 2     Band 3     Band 4
              15-25      25-50     50-100    100-350     keV
 Total     0.229433   0.192534   0.073955   0.051671
           0.030013   0.030679   0.026773   0.024796 [error]
 Peak      0.035751   0.036374   0.004326   0.007113
           0.007672   0.008122   0.006910   0.006202 [error]

     [ fluence units of on-axis counts / fully illuminated detector ]

======================================================================


====== Table of the duration information =============================

        Value   tstart    tstop
T100   16.240   -2.144   14.096
T90    13.712   -1.600   12.112
T50     5.920    1.184    7.104
Peak    1.000    1.636    2.636


====== Spectral Analysis Summary =====================================

Model      : spectral model: simple power-law (PL) and cutoff power-law (CPL)
Ph_index   : photon index: E^{Ph_index}
Ph_90err   : 90% error of the photon index
Epeak      : Epeak in keV
Epeak_90err: 90% error of Epeak
Norm       : normalization at 50 keV in both the PL model and CPL model
Nomr_90err : 90% error of the normalization
chi2       : Chi-Squared
dof        : degree of freedo

=== Time-averaged spectral analysis ===
(Best model with acceptable fit: PL)

Model Ph_index Ph_90err_low Ph_90err_hi  Epeak  Epeak_90err_low  Epeak_90err_hi  Norm       Nomr_90err_low    Norm_90err_hi    chi2    dof
PL      -2.153    -0.380      0.334       -           -               -         1.70e-03     -4.31e-04          4.13e-04      47.850   57
CPL     -1.994     1.994      1.994        1.737      N/A           N/A         2.08e-03        N/A               N/A         47.990   56


=== 1-s peak spectral analysis ===
(Best model with acceptable fit: N/A)

Model Ph_index Ph_90err_low Ph_90err_hi  Epeak  Epeak_90err_low  Epeak_90err_hi  Norm       Nomr_90err_low    Norm_90err_hi    chi2    dof
PL      -2.112     -0.585     0.494       -           -               -         4.04e-03     -1.64e-03          1.60e-03      70.930   57
CPL      0.395     -2.642     4.678       32.544     -32.544       -32.544      1.75e-01     -1.75e-01          2.49e+02      68.780   56


=== Fluence/Peak Flux Summary ===

              Model    Band1     Band2     Band3     Band4     Band5     Total
                       15-25     25-50    50-100    100-350    15-150    15-350    keV
Fluence         PL   6.53e-08  8.08e-08  7.27e-08  1.13e-07  2.58e-07  3.32e-07   erg/cm2
      90%_error_low -1.41e-08 -1.43e-08 -2.42e-08 -5.97e-08 -5.47e-08 -9.32e-08   erg/cm2
      90%_error_hi   1.44e-08  1.40e-08  2.59e-08  9.37e-08  5.76e-08  1.20e-07   erg/cm2
Peak flux       PL   3.01e-01  2.11e-01  9.77e-02  6.33e-02  6.40e-01  6.73e-01   ph/cm2/s
      90%_error_low -1.04e-01 -6.29e-02 -4.78e-02 -6.33e-02 -1.81e-01 -1.95e-01   ph/cm2/s
      90%_error_hi   1.07e-01  6.17e-02  5.35e-02  8.02e-02  1.81e-01  1.98e-01   ph/cm2/s

Fluence        CPL   6.40e-08   N/A     6.59e-08  8.40e-08  2.55e-07  2.96e-07   erg/cm2
      90%_error_low    N/A    -1.43e-08    N/A       N/A    -6.37e-08    N/A      erg/cm2
      90%_error_hi     N/A     1.40e-08    N/A       N/A     6.22e-08    N/A      erg/cm2
Peak flux      CPL   2.78e-01  2.75e-01  6.05e-02  1.56e-03  6.15e-01  6.15e-01   ph/cm2/s
      90%_error_low -1.20e-01 -9.44e-02 -6.05e-02 -1.56e-03 -1.71e-01 -1.71e-01   ph/cm2/s
      90%_error_hi   1.18e-01  9.66e-02  7.01e-02  9.30e-02  1.74e-01  1.74e-01   ph/cm2/s

======================================================================
Image
Pre-slew 15.0-350.0 keV image (Event data)
#   RAcent    DECcent   POSerr    Theta     Phi              Peak Cts       SNR   Name
  169.6979   -48.3441   0.0202    15.9361    80.3643         0.5702285      9.501 TRIG_00853824

Foreground time interval of the image:
 -2.144  14.096 (delta_t =  16.240 [sec])
Background time interval of the image:
-239.472  -2.144 (delta_t = 237.328 [sec])
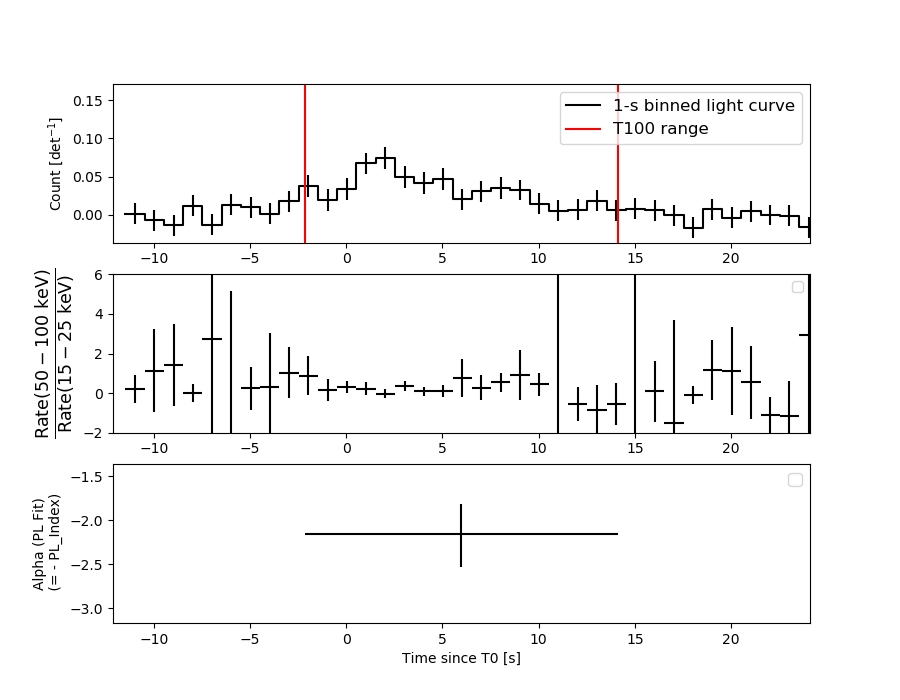
Light Curves
Note: The mask-weighted lightcurves have units of either count/det or counts/sec/det, where a det is 0.4 x 0.4 = 0.16 sq cm.
Full-time range; 1 s binning
Other quick-look light curves:
- 64 ms binning (zoomed)
- 16 ms binning (zoomed)
- 8 ms binning (zoomed)
- 2 ms binning (zoomed)
- SN=5 or 10 s binning (full-time range)
- Raw light curve
Spectra
- 64 ms binning (zoomed)
- 16 ms binning (zoomed)
- 8 ms binning (zoomed)
- 2 ms binning (zoomed)
- SN=5 or 10 s binning (full-time range)
- Raw light curve
Spectra
Notes:
- 1) The fitting includes the systematic errors.
- 2) When the burst includes telescope slew time periods, the fitting uses an average response file made from multiple 5-s response files through out the slew time plus single time preiod for the non-slew times, and weighted by the total counts in the corresponding time period using addrmf. An average response file is needed becuase a spectral fit using the pre-slew DRM will introduce some errors in both a spectral shape and a normalization if the PHA file contains a lot of the slew/post-slew time interval.
- 3) For fits to more complicated models (e.g. a power-law over a cutoff power-law), the BAT team has decided to require a chi-square improvement of more than 6 for each extra dof.
Time averaged spectrum fit using the average DRM
Power-law model

Time interval is from   -2.144 sec. to   14.096 sec.

Spectral model in power-law:
------------------------------------------------------------
Parameters  : value       lower 90%   higher 90%
Photon index: -2.15339     ( -0.379878   0.333913 )
Norm@50keV  : 1.69910E-03    ( -0.000430791   0.00041257 )
------------------------------------------------------------
#Fit statistic : Chi-Squared =          47.85 using 59 PHA bins.
# Reduced chi-squared =         0.8395 for     57 degrees of freedom
# Null hypothesis probability =   8.006667e-01

Photon flux (15-150 keV)    in 16.24 sec: 0.274603 ( -0.044615  0.044623 ) ph/cm2/s
Energy fluence (15-150 keV)             : 2.57914e-07 ( -5.46567e-08  5.75836e-08 ) ergs/cm2
Cutoff power-law model
Time interval is from   -2.144 sec. to   14.096 sec.
Spectral model in the cutoff power-law:
------------------------------------------------------------
Parameters  : value       lower 90%   higher 90%
Photon index: -2.34121     ( 1.99395   1.99395 )
Epeak [keV] : 136.642      (   )
Norm@50keV  : 1.33115E-03    (     )
------------------------------------------------------------
#Fit statistic : Chi-Squared =          47.69 using 59 PHA bins.
# Reduced chi-squared =         0.8515 for     56 degrees of freedom
# Null hypothesis probability =   7.776592e-01

Photon flux (15-150 keV)    in 16.24 sec: 0.255793 (    ) ph/cm2/s
Energy fluence (15-150 keV)             : 2.54822e-07 ( -6.36843e-08  6.21977e-08 ) ergs/cm2
1-s peak spectrum fit
Power-law model
Time interval is from    1.636 sec. to    2.636 sec.

Spectral model in power-law:
------------------------------------------------------------
Parameters  : value       lower 90%   higher 90%
Photon index: -2.11166     ( -0.585139   0.493693 )
Norm@50keV  : 4.04425E-03    ( -0.00164071   0.00160402 )
------------------------------------------------------------
#Fit statistic : Chi-Squared =          70.93 using 59 PHA bins.
# Reduced chi-squared =          1.244 for     57 degrees of freedom
# Null hypothesis probability =   1.015116e-01

Photon flux (15-150 keV)    in 1 sec: 0.640009 ( -0.180656  0.1809 ) ph/cm2/s
Energy fluence (15-150 keV)             : 3.76279e-08 ( -1.31604e-08  1.43609e-08 ) ergs/cm2
Cutoff power-law model
Time interval is from    1.636 sec. to    2.636 sec.
Spectral model in the cutoff power-law:
------------------------------------------------------------
Parameters  : value       lower 90%   higher 90%
Photon index: 0.395312     ( -2.67701   4.64355 )
Epeak [keV] : 32.5443      ( -32.5644 -32.5644 )
Norm@50keV  : 0.174593    ( -0.199967   248.605 )
------------------------------------------------------------
#Fit statistic : Chi-Squared =          68.78 using 59 PHA bins.
# Reduced chi-squared =          1.228 for     56 degrees of freedom
# Null hypothesis probability =   1.172913e-01

Photon flux (15-150 keV)    in 1 sec: 0.615221 ( -0.170834  0.173932 ) ph/cm2/s
Energy fluence (15-150 keV)             : 0 ( 0  0 ) ergs/cm2
Time-resolved spectra
Distribution
T90 vs. Hardness ratio plot
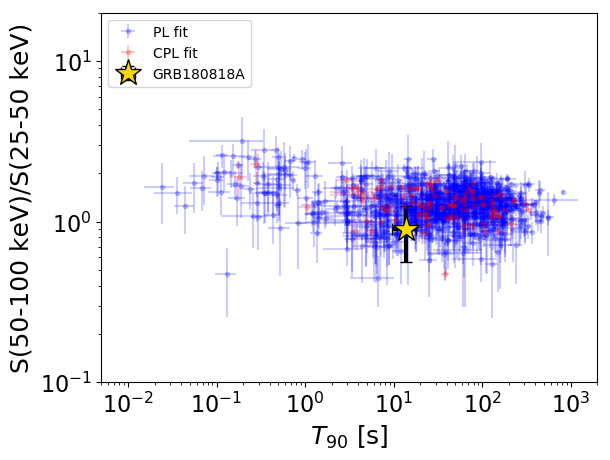
T90                                   = 13.712 sec.
Hardness ratio (energy fluence ratio) = 0.899166270383
S(15-50 keV) vs. S(50-150 keV) plot
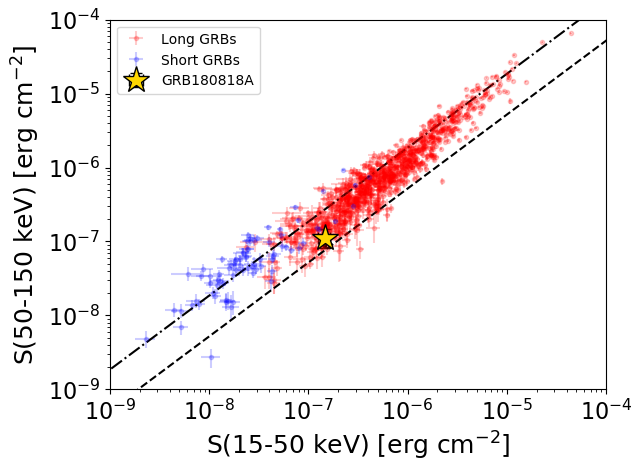
S(15-50 keV)  = 1.4616185e-07
S(50-150 keV) = 1.1175106e-07
The dash-dotted line and the dashed line traces the fluences calculated from the Band function with Epeak = 15 and 150 keV, respectively. Both lines assume a canonical values of alpha = -1 and beta = -2.5.
Mask shadow pattern
IMX = 4.779451202660808E-02, IMY = -2.815104026009791E-01
Spacecraft aspect plot
Bright source in the pre-burst/pre-slew/post-slew images
Pre-burst image of 15-350 keV band
Time interval of the image:
-239.472000 -2.144000

# RAcent  DECcent POSerr Theta    Phi  PeakCts   SNR AngSep     Name
#  [deg]    [deg]    ['] [deg]  [deg]                   [']
135.5526 -40.5448    0.8  18.0  177.7   3.4230  15.0    1.2	Vela X-1
170.4145 -60.6361    4.2  26.7   97.1   0.9920   2.8    3.0	Cen X-3
186.6603 -62.5897   21.9  32.8   86.8   0.2588   0.5   10.8	GX 301-2
168.6034   0.1516    2.4  36.9  -49.8   2.0332   4.8 ------	UNKNOWN
160.5546   8.3683    3.0  43.7  -64.2   5.0247   3.8 ------	UNKNOWN
Pre-slew background subtracted image of 15-350 keV band
Time interval of the image:
-2.144000 14.096000

# RAcent  DECcent POSerr Theta    Phi  PeakCts   SNR AngSep     Name
#  [deg]    [deg]    ['] [deg]  [deg]                   [']
135.6068 -40.4961    3.4  18.0  177.8  -0.1762  -3.4    5.0	Vela X-1
170.2239 -60.6724    9.4  26.7   97.4  -0.0983  -1.2    4.0	Cen X-3
186.4406 -62.6574    8.7  32.8   87.0   0.1427   1.3    9.0	GX 301-2
169.6979 -48.3441    1.2  15.9   80.4   0.5702   9.5 ------	UNKNOWN
171.1543 -15.7785    2.0  23.0  -32.9   0.3265   5.8 ------	UNKNOWN
173.4105  10.3364    1.9  48.0  -47.3   1.0710   6.2 ------	UNKNOWN
Post-slew image of 15-350 keV band
Time interval of the image:
63.428590 716.676000
720.528000 962.563200

# RAcent  DECcent POSerr Theta    Phi  PeakCts   SNR AngSep     Name
#  [deg]    [deg]    ['] [deg]  [deg]                   [']
135.5322 -40.5521    0.7  25.3 -150.7  13.5147  15.7    0.2	Vela X-1
170.1735 -60.6090    1.4  12.3  112.9   5.6313   8.4    4.3	Cen X-3
186.6882 -62.7223    3.0  17.2   87.2   2.7938   3.8    3.0	GX 301-2
230.9387 -67.4912    2.9  35.7   79.1   6.1901   4.0 ------	UNKNOWN
217.5579 -37.2611    3.5  36.2   24.7   3.0750   3.3 ------	UNKNOWN
 83.7368 -43.9807    3.1  56.4  173.7  18.7715   3.7 ------	UNKNOWN
219.3931 -18.2742    2.7  50.1    5.3   6.0944   4.3 ------	UNKNOWN
 96.0097 -35.3509    2.6  54.2 -171.0  10.7730   4.5 ------	UNKNOWN
204.7309 -12.5777    2.5  46.1  -14.5   5.2215   4.7 ------	UNKNOWN
101.9851 -35.2037    3.8  50.4 -167.1   5.8001   3.1 ------	UNKNOWN
169.1084 -16.1114    3.0  32.2  -66.6   4.6215   3.9 ------	UNKNOWN
204.1547   2.3753    3.5  58.9  -24.3  14.0974   3.3 ------	UNKNOWN
178.0384  -2.0611    3.4  46.8  -54.2  13.0512   3.3 ------	UNKNOWN
120.0833 -16.9293    3.5  50.9 -135.4  16.9585   3.3 ------	UNKNOWN