Analysis Summary
Notes:
- 1) No attempt has been made to eliminate the non-significant decimal places.
- 2) This batgrbproduct analysis is done using the HEASARC data.
- 3) This batgrbproduct analysis is using the flight position for the mask-weighting calculation.
======================================================================
BAT GRB EVENT DATA PROCESSING REPORT
Process Script Ver: batgrbproduct v2.46
Process Start Time: Fri Oct 19 18:38:35 EDT 2018
Host Name: bat1
Current Working Dir: /local/data/bat1/alien/Swift_3rdBATcatalog/event/batevent_reproc/trigger853882
======================================================================
Trigger: 00853882 Segment: 000
BAT Trigger Time: 556288240 [s; MET]
Trigger Stop: 556288368 [s; MET]
UTC: 2018-08-18T12:30:18.552260 [includes UTCF correction]
Where From?: TDRSS position message
BAT
RA: 104.235169748593 Dec: 39.328619125846 [deg; J2000]
Catalogged Source?: NO
Point Source?: YES
GRB Indicated?: YES [ by BAT flight software ]
Image S/N Ratio: 10.17
Image Trigger?: YES
Rate S/N Ratio: 0 [ if not an image trigger ]
Image S/N Ratio: 10.17
Analysis Position: [ source = BAT ]
RA: 104.235169748593 Dec: 39.328619125846 [deg; J2000]
Refined Position: [ source = BAT pre-slew burst ]
RA: 104.2255323748 Dec: 39.3103621957179 [deg; J2000]
{ 06h 56m 54.1s , +39d 18' 37.3" }
+/- 1.65256145493132 [arcmin] (estimated 90% radius based on SNR)
+/- 0.687718571376997 [arcmin] (formal 1-sigma fit error)
SNR: 14.8410503592937
Angular difference between the analysis and refined position is 1.183238 arcmin
Partial Coding Fraction: 0.890625 [ including projection effects ]
Duration
T90: 137.459999918938 +/- 9.7000667230781
Measured from: -89.7120000123978
to: 47.7479999065399 [s; relative to TRIGTIME]
T50: 110.439999938011 +/- 4.47276741178899
Measured from: -80.9279999732971
to: 29.5119999647141 [s; relative to TRIGTIME]
Fluence
Peak Flux (peak 1 second)
Measured from: -82.1119999885559
to: -81.1119999885559 [s; relative to TRIGTIME]
Total Fluence
Measured from: -93.5800000429153
to: 62.7439999580383 [s; relative to TRIGTIME]
Band 1 Band 2 Band 3 Band 4
15-25 25-50 50-100 100-350 keV
Total 1.225750 1.678227 0.883426 0.149702
0.087604 0.090779 0.078307 0.068087 [error]
Peak 0.043025 0.066838 0.023112 0.017085
0.007485 0.008200 0.006842 0.005706 [error]
[ fluence units of on-axis counts / fully illuminated detector ]
======================================================================
====== Table of the duration information =============================
Value tstart tstop
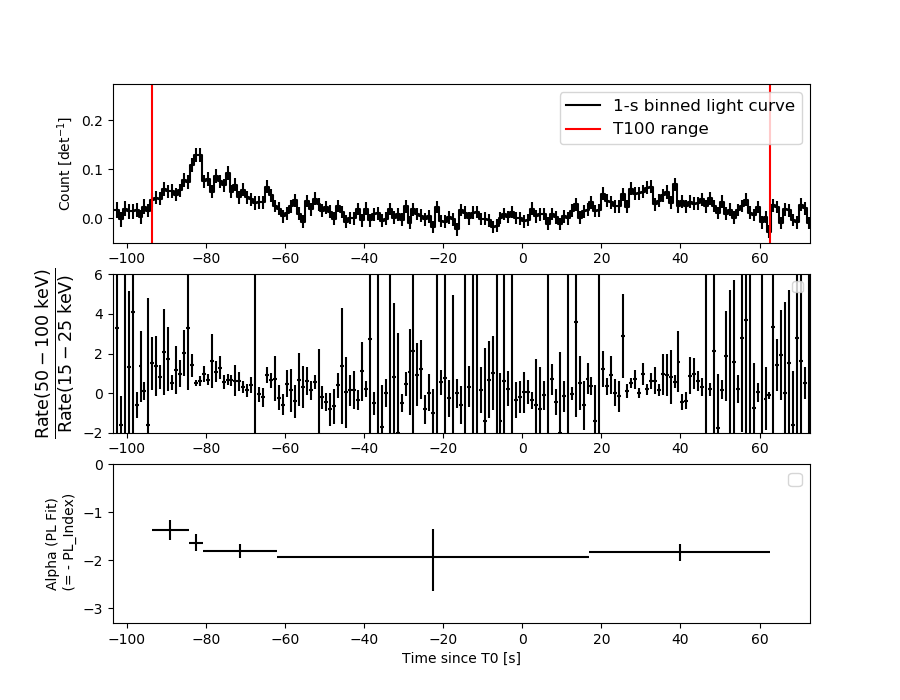
T100 156.324 -93.580 62.744
T90 137.460 -89.712 47.748
T50 110.440 -80.928 29.512
Peak 1.000 -82.112 -81.112
====== Spectral Analysis Summary =====================================
Model : spectral model: simple power-law (PL) and cutoff power-law (CPL)
Ph_index : photon index: E^{Ph_index}
Ph_90err : 90% error of the photon index
Epeak : Epeak in keV
Epeak_90err: 90% error of Epeak
Norm : normalization at 50 keV in both the PL model and CPL model
Nomr_90err : 90% error of the normalization
chi2 : Chi-Squared
dof : degree of freedo
=== Time-averaged spectral analysis ===
(Best model with acceptable fit: PL)
Model Ph_index Ph_90err_low Ph_90err_hi Epeak Epeak_90err_low Epeak_90err_hi Norm Nomr_90err_low Norm_90err_hi chi2 dof
PL -1.772 -0.121 0.119 - - - 1.60e-03 -1.20e-04 1.19e-04 49.260 57
CPL -1.044 -0.519 0.598 59.130 -10.649 37.451 4.00e-03 -1.89e-03 4.45e-03 43.260 56
=== 1-s peak spectral analysis ===
(Best model with acceptable fit: PL)
Model Ph_index Ph_90err_low Ph_90err_hi Epeak Epeak_90err_low Epeak_90err_hi Norm Nomr_90err_low Norm_90err_hi chi2 dof
PL -1.732 -0.295 0.285 - - - 8.62e-03 -1.62e-03 1.57e-03 64.110 57
CPL -1.736 1.736 1.013 9998.880 N/A N/A 8.60e-03 N/A N/A 64.110 56
=== Fluence/Peak Flux Summary ===
Model Band1 Band2 Band3 Band4 Band5 Total
15-25 25-50 50-100 100-350 15-150 15-350 keV
Fluence PL 4.13e-07 6.43e-07 7.54e-07 1.71e-06 2.31e-06 3.52e-06 erg/cm2
90%_error_low -4.27e-08 -4.34e-08 -7.56e-08 -3.27e-07 -1.77e-07 -4.03e-07 erg/cm2
90%_error_hi 4.38e-08 4.34e-08 7.59e-08 3.75e-07 1.79e-07 4.40e-07 erg/cm2
Peak flux PL 4.44e-01 3.89e-01 2.34e-01 2.13e-01 1.16e+00 1.28e+00 ph/cm2/s
90%_error_low -1.07e-01 -6.35e-02 -5.64e-02 -8.54e-02 -1.88e-01 -2.12e-01 ph/cm2/s
90%_error_hi 1.11e-01 6.34e-02 5.67e-02 1.16e-01 1.88e-01 2.13e-01 ph/cm2/s
Fluence CPL 3.78e-07 6.98e-07 7.54e-07 5.76e-07 2.16e-06 2.41e-06 erg/cm2
90%_error_low -4.97e-08 -5.77e-08 -8.62e-08 -2.91e-07 -2.03e-07 -3.57e-07 erg/cm2
90%_error_hi 5.02e-08 5.95e-08 8.42e-08 6.25e-07 2.07e-07 6.43e-07 erg/cm2
Peak flux CPL 4.45e-01 3.86e-01 2.33e-01 2.15e-01 1.16e+00 1.28e+00 ph/cm2/s
90%_error_low -1.12e-01 -5.99e-02 -5.55e-02 -1.18e-01 -1.89e-01 -2.63e-01 ph/cm2/s
90%_error_hi 1.13e-01 1.09e-01 5.73e-02 1.13e-01 1.88e-01 2.10e-01 ph/cm2/s
======================================================================
Image
Pre-slew 15.0-350.0 keV image (Event data)
#   RAcent    DECcent   POSerr    Theta     Phi              Peak Cts       SNR   Name
  104.2255    39.3104   0.0129    29.4210    -8.7127         2.8004309     14.841 TRIG_00853882

Foreground time interval of the image:
-77.099  62.744 (delta_t = 139.843 [sec])
Background time interval of the image:
Light Curves
Note: The mask-weighted lightcurves have units of either count/det or counts/sec/det, where a det is 0.4 x 0.4 = 0.16 sq cm.
Full-time range; 1 s binning
Other quick-look light curves:
- 64 ms binning (zoomed)
- 16 ms binning (zoomed)
- 8 ms binning (zoomed)
- 2 ms binning (zoomed)
- SN=5 or 10 s binning (full-time range)
- Raw light curve
Spectra
- 64 ms binning (zoomed)
- 16 ms binning (zoomed)
- 8 ms binning (zoomed)
- 2 ms binning (zoomed)
- SN=5 or 10 s binning (full-time range)
- Raw light curve
Spectra
Notes:
- 1) The fitting includes the systematic errors.
- 2) When the burst includes telescope slew time periods, the fitting uses an average response file made from multiple 5-s response files through out the slew time plus single time preiod for the non-slew times, and weighted by the total counts in the corresponding time period using addrmf. An average response file is needed becuase a spectral fit using the pre-slew DRM will introduce some errors in both a spectral shape and a normalization if the PHA file contains a lot of the slew/post-slew time interval.
- 3) For fits to more complicated models (e.g. a power-law over a cutoff power-law), the BAT team has decided to require a chi-square improvement of more than 6 for each extra dof.
Time averaged spectrum fit using the average DRM
Power-law model
Time interval is from  -93.580 sec. to   62.744 sec.

Spectral model in power-law:
------------------------------------------------------------
Parameters  : value       lower 90%   higher 90%
Photon index: -1.77161     ( -0.121149   0.118759 )
Norm@50keV  : 1.60322E-03    ( -0.000119899   0.000118771 )
------------------------------------------------------------
#Fit statistic : Chi-Squared =          49.26 using 59 PHA bins.
# Reduced chi-squared =         0.8642 for     57 degrees of freedom
# Null hypothesis probability =   7.572781e-01

Photon flux (15-150 keV)    in 156.3 sec: 0.218547 ( -0.014892  0.014905 ) ph/cm2/s
Energy fluence (15-150 keV)             : 2.30999e-06 ( -1.76999e-07  1.78748e-07 ) ergs/cm2
Cutoff power-law model
Time interval is from  -93.580 sec. to   62.744 sec.
Spectral model in the cutoff power-law:
------------------------------------------------------------
Parameters  : value       lower 90%   higher 90%
Photon index: -1.04361     ( -0.519354   0.598274 )
Epeak [keV] : 59.1297      ( -10.6492 37.4506 )
Norm@50keV  : 4.00174E-03    ( -0.00188928   0.00444593 )
------------------------------------------------------------
#Fit statistic : Chi-Squared =          43.26 using 59 PHA bins.
# Reduced chi-squared =         0.7724 for     56 degrees of freedom
# Null hypothesis probability =   8.935343e-01

Photon flux (15-150 keV)    in 156.3 sec: 0.211574 ( -0.015679  0.015669 ) ph/cm2/s
Energy fluence (15-150 keV)             : 2.1576e-06 ( -2.02946e-07  2.06683e-07 ) ergs/cm2
1-s peak spectrum fit
Power-law model
Time interval is from  -82.112 sec. to  -81.112 sec.

Spectral model in power-law:
------------------------------------------------------------
Parameters  : value       lower 90%   higher 90%
Photon index: -1.73154     ( -0.294612   0.284623 )
Norm@50keV  : 8.62467E-03    ( -0.00162044   0.00157474 )
------------------------------------------------------------
#Fit statistic : Chi-Squared =          64.11 using 59 PHA bins.
# Reduced chi-squared =          1.125 for     57 degrees of freedom
# Null hypothesis probability =   2.413325e-01

Photon flux (15-150 keV)    in 1 sec: 1.15842 ( -0.188337  0.18838 ) ph/cm2/s
Energy fluence (15-150 keV)             : 7.96856e-08 ( -1.52835e-08  1.56533e-08 ) ergs/cm2
Cutoff power-law model
Time interval is from  -82.112 sec. to  -81.112 sec.
Spectral model in the cutoff power-law:
------------------------------------------------------------
Parameters  : value       lower 90%   higher 90%
Photon index: -2.00705     ( 2.00705   1.2838 )
Epeak [keV] : 2.99380      (   )
Norm@50keV  : 6.02231E-03    (     )
------------------------------------------------------------
#Fit statistic : Chi-Squared =          64.01 using 59 PHA bins.
# Reduced chi-squared =          1.143 for     56 degrees of freedom
# Null hypothesis probability =   2.159988e-01

Photon flux (15-150 keV)    in 1 sec: 1.15906 ( -0.18907  0.18803 ) ph/cm2/s
Energy fluence (15-150 keV)             : 8.00958e-08 ( -1.94864e-08  1.12776e-08 ) ergs/cm2
Time-resolved spectra
Distribution
T90 vs. Hardness ratio plot
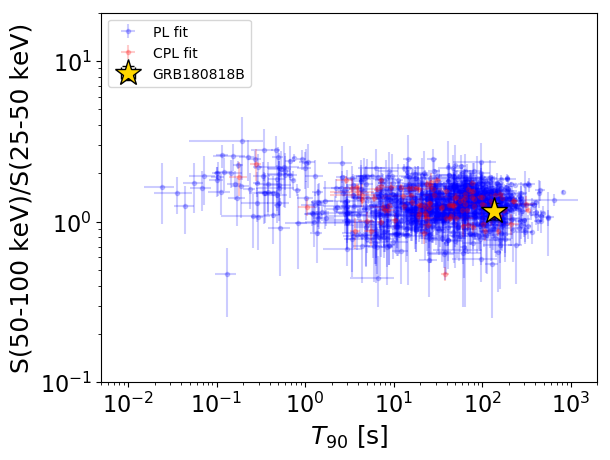
T90                                   = 137.46 sec.
Hardness ratio (energy fluence ratio) = 1.17154765157
S(15-50 keV) vs. S(50-150 keV) plot
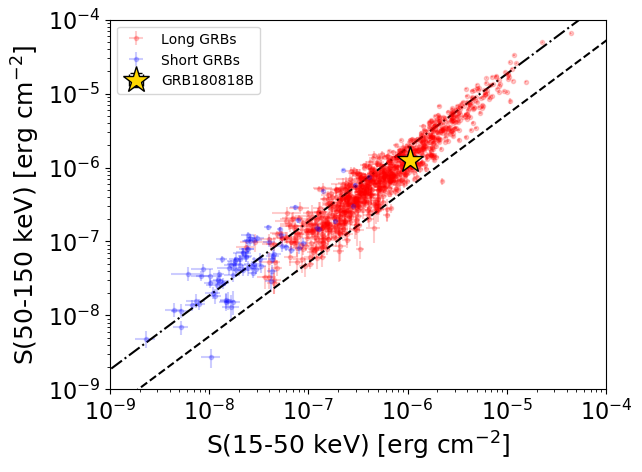
S(15-50 keV)  = 1.0565788e-06
S(50-150 keV) = 1.2534011e-06
The dash-dotted line and the dashed line traces the fluences calculated from the Band function with Epeak = 15 and 150 keV, respectively. Both lines assume a canonical values of alpha = -1 and beta = -2.5.
Mask shadow pattern
IMX = 5.574473002885124E-01, IMY = 8.542741209734461E-02
Spacecraft aspect plot
Bright source in the pre-burst/pre-slew/post-slew images
Pre-burst image of 15-350 keV band
Time interval of the image:
Pre-slew background subtracted image of 15-350 keV band
Time interval of the image:
-77.099400 62.744000

# RAcent  DECcent POSerr Theta    Phi  PeakCts   SNR AngSep     Name
#  [deg]    [deg]    ['] [deg]  [deg]                   [']
 83.6046  22.0135    1.0  53.4    0.3   5.4893  11.5    1.6	Crab
259.0004  66.7174    2.7  46.0  139.2   2.7336   4.2 ------	UNKNOWN
104.2255  39.3103    0.8  29.4   -8.7   2.8001  14.8 ------	UNKNOWN
 88.9502  21.4470    2.2  51.5   -5.5   2.1671   5.3 ------	UNKNOWN
190.1023  23.0934    2.3  51.8 -137.1   4.6773   5.0 ------	UNKNOWN
Post-slew image of 15-350 keV band
Time interval of the image:
192.900600 963.088400

# RAcent  DECcent POSerr Theta    Phi  PeakCts   SNR AngSep     Name
#  [deg]    [deg]    ['] [deg]  [deg]                   [']
 83.6207  22.0174    0.3  24.7   29.5  31.5076  44.9    0.7	Crab
 58.4701  37.0031    2.8  35.7   79.2   6.2993   4.1 ------	UNKNOWN
 86.9088 -15.2887    2.7  56.9   -1.9  11.9748   4.3 ------	UNKNOWN
203.1833  67.6172    2.7  57.3 -175.4  15.9752   4.2 ------	UNKNOWN
125.2390  48.6750    2.8  17.7 -150.8   2.6951   4.1 ------	UNKNOWN
 91.9843 -14.6474    2.6  55.2   -7.5   8.5101   4.5 ------	UNKNOWN
186.9567  55.1449    3.0  54.8 -158.1  12.7864   3.8 ------	UNKNOWN
156.2611  41.7389    3.5  39.0 -132.9   4.1794   3.3 ------	UNKNOWN