Analysis Summary
Notes:
- 1) No attempt has been made to eliminate the non-significant decimal places.
- 2) This batgrbproduct analysis is done using the HEASARC data.
- 3) This batgrbproduct analysis is using the flight position for the mask-weighting calculation.
======================================================================
                  BAT GRB EVENT DATA PROCESSING REPORT
    Process Script Ver: batgrbproduct v2.46
    Process Start Time: Fri Oct 26 16:24:38 EDT 2018
             Host Name: bat1
   Current Working Dir: /local/data/bat1/alien/Swift_3rdBATcatalog/event/batevent_reproc/trigger859421
======================================================================

  Trigger: 00859421      Segment: 000

  BAT Trigger Time: 557848688   [s; MET]
      Trigger Stop: 557848752   [s; MET]
               UTC: 2018-09-05T13:57:46.456140    [includes UTCF correction]
       Where From?: TDRSS position message

  BAT
    RA: 91.0352587911709   Dec: -4.59128989702066  [deg; J2000]

     Catalogged Source?: NO
     Point Source?:      YES
     GRB Indicated?:     YES    [ by BAT flight software ]
     Image S/N Ratio:    10.32
     Image Trigger?:     YES
     Rate S/N Ratio:     0  [ if not an image trigger ]
     Image S/N Ratio:    10.32

  Analysis Position:   [ source = BAT ]
    RA: 91.0352587911709   Dec: -4.59128989702066  [deg; J2000]

  Refined Position:   [ source = BAT pre-slew burst ]
    RA: 91.0383700527125   Dec: -4.59218787784411  [deg; J2000]
        { 06h 04m 09.2s , -04d 35' 31.9" }
         +/- 1.70293470500395 [arcmin] (estimated 90% radius based on SNR)
         +/- 0.625917281207332 [arcmin] (formal 1-sigma fit error)
    SNR: 14.2179023834398

  Angular difference between the analysis and refined position is 0.193720 arcmin

  Partial Coding Fraction: 0.2929688    [ including projection effects ]

  Duration
     T90: 165.34399998188 +/- 28.8994952744125
        Measured from: -47.2599999904633
                   to: 118.083999991417     [s; relative to TRIGTIME]
     T50: 55.067999958992 +/- 10.514913720399
        Measured from: -22.0479999780655
                   to: 33.0199999809265     [s; relative to TRIGTIME]


  Fluence
     Peak Flux  (peak 1 second)
        Measured from: -2.09200000762939
                   to: -1.09200000762939     [s; relative to TRIGTIME]
     Total Fluence
        Measured from: -58.932000041008
                   to: 146.659999966621     [s; relative to TRIGTIME]

             Band 1     Band 2     Band 3     Band 4
              15-25      25-50     50-100    100-350     keV
 Total     1.730808   2.435526   1.881047   0.411693
           0.141017   0.147103   0.128729   0.114850 [error]
 Peak      0.024613   0.037357   0.040866   0.017095
           0.011616   0.011736   0.010400   0.008847 [error]

     [ fluence units of on-axis counts / fully illuminated detector ]

======================================================================


====== Table of the duration information =============================

        Value   tstart    tstop
T100  205.592  -58.932  146.660
T90   165.344  -47.260  118.084
T50    55.068  -22.048   33.020
Peak    1.000   -2.092   -1.092


====== Spectral Analysis Summary =====================================

Model      : spectral model: simple power-law (PL) and cutoff power-law (CPL)
Ph_index   : photon index: E^{Ph_index}
Ph_90err   : 90% error of the photon index
Epeak      : Epeak in keV
Epeak_90err: 90% error of Epeak
Norm       : normalization at 50 keV in both the PL model and CPL model
Nomr_90err : 90% error of the normalization
chi2       : Chi-Squared
dof        : degree of freedo

=== Time-averaged spectral analysis ===
(Best model with acceptable fit: PL)

Model Ph_index Ph_90err_low Ph_90err_hi  Epeak  Epeak_90err_low  Epeak_90err_hi  Norm       Nomr_90err_low    Norm_90err_hi    chi2    dof
PL      -1.585    -0.118      0.117       -           -               -         2.17e-03     -1.49e-04          1.48e-04      68.610   57
CPL     -1.177    -0.447      0.505      101.576     -31.780      -101.576      3.48e-03     -1.36e-03          2.67e-03      66.270   56


=== 1-s peak spectral analysis ===
(Best model with acceptable fit: PL)

Model Ph_index Ph_90err_low Ph_90err_hi  Epeak  Epeak_90err_low  Epeak_90err_hi  Norm       Nomr_90err_low    Norm_90err_hi    chi2    dof
PL      -1.518     -0.517     0.515       -           -               -         7.60e-03     -2.33e-03          2.32e-03      54.590   57
CPL     -0.915     -1.413     2.369       95.024     -95.024       -95.024      1.49e-02     -9.48e-03          1.60e-01      54.210   56


=== Fluence/Peak Flux Summary ===

              Model    Band1     Band2     Band3     Band4     Band5     Total
                       15-25     25-50    50-100    100-350    15-150    15-350    keV
Fluence         PL   6.16e-07  1.08e-06  1.43e-06  3.91e-06  4.18e-06  7.04e-06   erg/cm2
      90%_error_low -7.03e-08 -7.62e-08 -1.27e-07 -6.93e-07 -3.05e-07 -8.01e-07   erg/cm2
      90%_error_hi   7.27e-08  7.59e-08  1.27e-07  7.88e-07  3.07e-07  8.73e-07   erg/cm2
Peak flux       PL   3.18e-01  3.17e-01  2.21e-01  2.45e-01  9.53e-01  1.10e+00   ph/cm2/s
      90%_error_low -1.54e-01 -1.08e-01 -8.14e-02 -1.42e-01 -3.02e-01 -3.35e-01   ph/cm2/s
      90%_error_hi   1.79e-01  1.05e-01  7.95e-02  2.20e-01  3.05e-01  3.36e-01   ph/cm2/s

Fluence        CPL   5.74e-07  1.12e-06  1.47e-06  2.19e-06  4.06e-06  5.36e-06   erg/cm2
      90%_error_low -8.40e-08 -9.07e-08 -1.37e-07 -9.83e-07 -3.35e-07 -1.03e-06   erg/cm2
      90%_error_hi   8.57e-08  9.30e-08  1.40e-07  1.83e-06  3.35e-07  1.98e-06   erg/cm2
Peak flux      CPL   2.82e-01  3.34e-01  2.37e-01  1.39e-01  9.33e-01  9.91e-01   ph/cm2/s
      90%_error_low -1.81e-01 -1.19e-01 -9.09e-02 -1.39e-01 -3.08e-01 -3.46e-01   ph/cm2/s
      90%_error_hi   2.01e-01  1.25e-01  9.88e-02  1.69e-01  3.10e-01  3.68e-01   ph/cm2/s

======================================================================
Image
Pre-slew 15.0-350.0 keV image (Event data)
#   RAcent    DECcent   POSerr    Theta     Phi              Peak Cts       SNR   Name
   91.0384    -4.5922   0.0135    42.8595   162.2173         3.5341083     14.218 TRIG_00859421

Foreground time interval of the image:
-12.499  72.101 (delta_t =  84.600 [sec])
Background time interval of the image:
Light Curves
Note: The mask-weighted lightcurves have units of either count/det or counts/sec/det, where a det is 0.4 x 0.4 = 0.16 sq cm.
Full-time range; 1 s binning
Other quick-look light curves:
- 64 ms binning (zoomed)
- 16 ms binning (zoomed)
- 8 ms binning (zoomed)
- 2 ms binning (zoomed)
- SN=5 or 10 s binning (full-time range)
- Raw light curve
Spectra
- 64 ms binning (zoomed)
- 16 ms binning (zoomed)
- 8 ms binning (zoomed)
- 2 ms binning (zoomed)
- SN=5 or 10 s binning (full-time range)
- Raw light curve
Spectra
Notes:
- 1) The fitting includes the systematic errors.
- 2) When the burst includes telescope slew time periods, the fitting uses an average response file made from multiple 5-s response files through out the slew time plus single time preiod for the non-slew times, and weighted by the total counts in the corresponding time period using addrmf. An average response file is needed becuase a spectral fit using the pre-slew DRM will introduce some errors in both a spectral shape and a normalization if the PHA file contains a lot of the slew/post-slew time interval.
- 3) For fits to more complicated models (e.g. a power-law over a cutoff power-law), the BAT team has decided to require a chi-square improvement of more than 6 for each extra dof.
Time averaged spectrum fit using the average DRM
Power-law model
Time interval is from  -58.932 sec. to  146.660 sec.

Spectral model in power-law:
------------------------------------------------------------
Parameters  : value       lower 90%   higher 90%
Photon index: -1.58497     ( -0.118228   0.117376 )
Norm@50keV  : 2.16811E-03    ( -0.000148846   0.000148379 )
------------------------------------------------------------
#Fit statistic : Chi-Squared =          68.61 using 59 PHA bins.
# Reduced chi-squared =          1.204 for     57 degrees of freedom
# Null hypothesis probability =   1.394631e-01

Photon flux (15-150 keV)    in 205.6 sec: 0.277339 ( -0.019338  0.019379 ) ph/cm2/s
Energy fluence (15-150 keV)             : 4.17728e-06 ( -3.05476e-07  3.07212e-07 ) ergs/cm2
Cutoff power-law model
Time interval is from  -58.932 sec. to  146.660 sec.
Spectral model in the cutoff power-law:
------------------------------------------------------------
Parameters  : value       lower 90%   higher 90%
Photon index: -1.17688     ( -0.447019   0.50541 )
Epeak [keV] : 101.576      ( -31.7799 -101.576 )
Norm@50keV  : 3.47509E-03    ( -0.00135783   0.00266961 )
------------------------------------------------------------
#Fit statistic : Chi-Squared =          66.27 using 59 PHA bins.
# Reduced chi-squared =          1.183 for     56 degrees of freedom
# Null hypothesis probability =   1.638715e-01

Photon flux (15-150 keV)    in 205.6 sec: 0.271890 ( -0.020258  0.020273 ) ph/cm2/s
Energy fluence (15-150 keV)             : 4.05922e-06 ( -3.34935e-07  3.34606e-07 ) ergs/cm2
1-s peak spectrum fit
Power-law model
Time interval is from   -2.092 sec. to   -1.092 sec.

Spectral model in power-law:
------------------------------------------------------------
Parameters  : value       lower 90%   higher 90%
Photon index: -1.51796     ( -0.516879   0.514569 )
Norm@50keV  : 7.59880E-03    ( -0.00233441   0.00232394 )
------------------------------------------------------------
#Fit statistic : Chi-Squared =          54.59 using 59 PHA bins.
# Reduced chi-squared =         0.9578 for     57 degrees of freedom
# Null hypothesis probability =   5.659497e-01

Photon flux (15-150 keV)    in 1 sec: 0.953303 ( -0.302154  0.304977 ) ph/cm2/s
Energy fluence (15-150 keV)             : 7.18886e-08 ( -2.31784e-08  2.3503e-08 ) ergs/cm2
Cutoff power-law model

Time interval is from   -2.092 sec. to   -1.092 sec.
Spectral model in the cutoff power-law:
------------------------------------------------------------
Parameters  : value       lower 90%   higher 90%
Photon index: -0.914974     ( -1.41406   2.3676 )
Epeak [keV] : 95.0241      ( -94.9652 -94.9652 )
Norm@50keV  : 1.49423E-02    ( -0.00949984   0.159864 )
------------------------------------------------------------
#Fit statistic : Chi-Squared =          54.21 using 59 PHA bins.
# Reduced chi-squared =         0.9680 for     56 degrees of freedom
# Null hypothesis probability =   5.430155e-01

Photon flux (15-150 keV)    in 1 sec: 0.932796 ( -0.308037  0.310164 ) ph/cm2/s
Energy fluence (15-150 keV)             : 3.94339e-08 ( 0  0 ) ergs/cm2
Time-resolved spectra
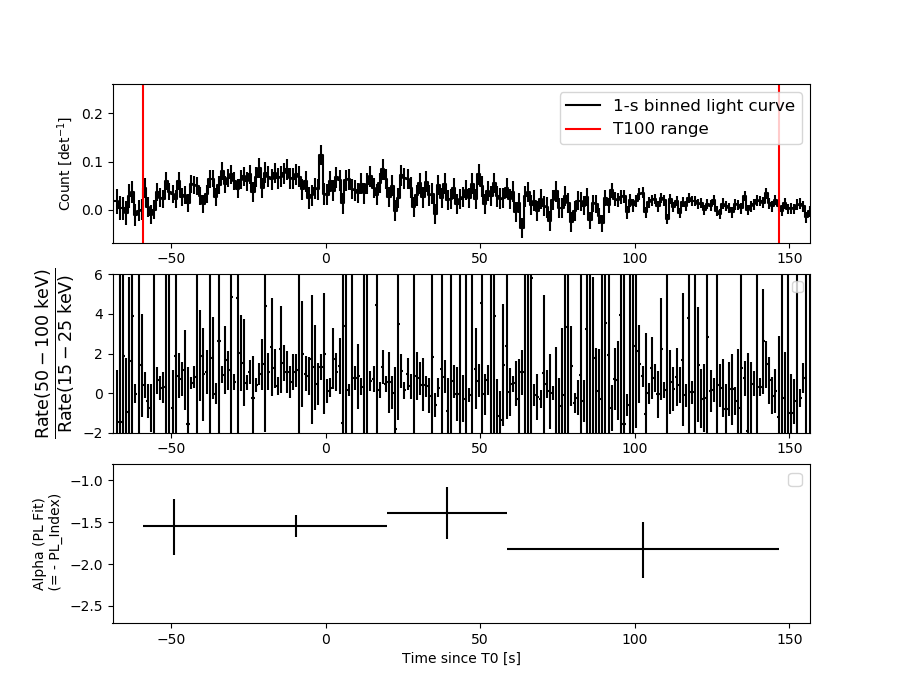
Distribution
T90 vs. Hardness ratio plot
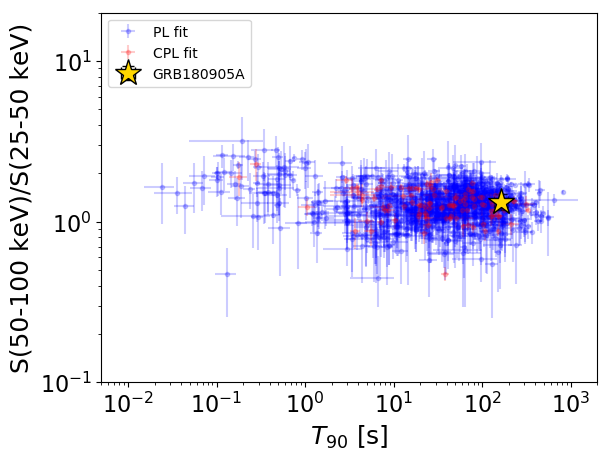
T90                                   = 165.344 sec.
Hardness ratio (energy fluence ratio) = 1.33336742578
S(15-50 keV) vs. S(50-150 keV) plot
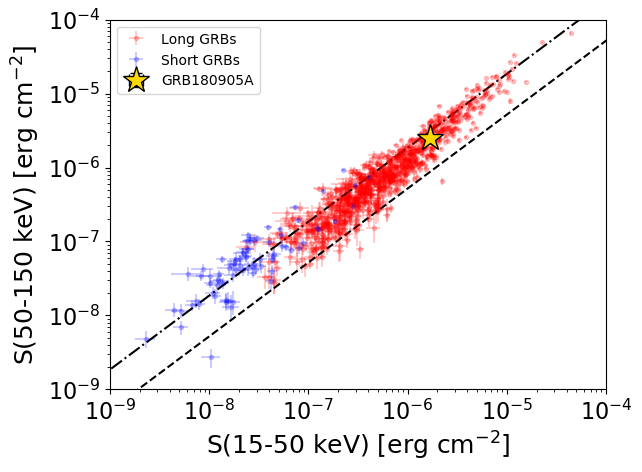
S(15-50 keV)  = 1.6919645e-06
S(50-150 keV) = 2.485289e-06
The dash-dotted line and the dashed line traces the fluences calculated from the Band function with Epeak = 15 and 150 keV, respectively. Both lines assume a canonical values of alpha = -1 and beta = -2.5.
Mask shadow pattern
IMX = -8.836050525301786E-01, IMY = -2.833996645354648E-01
Spacecraft aspect plot
Bright source in the pre-burst/pre-slew/post-slew images
Pre-burst image of 15-350 keV band
Time interval of the image:
Pre-slew background subtracted image of 15-350 keV band
Time interval of the image:
-12.499400 72.100590

# RAcent  DECcent POSerr Theta    Phi  PeakCts   SNR AngSep     Name
#  [deg]    [deg]    ['] [deg]  [deg]                   [']
135.4388 -40.5190    1.4  10.8  -15.0   0.8604   8.3    4.6	Vela X-1
170.3449 -60.5058    7.0  39.4    2.2   0.2739   1.6    7.1	Cen X-3
186.3645 -62.6616   10.0  47.3    2.5  -0.2505  -1.2   10.3	GX 301-2
158.0416 -83.9548    2.4  50.8   31.7   2.8035   4.9 ------	UNKNOWN
120.3573 -73.2889    2.5  39.1   37.9   0.9352   4.7 ------	UNKNOWN
 91.0384  -4.5922    0.8  42.9  162.2   3.5351  14.2 ------	UNKNOWN
122.6084  20.6742    3.3  54.9 -146.1   2.4297   3.5 ------	UNKNOWN
Post-slew image of 15-350 keV band
Time interval of the image:
134.500600 363.110000

# RAcent  DECcent POSerr Theta    Phi  PeakCts   SNR AngSep     Name
#  [deg]    [deg]    ['] [deg]  [deg]                   [']
 83.6114  22.0233    1.2  27.6  173.6   5.3819   9.5    1.3	Crab
135.5365 -40.3759    6.8  53.6  -33.0  -3.5772  -1.7   10.7	Vela X-1
113.5346  49.1271    2.8  57.2 -154.1  10.7941   4.1 ------	UNKNOWN