Analysis Summary
Notes:
- 1) No attempt has been made to eliminate the non-significant decimal places.
- 2) This batgrbproduct analysis is done using the HEASARC data.
- 3) This batgrbproduct analysis is using the flight position for the mask-weighting calculation.
======================================================================
BAT GRB EVENT DATA PROCESSING REPORT
Process Script Ver: batgrbproduct v2.46
Process Start Time: Fri Oct 19 18:10:56 EDT 2018
Host Name: bat1
Current Working Dir: /local/data/bat1/alien/Swift_3rdBATcatalog/event/batevent_reproc/trigger863186
======================================================================
Trigger: 00863186 Segment: 000
BAT Trigger Time: 559495364.032 [s; MET]
Trigger Stop: 559495368.128 [s; MET]
UTC: 2018-09-24T15:22:22.386320 [includes UTCF correction]
Where From?: TDRSS position message
BAT
RA: 49.1609350574153 Dec: -58.5055477959711 [deg; J2000]
Catalogged Source?: NO
Point Source?: YES
GRB Indicated?: YES [ by BAT flight software ]
Image S/N Ratio: 7.17
Image Trigger?: NO
Rate S/N Ratio: 10.4880884817015 [ if not an image trigger ]
Image S/N Ratio: 7.17
Analysis Position: [ source = BAT ]
RA: 49.1609350574153 Dec: -58.5055477959711 [deg; J2000]
Refined Position: [ source = BAT pre-slew burst ]
RA: 49.2098608828787 Dec: -58.5224493217896 [deg; J2000]
{ 03h 16m 50.4s , -58d 31' 20.8" }
+/- 1.40435315712517 [arcmin] (estimated 90% radius based on SNR)
+/- 0.536650982067299 [arcmin] (formal 1-sigma fit error)
SNR: 18.7256931069874
Angular difference between the analysis and refined position is 1.838236 arcmin
Partial Coding Fraction: 1 [ including projection effects ]
Duration
T90: 94.8159999847412 +/- 11.8424247997239
Measured from: -76.4079999923706
to: 18.4079999923706 [s; relative to TRIGTIME]
T50: 50.9559999704361 +/- 4.49904881592429
Measured from: -48.4639999866486
to: 2.49199998378754 [s; relative to TRIGTIME]
Fluence
Peak Flux (peak 1 second)
Measured from: 2.72800004482269
to: 3.72800004482269 [s; relative to TRIGTIME]
Total Fluence
Measured from: -84.6679999828339
to: 26.3480000495911 [s; relative to TRIGTIME]
Band 1 Band 2 Band 3 Band 4
15-25 25-50 50-100 100-350 keV
Total 0.999787 1.012354 0.583051 0.058976
0.061652 0.063441 0.054882 0.047138 [error]
Peak 0.028997 0.026277 0.023644 0.007910
0.006235 0.006405 0.005520 0.004630 [error]
[ fluence units of on-axis counts / fully illuminated detector ]
======================================================================
====== Table of the duration information =============================
Value tstart tstop
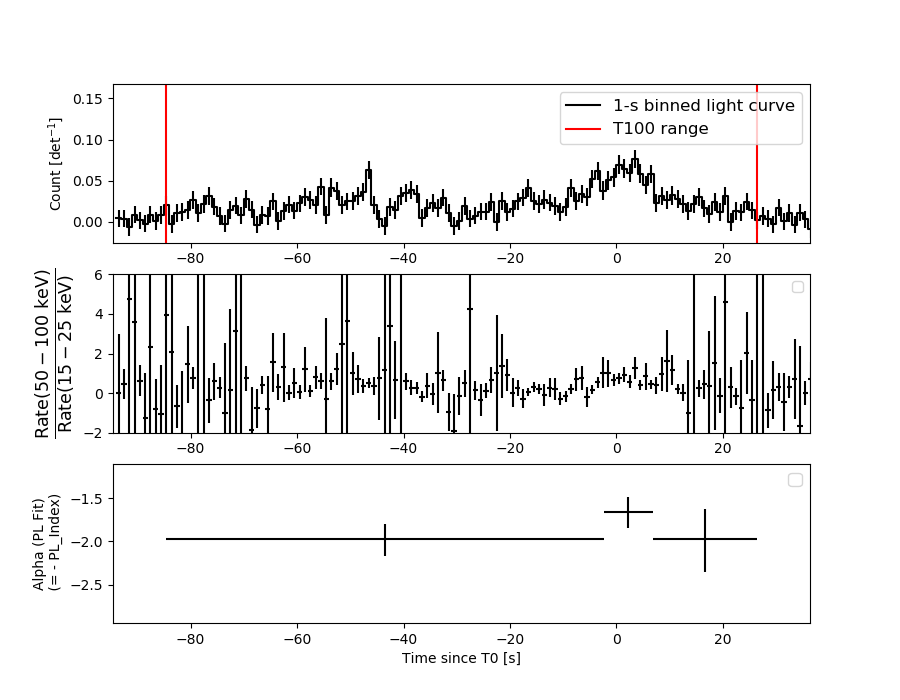
T100 111.016 -84.668 26.348
T90 94.816 -76.408 18.408
T50 50.956 -48.464 2.492
Peak 1.000 2.728 3.728
====== Spectral Analysis Summary =====================================
Model : spectral model: simple power-law (PL) and cutoff power-law (CPL)
Ph_index : photon index: E^{Ph_index}
Ph_90err : 90% error of the photon index
Epeak : Epeak in keV
Epeak_90err: 90% error of Epeak
Norm : normalization at 50 keV in both the PL model and CPL model
Nomr_90err : 90% error of the normalization
chi2 : Chi-Squared
dof : degree of freedo
=== Time-averaged spectral analysis ===
(Best model with acceptable fit: PL)
Model Ph_index Ph_90err_low Ph_90err_hi Epeak Epeak_90err_low Epeak_90err_hi Norm Nomr_90err_low Norm_90err_hi chi2 dof
PL -1.933 -0.144 0.140 - - - 1.33e-03 -1.19e-04 1.17e-04 64.300 57
CPL -1.785 -0.448 0.557 61.964 N/A N/A 1.62e-03 N/A N/A 64.050 56
=== 1-s peak spectral analysis ===
(Best model with acceptable fit: PL)
Model Ph_index Ph_90err_low Ph_90err_hi Epeak Epeak_90err_low Epeak_90err_hi Norm Nomr_90err_low Norm_90err_hi chi2 dof
PL -1.697 -0.413 0.382 - - - 4.65e-03 -1.24e-03 1.19e-03 41.550 57
CPL -1.086 -1.348 1.931 66.480 N/A N/A 1.02e-02 N/A N/A 41.010 56
=== Fluence/Peak Flux Summary ===
Model Band1 Band2 Band3 Band4 Band5 Total
15-25 25-50 50-100 100-350 15-150 15-350 keV
Fluence PL 2.84e-07 4.01e-07 4.20e-07 8.11e-07 1.36e-06 1.92e-06 erg/cm2
90%_error_low -3.03e-08 -2.86e-08 -5.21e-08 -1.87e-07 -1.17e-07 -2.43e-07 erg/cm2
90%_error_hi 3.10e-08 2.87e-08 5.28e-08 2.22e-07 1.19e-07 2.71e-07 erg/cm2
Peak flux PL 2.32e-01 2.07e-01 1.28e-01 1.20e-01 6.18e-01 6.87e-01 ph/cm2/s
90%_error_low -7.46e-02 -4.71e-02 -4.28e-02 -6.30e-02 -1.40e-01 -1.60e-01 ph/cm2/s
90%_error_hi 7.90e-02 4.70e-02 4.31e-02 9.37e-02 1.40e-01 1.63e-01 ph/cm2/s
Fluence CPL 2.80e-07 4.08e-07 4.18e-07 6.07e-07 1.34e-06 1.71e-06 erg/cm2
90%_error_low -3.37e-08 -5.79e-08 -5.53e-08 -3.68e-07 -1.41e-07 -4.05e-07 erg/cm2
90%_error_hi 3.39e-08 3.74e-08 5.42e-08 2.51e-07 1.13e-07 2.96e-07 erg/cm2
Peak flux CPL 2.17e-01 2.24e-01 1.31e-01 5.58e-02 6.07e-01 6.27e-01 ph/cm2/s
90%_error_low -8.55e-02 -5.88e-02 -4.95e-02 -5.58e-02 -1.42e-01 -1.56e-01 ph/cm2/s
90%_error_hi 8.60e-02 6.44e-02 4.85e-02 8.90e-02 1.42e-01 1.68e-01 ph/cm2/s
======================================================================
Image
Pre-slew 15.0-350.0 keV image (Event data)
#   RAcent    DECcent   POSerr    Theta     Phi              Peak Cts       SNR   Name
   49.2099   -58.5224   0.0103     8.1964   145.8958         2.8680448     18.726 TRIG_00863186

Foreground time interval of the image:
-84.668  26.348 (delta_t = 111.016 [sec])
Background time interval of the image:
-239.032 -84.668 (delta_t = 154.364 [sec])
Light Curves
Note: The mask-weighted lightcurves have units of either count/det or counts/sec/det, where a det is 0.4 x 0.4 = 0.16 sq cm.
Full-time range; 1 s binning
Other quick-look light curves:
- 64 ms binning (zoomed)
- 16 ms binning (zoomed)
- 8 ms binning (zoomed)
- 2 ms binning (zoomed)
- SN=5 or 10 s binning (full-time range)
- Raw light curve
Spectra
- 64 ms binning (zoomed)
- 16 ms binning (zoomed)
- 8 ms binning (zoomed)
- 2 ms binning (zoomed)
- SN=5 or 10 s binning (full-time range)
- Raw light curve
Spectra
Notes:
- 1) The fitting includes the systematic errors.
- 2) When the burst includes telescope slew time periods, the fitting uses an average response file made from multiple 5-s response files through out the slew time plus single time preiod for the non-slew times, and weighted by the total counts in the corresponding time period using addrmf. An average response file is needed becuase a spectral fit using the pre-slew DRM will introduce some errors in both a spectral shape and a normalization if the PHA file contains a lot of the slew/post-slew time interval.
- 3) For fits to more complicated models (e.g. a power-law over a cutoff power-law), the BAT team has decided to require a chi-square improvement of more than 6 for each extra dof.
Time averaged spectrum fit using the average DRM
Power-law model
Time interval is from  -84.668 sec. to   26.348 sec.

Spectral model in power-law:
------------------------------------------------------------
Parameters  : value       lower 90%   higher 90%
Photon index: -1.93334     ( -0.144361   0.139737 )
Norm@50keV  : 1.33307E-03    ( -0.000119449   0.000117395 )
------------------------------------------------------------
#Fit statistic : Chi-Squared =          64.30 using 59 PHA bins.
# Reduced chi-squared =          1.128 for     57 degrees of freedom
# Null hypothesis probability =   2.361537e-01

Photon flux (15-150 keV)    in 111 sec: 0.194088 ( -0.013936  0.013942 ) ph/cm2/s
Energy fluence (15-150 keV)             : 1.36136e-06 ( -1.17152e-07  1.19156e-07 ) ergs/cm2
Cutoff power-law model
Time interval is from  -84.668 sec. to   26.348 sec.
Spectral model in the cutoff power-law:
------------------------------------------------------------
Parameters  : value       lower 90%   higher 90%
Photon index: -1.78511     ( -0.448014   0.557195 )
Epeak [keV] : 61.9635      (   )
Norm@50keV  : 1.61787E-03    (     )
------------------------------------------------------------
#Fit statistic : Chi-Squared =          64.05 using 59 PHA bins.
# Reduced chi-squared =          1.144 for     56 degrees of freedom
# Null hypothesis probability =   2.148604e-01

Photon flux (15-150 keV)    in 111 sec: 0.192641 ( -0.014743  0.014703 ) ph/cm2/s
Energy fluence (15-150 keV)             : 1.33737e-06 ( -1.40899e-07  1.13445e-07 ) ergs/cm2
1-s peak spectrum fit
Power-law model
Time interval is from    2.728 sec. to    3.728 sec.

Spectral model in power-law:
------------------------------------------------------------
Parameters  : value       lower 90%   higher 90%
Photon index: -1.69736     ( -0.412698   0.381933 )
Norm@50keV  : 4.65356E-03    ( -0.00123752   0.00119157 )
------------------------------------------------------------
#Fit statistic : Chi-Squared =          41.55 using 59 PHA bins.
# Reduced chi-squared =         0.7289 for     57 degrees of freedom
# Null hypothesis probability =   9.381908e-01

Photon flux (15-150 keV)    in 1 sec: 0.617500 ( -0.139807  0.139816 ) ph/cm2/s
Energy fluence (15-150 keV)             : 4.31023e-08 ( -1.16603e-08  1.21004e-08 ) ergs/cm2
Cutoff power-law model
Time interval is from    2.728 sec. to    3.728 sec.
Spectral model in the cutoff power-law:
------------------------------------------------------------
Parameters  : value       lower 90%   higher 90%
Photon index: -1.08553     ( -1.34799   1.93051 )
Epeak [keV] : 66.4798      (   )
Norm@50keV  : 1.02365E-02    (     )
------------------------------------------------------------
#Fit statistic : Chi-Squared =          41.01 using 59 PHA bins.
# Reduced chi-squared =         0.7323 for     56 degrees of freedom
# Null hypothesis probability =   9.335717e-01

Photon flux (15-150 keV)    in 1 sec: 0.607498 ( -0.141569  0.141652 ) ph/cm2/s
Energy fluence (15-150 keV)             : 4.08131e-08 ( -1.22964e-08  1.31429e-08 ) ergs/cm2
Time-resolved spectra
Distribution
T90 vs. Hardness ratio plot
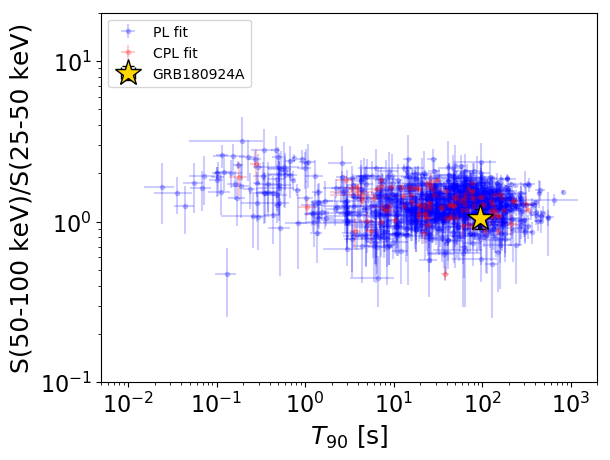
T90                                   = 94.816 sec.
Hardness ratio (energy fluence ratio) = 1.04732167787
S(15-50 keV) vs. S(50-150 keV) plot
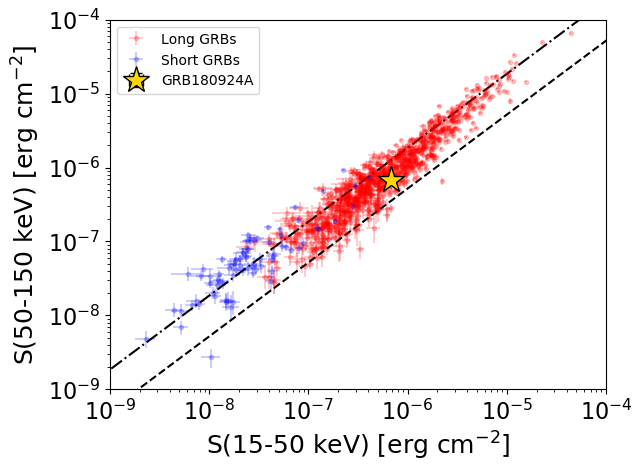
S(15-50 keV)  = 6.857465e-07
S(50-150 keV) = 6.756065e-07
The dash-dotted line and the dashed line traces the fluences calculated from the Band function with Epeak = 15 and 150 keV, respectively. Both lines assume a canonical values of alpha = -1 and beta = -2.5.
Mask shadow pattern
IMX = -1.192668647637723E-01, IMY = -8.076260146427267E-02
Spacecraft aspect plot
Bright source in the pre-burst/pre-slew/post-slew images
Pre-burst image of 15-350 keV band
Time interval of the image:
-239.032000 -84.668000

# RAcent  DECcent POSerr Theta    Phi  PeakCts   SNR AngSep     Name
#  [deg]    [deg]    ['] [deg]  [deg]                   [']
301.3202 -58.7217    2.5  43.2    4.9   1.3705   4.6 ------	UNKNOWN
261.5779 -68.7336    2.9  42.5  -24.3   1.1116   3.9 ------	UNKNOWN
Pre-slew background subtracted image of 15-350 keV band
Time interval of the image:
-84.668000 26.348000

# RAcent  DECcent POSerr Theta    Phi  PeakCts   SNR AngSep     Name
#  [deg]    [deg]    ['] [deg]  [deg]                   [']
 49.2098 -58.5224    0.6   8.2  145.9   2.8681  18.7 ------	UNKNOWN
 73.6148 -35.5053    2.1  34.7  177.7   1.1074   5.5 ------	UNKNOWN
105.6027 -32.1532    2.5  48.4 -147.1   1.9031   4.6 ------	UNKNOWN
Post-slew image of 15-350 keV band
Time interval of the image:
63.268610 635.768610

# RAcent  DECcent POSerr Theta    Phi  PeakCts   SNR AngSep     Name
#  [deg]    [deg]    ['] [deg]  [deg]                   [']
 59.6292 -24.6671    2.1  34.7  159.0   3.6551   5.4 ------	UNKNOWN
 80.8303 -27.0944    2.5  38.4 -169.0   2.6336   4.7 ------	UNKNOWN
338.0697 -80.6568    2.9  29.7  -19.8   1.8319   4.0 ------	UNKNOWN
 59.0261 -79.4971    2.5  21.2  -42.8   1.9854   4.7 ------	UNKNOWN
 99.1102 -46.1195    3.8  32.0 -128.3   1.5994   3.0 ------	UNKNOWN
 97.8221 -16.5671    2.4  55.0 -156.4   8.2549   4.9 ------	UNKNOWN
109.5973 -56.5174    3.3  31.4 -104.9   2.3120   3.6 ------	UNKNOWN
113.1635 -34.2186    2.5  48.0 -129.1   8.6647   4.6 ------	UNKNOWN