Analysis Summary
Notes:
- 1) No attempt has been made to eliminate the non-significant decimal places.
- 2) This batgrbproduct analysis is done using the HEASARC data.
- 3) This batgrbproduct analysis is using the flight position for the mask-weighting calculation.
======================================================================
BAT GRB EVENT DATA PROCESSING REPORT
Process Script Ver: batgrbproduct v2.46
Process Start Time: Mon Dec 17 18:36:51 EST 2018
Host Name: bat1
Current Working Dir: /local/data/bat1/alien/Swift_3rdBATcatalog/event/batevent_reproc/trigger866783
======================================================================
Trigger: 00866783 Segment: 000
BAT Trigger Time: 561091191.424 [s; MET]
Trigger Stop: 561091193.472 [s; MET]
UTC: 2018-10-13T02:39:29.679300 [includes UTCF correction]
Where From?: TDRSS position message
BAT
RA: 207.600644048683 Dec: 40.1787286370108 [deg; J2000]
Catalogged Source?: NO
Point Source?: YES
GRB Indicated?: YES [ by BAT flight software ]
Image S/N Ratio: 7.72
Image Trigger?: NO
Rate S/N Ratio: 7.54983443527075 [ if not an image trigger ]
Image S/N Ratio: 7.72
Analysis Position: [ source = BAT ]
RA: 207.600644048683 Dec: 40.1787286370108 [deg; J2000]
Refined Position: [ source = BAT pre-slew burst ]
RA: 207.682124786248 Dec: 40.1206449795412 [deg; J2000]
{ 13h 50m 43.7s , +40d 07' 14.3" }
+/- 3.54657188232125 [arcmin] (estimated 90% radius based on SNR)
+/- 1.94534587593167 [arcmin] (formal 1-sigma fit error)
SNR: 4.98513914513785
Angular difference between the analysis and refined position is 5.109736 arcmin
Partial Coding Fraction: 0.8125 [ including projection effects ]
Duration
T90: 104.208000063896 +/- 53.6958056690979
Measured from: 18.9759999513626
to: 123.184000015259 [s; relative to TRIGTIME]
T50: 76.7200000286102 +/- 97.833532048817
Measured from: 20.944000005722
to: 97.6640000343323 [s; relative to TRIGTIME]
Fluence
Peak Flux (peak 1 second)
Measured from: 18.8199999332428
to: 19.8199999332428 [s; relative to TRIGTIME]
Total Fluence
Measured from: 18.3680000305176
to: 123.96799993515 [s; relative to TRIGTIME]
Band 1 Band 2 Band 3 Band 4
15-25 25-50 50-100 100-350 keV
Total 0.177945 0.170448 0.169380 0.015522
0.064607 0.066933 0.058040 0.050898 [error]
Peak 0.012721 0.022291 0.021426 0.003688
0.007211 0.007398 0.006470 0.005324 [error]
[ fluence units of on-axis counts / fully illuminated detector ]
======================================================================
====== Table of the duration information =============================
Value tstart tstop
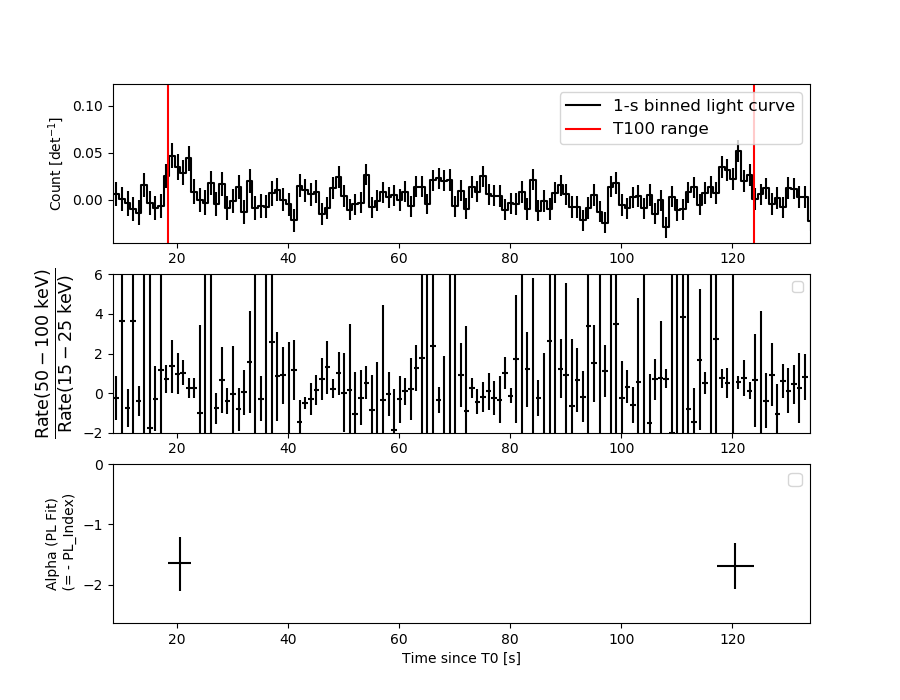
T100 105.600 18.368 123.968
T90 104.208 18.976 123.184
T50 76.720 20.944 97.664
Peak 1.000 18.820 19.820
====== Spectral Analysis Summary =====================================
Model : spectral model: simple power-law (PL) and cutoff power-law (CPL)
Ph_index : photon index: E^{Ph_index}
Ph_90err : 90% error of the photon index
Epeak : Epeak in keV
Epeak_90err: 90% error of Epeak
Norm : normalization at 50 keV in both the PL model and CPL model
Nomr_90err : 90% error of the normalization
chi2 : Chi-Squared
dof : degree of freedo
=== Time-averaged spectral analysis ===
(Best model with acceptable fit: N/A)
Model Ph_index Ph_90err_low Ph_90err_hi Epeak Epeak_90err_low Epeak_90err_hi Norm Nomr_90err_low Norm_90err_hi chi2 dof
PL -1.824 -0.873 0.678 - - - 2.85e-04 -1.44e-04 1.27e-04 59.450 57
CPL -1.753 -0.828 2.509 159.951 -159.941 -159.951 3.11e-04 -3.11e-04 4.98e-03 59.440 56
=== 1-s peak spectral analysis ===
(Best model with acceptable fit: PL)
Model Ph_index Ph_90err_low Ph_90err_hi Epeak Epeak_90err_low Epeak_90err_hi Norm Nomr_90err_low Norm_90err_hi chi2 dof
PL -1.549 -0.617 0.574 - - - 4.01e-03 -1.46e-03 1.41e-03 55.510 57
CPL -0.520 -1.735 3.896 73.144 N/A N/A 1.31e-02 N/A N/A 54.960 56
=== Fluence/Peak Flux Summary ===
Model Band1 Band2 Band3 Band4 Band5 Total
15-25 25-50 50-100 100-350 15-150 15-350 keV
Fluence PL 5.22e-08 7.87e-08 8.89e-08 1.91e-07 2.77e-07 4.11e-07 erg/cm2
90%_error_low -2.59e-08 -2.93e-08 -5.52e-08 -1.58e-07 -1.26e-07 -2.36e-07 erg/cm2
90%_error_hi 2.81e-08 2.88e-08 5.74e-08 3.66e-07 1.35e-07 4.03e-07 erg/cm2
Peak flux PL 1.73e-01 1.69e-01 1.16e-01 1.24e-01 5.08e-01 5.83e-01 ph/cm2/s
90%_error_low -8.78e-02 -6.11e-02 -5.16e-02 -8.26e-02 -1.75e-01 -2.00e-01 ph/cm2/s
90%_error_hi 1.01e-01 5.99e-02 5.05e-02 1.40e-01 1.76e-01 2.03e-01 ph/cm2/s
Fluence CPL 5.17e-08 7.95e-08 8.94e-08 1.72e-07 2.76e-07 3.90e-07 erg/cm2
90%_error_low -3.13e-08 -1.70e-08 -5.63e-08 N/A -1.25e-07 -2.35e-07 erg/cm2
90%_error_hi 2.89e-08 3.55e-08 6.34e-08 N/A 1.20e-07 2.12e-07 erg/cm2
Peak flux CPL 1.43e-01 1.86e-01 1.27e-01 4.99e-02 4.90e-01 5.05e-01 ph/cm2/s
90%_error_low -1.07e-01 -7.09e-02 N/A -4.99e-02 -1.82e-01 -1.96e-01 ph/cm2/s
90%_error_hi 1.20e-01 7.75e-02 N/A 1.10e-01 1.81e-01 2.22e-01 ph/cm2/s
======================================================================
Image
Pre-slew 15.0-350.0 keV image (Event data)
#   RAcent    DECcent   POSerr    Theta     Phi              Peak Cts       SNR   Name
  207.6821    40.1206   0.0387    25.0926  -140.2057         0.2277246      4.985 TRIG_00866783

Foreground time interval of the image:
 18.368  29.277 (delta_t =  10.909 [sec])
Background time interval of the image:
-104.923  18.368 (delta_t = 123.291 [sec])
Light Curves
Note: The mask-weighted lightcurves have units of either count/det or counts/sec/det, where a det is 0.4 x 0.4 = 0.16 sq cm.
Full-time range; 1 s binning
Other quick-look light curves:
- 64 ms binning (zoomed)
- 16 ms binning (zoomed)
- 8 ms binning (zoomed)
- 2 ms binning (zoomed)
- SN=5 or 10 s binning (full-time range)
- Raw light curve
Spectra
- 64 ms binning (zoomed)
- 16 ms binning (zoomed)
- 8 ms binning (zoomed)
- 2 ms binning (zoomed)
- SN=5 or 10 s binning (full-time range)
- Raw light curve
Spectra
Notes:
- 1) The fitting includes the systematic errors.
- 2) When the burst includes telescope slew time periods, the fitting uses an average response file made from multiple 5-s response files through out the slew time plus single time preiod for the non-slew times, and weighted by the total counts in the corresponding time period using addrmf. An average response file is needed becuase a spectral fit using the pre-slew DRM will introduce some errors in both a spectral shape and a normalization if the PHA file contains a lot of the slew/post-slew time interval.
- 3) For fits to more complicated models (e.g. a power-law over a cutoff power-law), the BAT team has decided to require a chi-square improvement of more than 6 for each extra dof.
Time averaged spectrum fit using the average DRM
Power-law model
Time interval is from   18.368 sec. to  123.968 sec.

Spectral model in power-law:
------------------------------------------------------------
Parameters  : value       lower 90%   higher 90%
Photon index: -1.82437     ( -0.872766   0.677781 )
Norm@50keV  : 2.85182E-04    ( -0.000143613   0.000126558 )
------------------------------------------------------------
#Fit statistic : Chi-Squared =          59.45 using 59 PHA bins.
# Reduced chi-squared =          1.043 for     57 degrees of freedom
# Null hypothesis probability =   3.865078e-01

Photon flux (15-150 keV)    in 105.6 sec: 3.96770E-02 ( -0.0144509  0.0144511 ) ph/cm2/s
Energy fluence (15-150 keV)             : 2.77086e-07 ( -1.25916e-07  1.34835e-07 ) ergs/cm2
Cutoff power-law model
Time interval is from   18.368 sec. to  123.968 sec.
Spectral model in the cutoff power-law:
------------------------------------------------------------
Parameters  : value       lower 90%   higher 90%
Photon index: -1.75313     ( -0.825887   2.51093 )
Epeak [keV] : 159.951      ( -162.004 -162.014 )
Norm@50keV  : 3.11418E-04    ( -0.000311617   0.00498033 )
------------------------------------------------------------
#Fit statistic : Chi-Squared =          59.44 using 59 PHA bins.
# Reduced chi-squared =          1.062 for     56 degrees of freedom
# Null hypothesis probability =   3.513182e-01

Photon flux (15-150 keV)    in 105.6 sec: 3.96050E-02 ( -0.0145623  0.0144759 ) ph/cm2/s
Energy fluence (15-150 keV)             : 2.76029e-07 ( -1.25187e-07  1.19724e-07 ) ergs/cm2
1-s peak spectrum fit
Power-law model
Time interval is from   18.820 sec. to   19.820 sec.

Spectral model in power-law:
------------------------------------------------------------
Parameters  : value       lower 90%   higher 90%
Photon index: -1.54945     ( -0.616719   0.574079 )
Norm@50keV  : 4.01493E-03    ( -0.00145883   0.00141482 )
------------------------------------------------------------
#Fit statistic : Chi-Squared =          55.51 using 59 PHA bins.
# Reduced chi-squared =         0.9739 for     57 degrees of freedom
# Null hypothesis probability =   5.311647e-01

Photon flux (15-150 keV)    in 1 sec: 0.508201 ( -0.175194  0.175776 ) ph/cm2/s
Energy fluence (15-150 keV)             : 3.78051e-08 ( -1.43061e-08  1.47434e-08 ) ergs/cm2
Cutoff power-law model
Time interval is from   18.820 sec. to   19.820 sec.
Spectral model in the cutoff power-law:
------------------------------------------------------------
Parameters  : value       lower 90%   higher 90%
Photon index: -0.52014     ( -1.73553   3.89531 )
Epeak [keV] : 73.1436      (   )
Norm@50keV  : 1.31022E-02    (     )
------------------------------------------------------------
#Fit statistic : Chi-Squared =          54.96 using 59 PHA bins.
# Reduced chi-squared =         0.9815 for     56 degrees of freedom
# Null hypothesis probability =   5.140702e-01

Photon flux (15-150 keV)    in 1 sec: 0.489982 ( -0.182451  0.181208 ) ph/cm2/s
Energy fluence (15-150 keV)             : 3.58881e-08 ( -1.42654e-08  1.53744e-08 ) ergs/cm2
Time-resolved spectra
Distribution
T90 vs. Hardness ratio plot
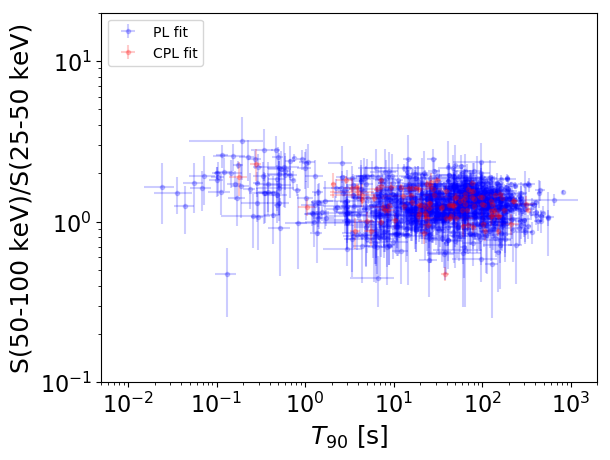
T90                                   = N/A sec.
Hardness ratio (energy fluence ratio) = N/A
S(15-50 keV) vs. S(50-150 keV) plot
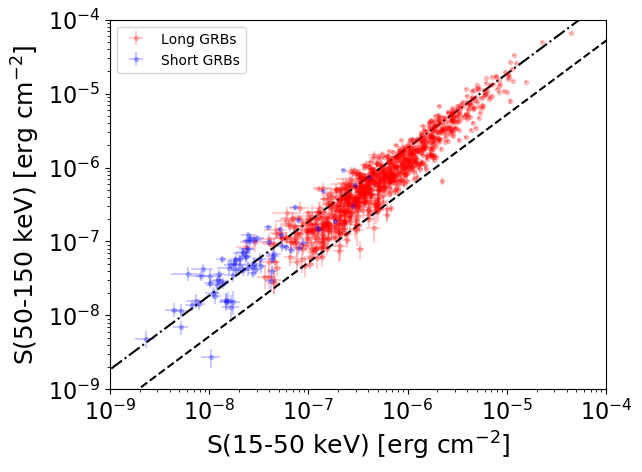
S(15-50 keV)  = N/A
S(50-150 keV) = N/A
The dash-dotted line and the dashed line traces the fluences calculated from the Band function with Epeak = 15 and 150 keV, respectively. Both lines assume a canonical values of alpha = -1 and beta = -2.5.
Mask shadow pattern
IMX = -3.597987358265692E-01, IMY = 2.997119559476695E-01
Spacecraft aspect plot
Bright source in the pre-burst/pre-slew/post-slew images
Pre-burst image of 15-350 keV band
Time interval of the image:
-104.923400 18.368000

# RAcent  DECcent POSerr Theta    Phi  PeakCts   SNR AngSep     Name
#  [deg]    [deg]    ['] [deg]  [deg]                   [']
130.0273  34.4224    2.3  35.0   37.5   1.1961   4.9 ------	UNKNOWN
143.1913   3.7217    2.6  49.5   -7.9   1.2801   4.5 ------	UNKNOWN
192.4702   7.1590    2.8  41.4  -78.5   2.7647   4.2 ------	UNKNOWN
Pre-slew background subtracted image of 15-350 keV band
Time interval of the image:
18.368000 29.276600

# RAcent  DECcent POSerr Theta    Phi  PeakCts   SNR AngSep     Name
#  [deg]    [deg]    ['] [deg]  [deg]                   [']
196.6511  61.0360    2.3  20.6  162.0   0.2004   5.1 ------	UNKNOWN
Post-slew image of 15-350 keV band
Time interval of the image:
86.476600 962.665800

# RAcent  DECcent POSerr Theta    Phi  PeakCts   SNR AngSep     Name
#  [deg]    [deg]    ['] [deg]  [deg]                   [']
254.5821  35.3918   15.9  37.0  159.8  -0.7839  -0.7    6.8	Her X-1
168.0495  39.0931    3.0  30.2   -1.3   2.7548   3.9 ------	UNKNOWN
261.4083   8.5018    2.7  57.2 -173.9  13.5847   4.3 ------	UNKNOWN
258.7668   5.0889    2.9  57.7 -168.8  13.1541   3.9 ------	UNKNOWN
143.0828  17.7512    2.6  59.3  -14.3  13.9218   4.5 ------	UNKNOWN