Analysis Summary
Notes:
- 1) No attempt has been made to eliminate the non-significant decimal places.
- 2) This batgrbproduct analysis is done using the HEASARC data.
- 3) This batgrbproduct analysis is using the flight position for the mask-weighting calculation.
======================================================================
BAT GRB EVENT DATA PROCESSING REPORT
Process Script Ver: batgrbproduct v2.46
Process Start Time: Mon Dec 17 18:17:27 EST 2018
Host Name: bat1
Current Working Dir: /local/data/bat1/alien/Swift_3rdBATcatalog/event/batevent_reproc/trigger867252
======================================================================
Trigger: 00867252 Segment: 000
BAT Trigger Time: 561344122.688 [s; MET]
Trigger Stop: 561344139.072 [s; MET]
UTC: 2018-10-16T00:55:00.927600 [includes UTCF correction]
Where From?: TDRSS position message
BAT
RA: 231.267907712346 Dec: -35.2789249317542 [deg; J2000]
Catalogged Source?: NO
Point Source?: YES
GRB Indicated?: YES [ by BAT flight software ]
Image S/N Ratio: 8.57
Image Trigger?: NO
Rate S/N Ratio: 7.28010988928052 [ if not an image trigger ]
Image S/N Ratio: 8.57
Analysis Position: [ source = BAT ]
RA: 231.267907712346 Dec: -35.2789249317542 [deg; J2000]
Refined Position: [ source = BAT pre-slew burst ]
RA: 231.27291051103 Dec: -35.3072621162096 [deg; J2000]
{ 15h 25m 05.5s , -35d 18' 26.1" }
+/- 1.83417697426658 [arcmin] (estimated 90% radius based on SNR)
+/- 0.904005559085248 [arcmin] (formal 1-sigma fit error)
SNR: 12.7871498762869
Angular difference between the analysis and refined position is 1.717792 arcmin
Partial Coding Fraction: 0.4960938 [ including projection effects ]
Duration
T90: 111.34399998188 +/- 25.6272959371319
Measured from: -12.9520000219345
to: 98.3919999599457 [s; relative to TRIGTIME]
T50: 51.3199999332428 +/- 12.6112204074095
Measured from: 0.75600004196167
to: 52.0759999752045 [s; relative to TRIGTIME]
Fluence
Peak Flux (peak 1 second)
Measured from: 8.64400005340576
to: 9.64400005340576 [s; relative to TRIGTIME]
Total Fluence
Measured from: -18.0039999485016
to: 110.180000066757 [s; relative to TRIGTIME]
Band 1 Band 2 Band 3 Band 4
15-25 25-50 50-100 100-350 keV
Total 0.748401 1.093348 0.794916 0.335031
0.115289 0.115214 0.097534 0.083055 [error]
Peak 0.033960 0.023816 0.019176 0.016603
0.010458 0.010175 0.008923 0.007653 [error]
[ fluence units of on-axis counts / fully illuminated detector ]
======================================================================
====== Table of the duration information =============================
Value tstart tstop
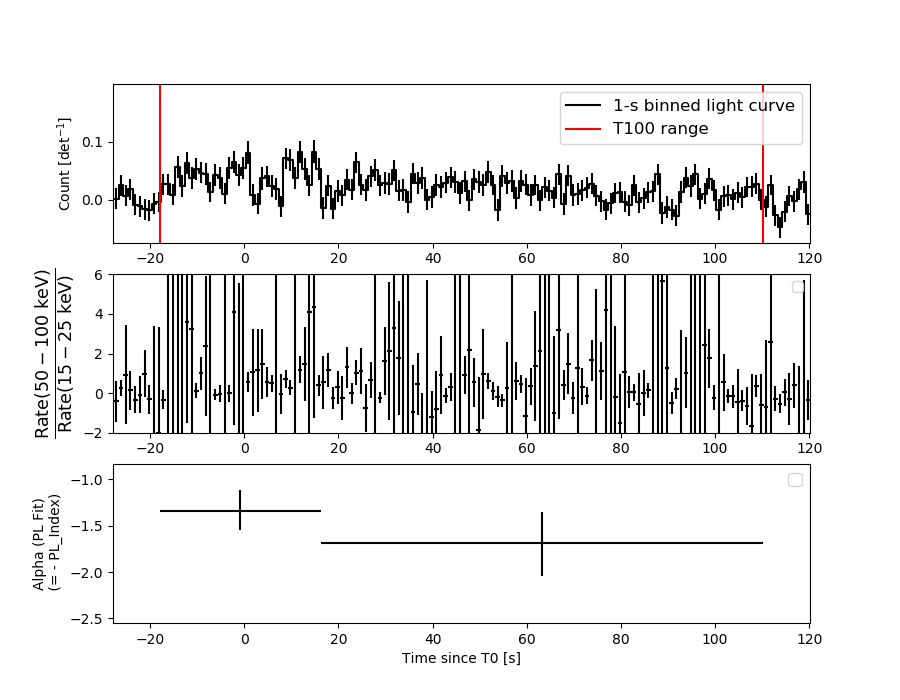
T100 128.184 -18.004 110.180
T90 111.344 -12.952 98.392
T50 51.320 0.756 52.076
Peak 1.000 8.644 9.644
====== Spectral Analysis Summary =====================================
Model : spectral model: simple power-law (PL) and cutoff power-law (CPL)
Ph_index : photon index: E^{Ph_index}
Ph_90err : 90% error of the photon index
Epeak : Epeak in keV
Epeak_90err: 90% error of Epeak
Norm : normalization at 50 keV in both the PL model and CPL model
Nomr_90err : 90% error of the normalization
chi2 : Chi-Squared
dof : degree of freedo
=== Time-averaged spectral analysis ===
(Best model with acceptable fit: PL)
Model Ph_index Ph_90err_low Ph_90err_hi Epeak Epeak_90err_low Epeak_90err_hi Norm Nomr_90err_low Norm_90err_hi chi2 dof
PL -1.512 -0.204 0.204 - - - 1.55e-03 -1.80e-04 1.79e-04 68.940 57
CPL -1.503 -0.211 0.641 9998.720 -9998.720 -9998.720 1.56e-03 -9.38e-04 1.70e-03 68.950 56
=== 1-s peak spectral analysis ===
(Best model with acceptable fit: PL)
Model Ph_index Ph_90err_low Ph_90err_hi Epeak Epeak_90err_low Epeak_90err_hi Norm Nomr_90err_low Norm_90err_hi chi2 dof
PL -1.415 -0.588 0.612 - - - 6.08e-03 -1.98e-03 1.97e-03 46.330 57
CPL -1.118 1.118 3.425 151.473 -151.473 -151.473 8.56e-03 -8.56e-03 3.49e-01 46.370 56
=== Fluence/Peak Flux Summary ===
Model Band1 Band2 Band3 Band4 Band5 Total
15-25 25-50 50-100 100-350 15-150 15-350 keV
Fluence PL 2.56e-07 4.68e-07 6.57e-07 1.93e-06 1.88e-06 3.31e-06 erg/cm2
90%_error_low -5.05e-08 -5.73e-08 -9.83e-08 -5.57e-07 -2.36e-07 -6.42e-07 erg/cm2
90%_error_hi 5.29e-08 5.66e-08 9.74e-08 6.99e-07 2.38e-07 7.54e-07 erg/cm2
Peak flux PL 2.31e-01 2.44e-01 1.83e-01 2.23e-01 7.43e-01 8.81e-01 ph/cm2/s
90%_error_low -1.27e-01 -9.40e-02 -7.20e-02 -1.39e-01 -2.53e-01 -2.87e-01 ph/cm2/s
90%_error_hi 1.51e-01 8.94e-02 6.95e-02 2.37e-01 2.55e-01 2.89e-01 ph/cm2/s
Fluence CPL 2.58e-07 4.66e-07 6.53e-07 2.00e-06 1.89e-06 3.22e-06 erg/cm2
90%_error_low -5.56e-08 -2.95e-08 -1.11e-07 -1.29e-06 -2.91e-07 -1.14e-06 erg/cm2
90%_error_hi 5.32e-08 6.38e-08 1.20e-07 3.77e-08 1.96e-07 8.02e-07 erg/cm2
Peak flux CPL 2.29e-01 2.45e-01 1.84e-01 2.23e-01 7.42e-01 8.71e-01 ph/cm2/s
90%_error_low -1.56e-01 -5.03e-02 -1.84e-01 -2.23e-01 -2.63e-01 -3.78e-01 ph/cm2/s
90%_error_hi 1.48e-01 1.11e-01 8.48e-02 1.17e-01 2.56e-01 2.94e-01 ph/cm2/s
======================================================================
Image
Pre-slew 15.0-350.0 keV image (Event data)
#   RAcent    DECcent   POSerr    Theta     Phi              Peak Cts       SNR   Name
  231.2729   -35.3073   0.0151    34.6390   -44.0728         3.3405887     12.787 TRIG_00867252

Foreground time interval of the image:
-18.004 110.180 (delta_t = 128.184 [sec])
Background time interval of the image:
-236.387 -18.004 (delta_t = 218.383 [sec])
Light Curves
Note: The mask-weighted lightcurves have units of either count/det or counts/sec/det, where a det is 0.4 x 0.4 = 0.16 sq cm.
Full-time range; 1 s binning
Other quick-look light curves:
- 64 ms binning (zoomed)
- 16 ms binning (zoomed)
- 8 ms binning (zoomed)
- 2 ms binning (zoomed)
- SN=5 or 10 s binning (full-time range)
- Raw light curve
Spectra
- 64 ms binning (zoomed)
- 16 ms binning (zoomed)
- 8 ms binning (zoomed)
- 2 ms binning (zoomed)
- SN=5 or 10 s binning (full-time range)
- Raw light curve
Spectra
Notes:
- 1) The fitting includes the systematic errors.
- 2) When the burst includes telescope slew time periods, the fitting uses an average response file made from multiple 5-s response files through out the slew time plus single time preiod for the non-slew times, and weighted by the total counts in the corresponding time period using addrmf. An average response file is needed becuase a spectral fit using the pre-slew DRM will introduce some errors in both a spectral shape and a normalization if the PHA file contains a lot of the slew/post-slew time interval.
- 3) For fits to more complicated models (e.g. a power-law over a cutoff power-law), the BAT team has decided to require a chi-square improvement of more than 6 for each extra dof.
Time averaged spectrum fit using the average DRM
Power-law model

Time interval is from  -18.004 sec. to  110.180 sec.

Spectral model in power-law:
------------------------------------------------------------
Parameters  : value       lower 90%   higher 90%
Photon index: -1.51152     ( -0.203535   0.203767 )
Norm@50keV  : 1.54982E-03    ( -0.000179959   0.000179094 )
------------------------------------------------------------
#Fit statistic : Chi-Squared =          68.94 using 59 PHA bins.
# Reduced chi-squared =          1.210 for     57 degrees of freedom
# Null hypothesis probability =   1.334336e-01

Photon flux (15-150 keV)    in 128.2 sec: 0.194088 ( -0.022899  0.02297 ) ph/cm2/s
Energy fluence (15-150 keV)             : 1.8816e-06 ( -2.36142e-07  2.38065e-07 ) ergs/cm2
Cutoff power-law model
Time interval is from  -18.004 sec. to  110.180 sec.
Spectral model in the cutoff power-law:
------------------------------------------------------------
Parameters  : value       lower 90%   higher 90%
Photon index: -1.50297     ( -0.207344   0.644235 )
Epeak [keV] : 9998.72      ( -9999.36 -9999.36 )
Norm@50keV  : 1.55547E-03    ( -0.000936568   0.00170007 )
------------------------------------------------------------
#Fit statistic : Chi-Squared =          68.95 using 59 PHA bins.
# Reduced chi-squared =          1.231 for     56 degrees of freedom
# Null hypothesis probability =   1.146365e-01

Photon flux (15-150 keV)    in 128.2 sec: 0.194488 ( -0.024135  0.023346 ) ph/cm2/s
Energy fluence (15-150 keV)             : 1.89339e-06 ( -2.90701e-07  1.95997e-07 ) ergs/cm2
1-s peak spectrum fit
Power-law model

Time interval is from    8.644 sec. to    9.644 sec.

Spectral model in power-law:
------------------------------------------------------------
Parameters  : value       lower 90%   higher 90%
Photon index: -1.41479     ( -0.588082   0.612118 )
Norm@50keV  : 6.08172E-03    ( -0.00198009   0.00197489 )
------------------------------------------------------------
#Fit statistic : Chi-Squared =          46.33 using 59 PHA bins.
# Reduced chi-squared =         0.8129 for     57 degrees of freedom
# Null hypothesis probability =   8.427186e-01

Photon flux (15-150 keV)    in 1 sec: 0.743179 ( -0.252895  0.255304 ) ph/cm2/s
Energy fluence (15-150 keV)             : 5.85976e-08 ( -2.03468e-08  2.06854e-08 ) ergs/cm2
Cutoff power-law model
Time interval is from    8.644 sec. to    9.644 sec.
Spectral model in the cutoff power-law:
------------------------------------------------------------
Parameters  : value       lower 90%   higher 90%
Photon index: -2.21331     ( 1.13944   3.44622 )
Epeak [keV] : 77.5624      ( -901.007 -901.007 )
Norm@50keV  : 2.05464E-03    ( -0.00205257   0.355536 )
------------------------------------------------------------
#Fit statistic : Chi-Squared =          46.29 using 59 PHA bins.
# Reduced chi-squared =         0.8265 for     56 degrees of freedom
# Null hypothesis probability =   8.193826e-01

Photon flux (15-150 keV)    in 1 sec: 0.742157 ( -0.262763  0.256159 ) ph/cm2/s
Energy fluence (15-150 keV)             : 5.84696e-08 ( -2.26063e-08  2.06912e-08 ) ergs/cm2
Time-resolved spectra
Distribution
T90 vs. Hardness ratio plot
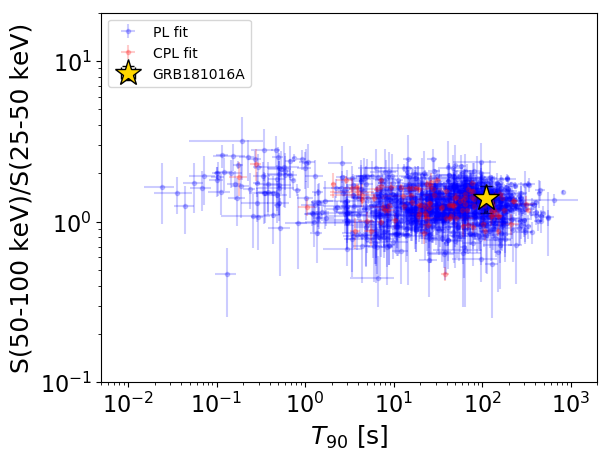
T90                                   = 111.344 sec.
Hardness ratio (energy fluence ratio) = 1.40297511371
S(15-50 keV) vs. S(50-150 keV) plot
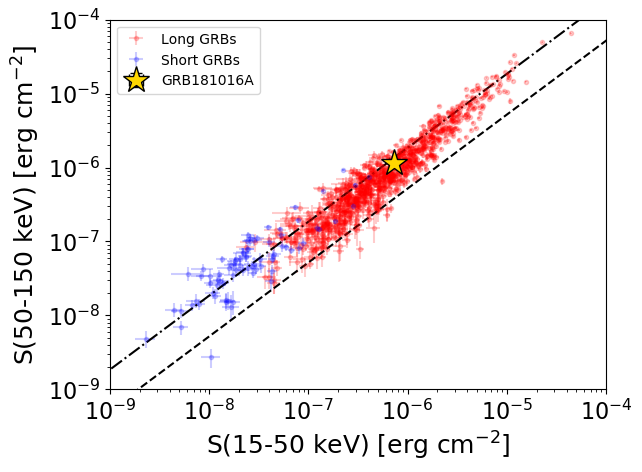
S(15-50 keV)  = 7.244076e-07
S(50-150 keV) = 1.1571744e-06
The dash-dotted line and the dashed line traces the fluences calculated from the Band function with Epeak = 15 and 150 keV, respectively. Both lines assume a canonical values of alpha = -1 and beta = -2.5.
Mask shadow pattern
IMX = 4.963529887259436E-01, IMY = 4.805424786268802E-01
Spacecraft aspect plot
Bright source in the pre-burst/pre-slew/post-slew images
Pre-burst image of 15-350 keV band
Time interval of the image:
-236.387410 -18.004000

# RAcent  DECcent POSerr Theta    Phi  PeakCts   SNR AngSep     Name
#  [deg]    [deg]    ['] [deg]  [deg]                   [']
135.6872 -40.6556    9.2  41.0  171.0  -0.5276  -1.2    9.4	Vela X-1
170.3325 -60.6282    1.7  12.1  162.2   1.4680   6.8    0.6	Cen X-3
186.6434 -62.6852    2.7   4.2  150.2   0.8968   4.3    5.1	GX 301-2
255.8393 -37.8353    4.2  43.5  -15.6   0.9975   2.8    7.0	4U 1700-377
256.2668 -36.3948   37.5  44.9  -16.5  -0.1224  -0.3    8.3	GX 349+2
262.9334 -24.7214   49.4  57.8  -18.6  -0.2185  -0.2    4.4	GX 1+4
264.7801 -44.4338  858.4  42.7   -1.9   0.0054   0.0    1.9	4U 1735-44
262.8813 -33.9015  235.4  50.1  -12.5  -0.0226  -0.0    6.7	GX 354-0
182.3390 -79.0601    4.2  17.9   86.6   0.6513   2.7 ------	UNKNOWN
239.5402 -46.6896    2.0  29.1  -21.7   1.3185   5.9 ------	UNKNOWN
Pre-slew background subtracted image of 15-350 keV band
Time interval of the image:
-18.004000 110.180000

# RAcent  DECcent POSerr Theta    Phi  PeakCts   SNR AngSep     Name
#  [deg]    [deg]    ['] [deg]  [deg]                   [']
135.7391 -40.6176   31.7  41.0  171.1  -0.1142  -0.4   10.3	Vela X-1
170.1335 -60.7401   27.3  12.1  161.6  -0.0704  -0.4    8.8	Cen X-3
186.6984 -62.7802    2.8   4.2  148.9  -0.6465  -4.1    1.3	GX 301-2
255.9221 -38.0087    0.0  43.4  -15.4   0.7920   2.8   10.3	4U 1700-377
256.2221 -36.3985   30.6  44.9  -16.5  -0.1167  -0.4   10.4	GX 349+2
263.0858 -24.6961   25.0  57.9  -18.5   0.4239   0.5    5.1	GX 1+4
264.6368 -44.5678    7.1  42.5   -1.9   0.4993   1.6    8.4	4U 1735-44
262.9773 -33.7928    7.6  50.2  -12.5   0.5318   1.5    2.6	GX 354-0
274.5809 -74.6353    2.3  29.3   46.5   1.2824   5.1 ------	UNKNOWN
282.5798 -46.5860    2.5  49.1   13.3   1.8936   4.6 ------	UNKNOWN
256.1356 -58.3975    2.2  29.4   10.1   1.1474   5.3 ------	UNKNOWN
231.2729 -35.3072    0.9  34.6  -44.1   3.3405  12.8 ------	UNKNOWN
Post-slew image of 15-350 keV band
Time interval of the image:
828.812590 962.481300

# RAcent  DECcent POSerr Theta    Phi  PeakCts   SNR AngSep     Name
#  [deg]    [deg]    ['] [deg]  [deg]                   [']
170.3238 -60.7358    6.5  47.3 -158.7   0.7149   1.8    6.8	Cen X-3
186.6711 -62.7903    2.2  39.4 -160.5   1.6285   5.3    1.3	GX 301-2
244.9818 -15.6357    0.5  26.9  -21.3   4.5254  21.8    0.3	Sco X-1
256.0072 -37.8557    2.1   8.9   42.5   1.0030   5.4    1.2	4U 1700-377
256.4065 -36.4513    2.5  10.0   37.0   0.8731   4.5    2.2	GX 349+2
262.8576 -24.7137    7.8  22.5   24.2  -0.2794  -1.5    8.5	GX 1+4
264.9704 -44.3321    3.7  13.8   85.1   0.5729   3.1   12.0	4U 1735-44
268.4437  -1.3187    3.8  45.8   13.1  -1.2301  -3.0    9.2	SW J1753.5-0127
270.3283 -24.9911    3.4  26.5   37.5   0.8039   3.4    5.8	GX 5-1
270.1508 -25.6224   11.2  25.9   38.2   0.2311   1.0   10.9	GRS 1758-258
274.1363 -13.9846    4.0  37.4   29.8   0.9007   2.9    8.2	GX 17+2
276.0241 -30.5127    5.5  26.7   54.2   0.5093   2.1   10.1	H1820-303
284.9009 -25.0467    0.0  36.2   54.9   1.1378   2.8   10.6	HT1900.1-2455
262.8189 -33.7816    4.3  15.7   42.8   0.5188   2.7    9.1	GX 354-0
289.1114 -11.1721    3.1  48.7   44.1   3.0793   3.8 ------	UNKNOWN
185.3650 -37.0664    2.1  46.0 -123.4   4.7804   5.4 ------	UNKNOWN