Analysis Summary
Notes:
- 1) No attempt has been made to eliminate the non-significant decimal places.
- 2) This batgrbproduct analysis is done using the HEASARC data.
- 3) This batgrbproduct analysis is using the flight position for the mask-weighting calculation.
======================================================================
BAT GRB EVENT DATA PROCESSING REPORT
Process Script Ver: batgrbproduct v2.46
Process Start Time: Mon Dec 17 17:56:18 EST 2018
Host Name: bat1
Current Working Dir: /local/data/bat1/alien/Swift_3rdBATcatalog/event/batevent_reproc/trigger867987
======================================================================
Trigger: 00867987 Segment: 000
BAT Trigger Time: 561754855.296 [s; MET]
Trigger Stop: 561754855.424 [s; MET]
UTC: 2018-10-20T19:00:33.510100 [includes UTCF correction]
Where From?: TDRSS position message
BAT
RA: 13.9670984422145 Dec: -47.3799961910664 [deg; J2000]
Catalogged Source?: NO
Point Source?: YES
GRB Indicated?: YES [ by BAT flight software ]
Image S/N Ratio: 8.26
Image Trigger?: NO
Rate S/N Ratio: 28.9309522829789 [ if not an image trigger ]
Image S/N Ratio: 8.26
Analysis Position: [ source = BAT ]
RA: 13.9670984422145 Dec: -47.3799961910664 [deg; J2000]
Refined Position: [ source = BAT pre-slew burst ]
RA: 13.9856438394844 Dec: -47.3719623592739 [deg; J2000]
{ 00h 55m 56.6s , -47d 22' 19.1" }
+/- 0.564057571401366 [arcmin] (estimated 90% radius based on SNR)
+/- 0.137267062245579 [arcmin] (formal 1-sigma fit error)
SNR: 68.9240229394993
Angular difference between the analysis and refined position is 0.894508 arcmin
Partial Coding Fraction: 0.9453125 [ including projection effects ]
Duration
T90: 238.015999913216 +/- 11.5988104904574
Measured from: 0.796000003814697
to: 238.81199991703 [s; relative to TRIGTIME]
T50: 16.0719999074936 +/- 4.86733609384869
Measured from: 4.51999998092651
to: 20.5919998884201 [s; relative to TRIGTIME]
Fluence
Peak Flux (peak 1 second)
Measured from: 7.26399993896484
to: 8.26399993896484 [s; relative to TRIGTIME]
Total Fluence
Measured from: -1.44799995422363
to: 271.203999996185 [s; relative to TRIGTIME]
Band 1 Band 2 Band 3 Band 4
15-25 25-50 50-100 100-350 keV
Total 3.022382 4.375695 3.958866 1.073056
0.110750 0.117662 0.108420 0.104210 [error]
Peak 0.174326 0.335363 0.390363 0.129826
0.010213 0.012815 0.013912 0.011623 [error]
[ fluence units of on-axis counts / fully illuminated detector ]
======================================================================
====== Table of the duration information =============================
Value tstart tstop
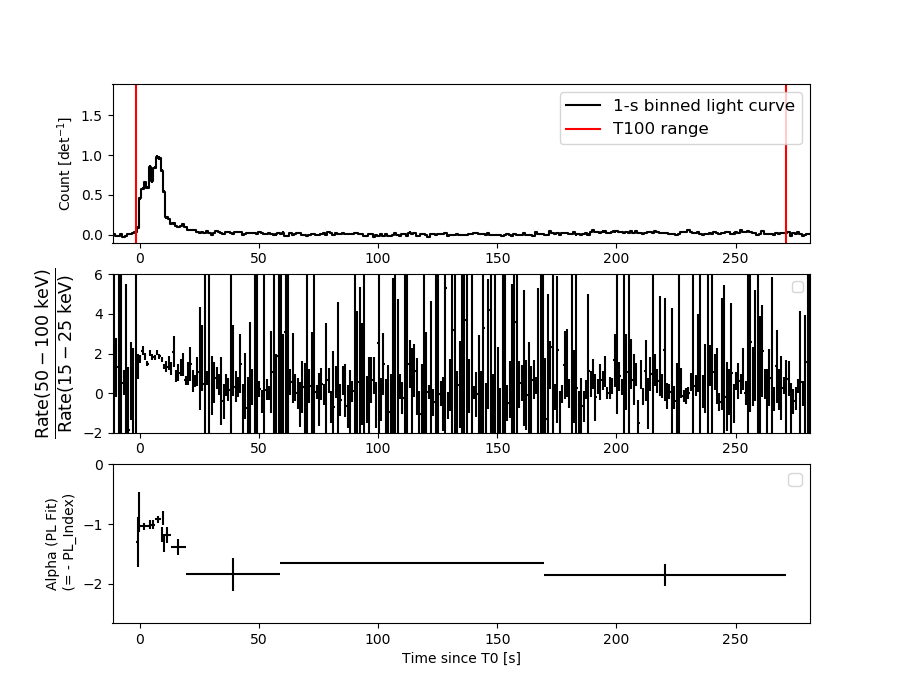
T100 272.652 -1.448 271.204
T90 238.016 0.796 238.812
T50 16.072 4.520 20.592
Peak 1.000 7.264 8.264
====== Spectral Analysis Summary =====================================
Model : spectral model: simple power-law (PL) and cutoff power-law (CPL)
Ph_index : photon index: E^{Ph_index}
Ph_90err : 90% error of the photon index
Epeak : Epeak in keV
Epeak_90err: 90% error of Epeak
Norm : normalization at 50 keV in both the PL model and CPL model
Nomr_90err : 90% error of the normalization
chi2 : Chi-Squared
dof : degree of freedo
=== Time-averaged spectral analysis ===
(Best model with acceptable fit: PL)
Model Ph_index Ph_90err_low Ph_90err_hi Epeak Epeak_90err_low Epeak_90err_hi Norm Nomr_90err_low Norm_90err_hi chi2 dof
PL -1.254 -0.060 0.060 - - - 2.96e-03 -9.07e-05 9.07e-05 52.470 57
CPL -1.159 -0.121 0.238 495.380 -495.380 -495.380 3.27e-03 -4.92e-04 8.88e-04 51.970 56
=== 1-s peak spectral analysis ===
(Best model with acceptable fit: PL)
Model Ph_index Ph_90err_low Ph_90err_hi Epeak Epeak_90err_low Epeak_90err_hi Norm Nomr_90err_low Norm_90err_hi chi2 dof
PL -0.863 -0.074 0.075 - - - 6.67e-02 -2.72e-03 2.71e-03 67.150 57
CPL -0.687 -0.224 0.305 437.420 -437.420 -437.420 7.96e-02 -1.50e-02 2.73e-02 66.060 56
=== Fluence/Peak Flux Summary ===
Model Band1 Band2 Band3 Band4 Band5 Total
15-25 25-50 50-100 100-350 15-150 15-350 keV
Fluence PL 8.19e-07 1.75e-06 2.94e-06 1.13e-05 8.08e-06 1.68e-05 erg/cm2
90%_error_low -5.23e-08 -6.43e-08 -1.10e-07 -9.68e-07 -2.73e-07 -1.03e-06 erg/cm2
90%_error_hi 5.36e-08 6.40e-08 1.09e-07 1.03e-06 2.74e-07 1.08e-06 erg/cm2
Peak flux PL 1.50e+00 2.21e+00 2.42e+00 5.01e+00 7.66e+00 1.11e+01 ph/cm2/s
90%_error_low -1.28e-01 -1.13e-01 -1.09e-01 -4.89e-01 -3.11e-01 -5.47e-01 ph/cm2/s
90%_error_hi 1.32e-01 1.13e-01 1.08e-01 5.24e-01 3.11e-01 5.62e-01 ph/cm2/s
Fluence CPL 8.00e-07 1.76e-06 2.96e-06 9.83e-06 8.02e-06 1.53e-05 erg/cm2
90%_error_low -6.83e-08 -6.45e-08 -1.22e-07 -2.68e-06 -3.07e-07 -2.68e-06 erg/cm2
90%_error_hi 5.48e-08 6.84e-08 1.23e-07 1.23e-06 3.04e-07 1.71e-06 erg/cm2
Peak flux CPL 1.43e+00 2.22e+00 2.48e+00 4.16e+00 7.60e+00 1.03e+01 ph/cm2/s
90%_error_low -1.69e-01 -1.18e-01 -1.35e-01 -1.06e+00 -3.25e-01 -1.11e+00 ph/cm2/s
90%_error_hi 2.39e-01 1.18e-01 1.36e-01 1.05e+00 3.25e-01 1.06e+00 ph/cm2/s
======================================================================
Image
Pre-slew 15.0-350.0 keV image (Event data)
#   RAcent    DECcent   POSerr    Theta     Phi              Peak Cts       SNR   Name
   13.9856   -47.3720   0.0028    12.1465    64.7027         8.2385229     68.924 TRIG_00867987

Foreground time interval of the image:
 -1.448  11.005 (delta_t =  12.453 [sec])
Background time interval of the image:
-239.296  -1.448 (delta_t = 237.848 [sec])
Light Curves
Note: The mask-weighted lightcurves have units of either count/det or counts/sec/det, where a det is 0.4 x 0.4 = 0.16 sq cm.
Full-time range; 1 s binning
Other quick-look light curves:
- 64 ms binning (zoomed)
- 16 ms binning (zoomed)
- 8 ms binning (zoomed)
- 2 ms binning (zoomed)
- SN=5 or 10 s binning (full-time range)
- Raw light curve
Spectra
- 64 ms binning (zoomed)
- 16 ms binning (zoomed)
- 8 ms binning (zoomed)
- 2 ms binning (zoomed)
- SN=5 or 10 s binning (full-time range)
- Raw light curve
Spectra
Notes:
- 1) The fitting includes the systematic errors.
- 2) When the burst includes telescope slew time periods, the fitting uses an average response file made from multiple 5-s response files through out the slew time plus single time preiod for the non-slew times, and weighted by the total counts in the corresponding time period using addrmf. An average response file is needed becuase a spectral fit using the pre-slew DRM will introduce some errors in both a spectral shape and a normalization if the PHA file contains a lot of the slew/post-slew time interval.
- 3) For fits to more complicated models (e.g. a power-law over a cutoff power-law), the BAT team has decided to require a chi-square improvement of more than 6 for each extra dof.
Time averaged spectrum fit using the average DRM
Power-law model
Time interval is from   -1.448 sec. to  271.204 sec.

Spectral model in power-law:
------------------------------------------------------------
Parameters  : value       lower 90%   higher 90%
Photon index: -1.25351     ( -0.0597708   0.0599395 )
Norm@50keV  : 2.96169E-03    ( -9.0685e-05   9.06772e-05 )
------------------------------------------------------------
#Fit statistic : Chi-Squared =          52.47 using 59 PHA bins.
# Reduced chi-squared =         0.9204 for     57 degrees of freedom
# Null hypothesis probability =   6.456573e-01

Photon flux (15-150 keV)    in 272.7 sec: 0.350492 ( -0.011384  0.011419 ) ph/cm2/s
Energy fluence (15-150 keV)             : 8.07634e-06 ( -2.72735e-07  2.73829e-07 ) ergs/cm2
Cutoff power-law model
Time interval is from   -1.448 sec. to  271.204 sec.
Spectral model in the cutoff power-law:
------------------------------------------------------------
Parameters  : value       lower 90%   higher 90%
Photon index: -1.15908     ( -0.120567   0.238084 )
Epeak [keV] : 495.380      ( -495.441 -495.441 )
Norm@50keV  : 3.26734E-03    ( -0.000491682   0.000888183 )
------------------------------------------------------------
#Fit statistic : Chi-Squared =          51.97 using 59 PHA bins.
# Reduced chi-squared =         0.9280 for     56 degrees of freedom
# Null hypothesis probability =   6.281245e-01

Photon flux (15-150 keV)    in 272.7 sec: 0.348155 ( -0.012633  0.012598 ) ph/cm2/s
Energy fluence (15-150 keV)             : 8.0191e-06 ( -3.06599e-07  3.0381e-07 ) ergs/cm2
1-s peak spectrum fit
Power-law model
Time interval is from    7.264 sec. to    8.264 sec.

Spectral model in power-law:
------------------------------------------------------------
Parameters  : value       lower 90%   higher 90%
Photon index: -0.863463     ( -0.0741684   0.0746961 )
Norm@50keV  : 6.67121E-02    ( -0.00271614   0.00271093 )
------------------------------------------------------------
#Fit statistic : Chi-Squared =          67.15 using 59 PHA bins.
# Reduced chi-squared =          1.178 for     57 degrees of freedom
# Null hypothesis probability =   1.682389e-01

Photon flux (15-150 keV)    in 1 sec: 7.65685 ( -0.3106  0.3107 ) ph/cm2/s
Energy fluence (15-150 keV)             : 7.59626e-07 ( -3.51233e-08  3.52694e-08 ) ergs/cm2
Cutoff power-law model
Time interval is from    7.264 sec. to    8.264 sec.
Spectral model in the cutoff power-law:
------------------------------------------------------------
Parameters  : value       lower 90%   higher 90%
Photon index: -0.687076     ( -0.223742   0.304523 )
Epeak [keV] : 437.420      ( -437.42 -437.42 )
Norm@50keV  : 7.95734E-02    ( -0.0150474   0.0272596 )
------------------------------------------------------------
#Fit statistic : Chi-Squared =          66.06 using 59 PHA bins.
# Reduced chi-squared =          1.180 for     56 degrees of freedom
# Null hypothesis probability =   1.682605e-01

Photon flux (15-150 keV)    in 1 sec: 7.59784 ( -0.32508  0.32453 ) ph/cm2/s
Energy fluence (15-150 keV)             : 7.52749e-07 ( -3.72978e-08  3.70926e-08 ) ergs/cm2
Time-resolved spectra
Distribution
T90 vs. Hardness ratio plot
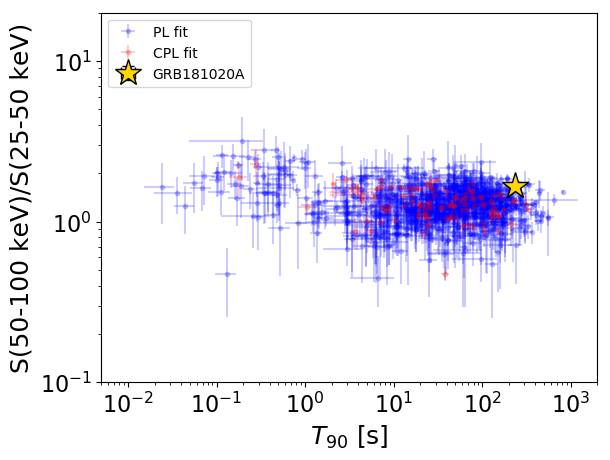
T90                                   = 238.016 sec.
Hardness ratio (energy fluence ratio) = 1.67776164318
S(15-50 keV) vs. S(50-150 keV) plot
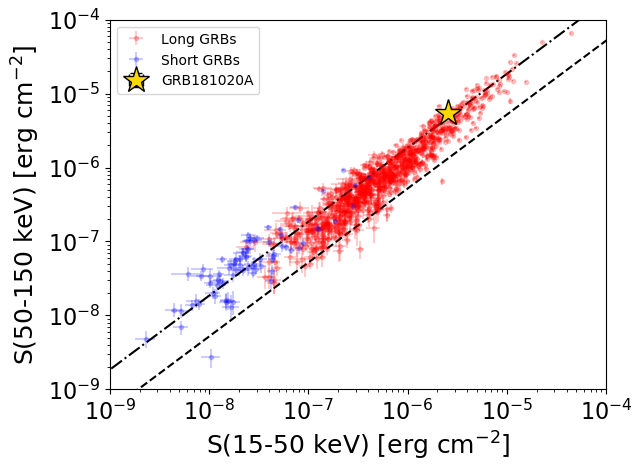
S(15-50 keV)  = 2.5695544e-06
S(50-150 keV) = 5.506902e-06
The dash-dotted line and the dashed line traces the fluences calculated from the Band function with Epeak = 15 and 150 keV, respectively. Both lines assume a canonical values of alpha = -1 and beta = -2.5.
Mask shadow pattern
IMX = 9.197117906108621E-02, IMY = -1.945902495346681E-01
Spacecraft aspect plot
Bright source in the pre-burst/pre-slew/post-slew images
Pre-burst image of 15-350 keV band
Time interval of the image:
-239.296000 -1.448000

# RAcent  DECcent POSerr Theta    Phi  PeakCts   SNR AngSep     Name
#  [deg]    [deg]    ['] [deg]  [deg]                   [']
 63.0943 -21.5448    2.2  47.8  145.0   4.9395   5.1 ------	UNKNOWN
 32.0144 -48.1610    3.3  12.5  124.0   0.8567   3.5 ------	UNKNOWN
112.2376 -41.0770    3.0  56.4 -157.2   5.2494   3.9 ------	UNKNOWN
290.4717 -77.2096    2.4  33.6  -68.8   2.1381   4.7 ------	UNKNOWN
Pre-slew background subtracted image of 15-350 keV band
Time interval of the image:
-1.448000 11.004600

# RAcent  DECcent POSerr Theta    Phi  PeakCts   SNR AngSep     Name
#  [deg]    [deg]    ['] [deg]  [deg]                   [']
 35.7417 -19.5622    2.0  40.7  109.3   2.4738   5.7 ------	UNKNOWN
 13.9856 -47.3720    0.2  12.1   64.7   8.2383  68.9 ------	UNKNOWN
 19.3493 -62.0110    2.3   3.3  -79.5   0.5192   4.9 ------	UNKNOWN
 86.0326 -61.8494    2.2  31.0 -148.6   0.6875   5.3 ------	UNKNOWN
103.4378 -42.9839    1.9  50.8 -161.9   1.7003   6.1 ------	UNKNOWN
273.6128 -62.5031    2.7  46.6  -55.1   2.0185   4.2 ------	UNKNOWN
Post-slew image of 15-350 keV band
Time interval of the image:
44.404600 962.793300

# RAcent  DECcent POSerr Theta    Phi  PeakCts   SNR AngSep     Name
#  [deg]    [deg]    ['] [deg]  [deg]                   [']
328.6638  -9.0594    2.6  54.1   17.0  12.6998   4.4 ------	UNKNOWN
106.2724 -80.8487    3.4  43.8 -116.2  10.9764   3.5 ------	UNKNOWN