Analysis Summary
Notes:
- 1) No attempt has been made to eliminate the non-significant decimal places.
- 2) This batgrbproduct analysis is done using the HEASARC data.
- 3) This batgrbproduct analysis is using the flight position for the mask-weighting calculation.
======================================================================
                  BAT GRB EVENT DATA PROCESSING REPORT
    Process Script Ver: batgrbproduct v2.46
    Process Start Time: Mon Dec 17 17:32:18 EST 2018
             Host Name: bat1
   Current Working Dir: /local/data/bat1/alien/Swift_3rdBATcatalog/event/batevent_reproc/trigger868312
======================================================================

  Trigger: 00868312      Segment: 000

  BAT Trigger Time: 561922234.944   [s; MET]
      Trigger Stop: 561922240.448   [s; MET]
               UTC: 2018-10-22T17:30:13.147700    [includes UTCF correction]
       Where From?: TDRSS position message

  BAT
    RA: 56.7952243531036   Dec: -29.3323371797094  [deg; J2000]

     Catalogged Source?: NO
     Point Source?:      YES
     GRB Indicated?:     YES    [ by BAT flight software ]
     Image S/N Ratio:    7.23
     Image Trigger?:     NO
     Rate S/N Ratio:     13.0384048104053  [ if not an image trigger ]
     Image S/N Ratio:    7.23

  Analysis Position:   [ source = BAT ]
    RA: 56.7952243531036   Dec: -29.3323371797094  [deg; J2000]

  Refined Position:   [ source = BAT pre-slew burst ]
    RA: 56.8262198756328   Dec: -29.3380471074766  [deg; J2000]
        { 03h 47m 18.3s , -29d 20' 17.0" }
         +/- 2.96330368269607 [arcmin] (estimated 90% radius based on SNR)
         +/- 1.46562194103079 [arcmin] (formal 1-sigma fit error)
    SNR: 6.44395406680995

  Angular difference between the analysis and refined position is 1.657058 arcmin

  Partial Coding Fraction: 1.03125    [ including projection effects ]

  Duration
     T90: 7.93599998950958 +/- 2.58436520285285
        Measured from: -1.15600001811981
                   to: 6.77999997138977     [s; relative to TRIGTIME]
     T50: 3.73599994182587 +/- 2.07183882053921
        Measured from: 1.21200001239777
                   to: 4.94799995422363     [s; relative to TRIGTIME]


  Fluence
     Peak Flux  (peak 1 second)
        Measured from: 4.40400004386902
                   to: 5.40400004386902     [s; relative to TRIGTIME]
     Total Fluence
        Measured from: -1.64400005340576
                   to: 7.96399998664856     [s; relative to TRIGTIME]

             Band 1     Band 2     Band 3     Band 4
              15-25      25-50     50-100    100-350     keV
 Total     0.059566   0.082269   0.095226   0.057324
           0.020402   0.021639   0.020195   0.018604 [error]
 Peak      0.009475   0.015498   0.024105   0.017462
           0.006506   0.007154   0.006987   0.006166 [error]

     [ fluence units of on-axis counts / fully illuminated detector ]

======================================================================


====== Table of the duration information =============================

        Value   tstart    tstop
T100    9.608   -1.644    7.964
T90     7.936   -1.156    6.780
T50     3.736    1.212    4.948
Peak    1.000    4.404    5.404


====== Spectral Analysis Summary =====================================

Model      : spectral model: simple power-law (PL) and cutoff power-law (CPL)
Ph_index   : photon index: E^{Ph_index}
Ph_90err   : 90% error of the photon index
Epeak      : Epeak in keV
Epeak_90err: 90% error of Epeak
Norm       : normalization at 50 keV in both the PL model and CPL model
Nomr_90err : 90% error of the normalization
chi2       : Chi-Squared
dof        : degree of freedo

=== Time-averaged spectral analysis ===
(Best model with acceptable fit: PL)

Model Ph_index Ph_90err_low Ph_90err_hi  Epeak  Epeak_90err_low  Epeak_90err_hi  Norm       Nomr_90err_low    Norm_90err_hi    chi2    dof
PL      -0.962    -0.426      0.463       -           -               -         1.79e-03     -4.30e-04          4.25e-04      59.860   57
CPL     -0.723     0.723      1.983      303.025    -303.025      -303.025      2.29e-03     -9.14e-04          1.12e-02      59.880   56


=== 1-s peak spectral analysis ===
(Best model with acceptable fit: PL)

Model Ph_index Ph_90err_low Ph_90err_hi  Epeak  Epeak_90err_low  Epeak_90err_hi  Norm       Nomr_90err_low    Norm_90err_hi    chi2    dof
PL      -1.192     -0.646     0.635       -           -               -         3.54e-03     -1.35e-03          1.34e-03      59.160   57
CPL      1.111     -3.371    -1.111       75.448     -24.641       -75.448      3.81e-02     -3.81e-02          1.05e+02      57.790   56


=== Fluence/Peak Flux Summary ===

              Model    Band1     Band2     Band3     Band4     Band5     Total
                       15-25     25-50    50-100    100-350    15-150    15-350    keV
Fluence         PL   1.33e-08  3.40e-08  6.97e-08  3.63e-07  1.88e-07  4.80e-07   erg/cm2
      90%_error_low -6.03e-09 -1.02e-08 -1.88e-08 -1.82e-07 -4.89e-08 -1.97e-07   erg/cm2
      90%_error_hi   7.08e-09  9.73e-09  1.84e-08  2.96e-07  4.97e-08  2.98e-07   erg/cm2
Peak flux       PL   1.08e-01  1.31e-01  1.15e-01  1.72e-01  4.15e-01  5.26e-01   ph/cm2/s
      90%_error_low -6.25e-02 -5.54e-02 -5.22e-02 -1.17e-01 -1.58e-01 -2.09e-01   ph/cm2/s
      90%_error_hi   7.60e-02  5.39e-02  5.10e-02  2.04e-01  1.58e-01  2.29e-01   ph/cm2/s

Fluence        CPL   1.30e-08  3.42e-08  7.03e-08  3.23e-07  1.87e-07  3.67e-07   erg/cm2
      90%_error_low -7.92e-09 -1.02e-08 -1.93e-08    N/A    -5.25e-08 -2.09e-07   erg/cm2
      90%_error_hi   5.73e-09  1.09e-08  2.26e-08    N/A     5.03e-08  3.96e-07   erg/cm2
Peak flux      CPL   5.82e-02  1.44e-01  1.43e-01  4.04e-02  3.79e-01  3.86e-01   ph/cm2/s
      90%_error_low -5.82e-02 -1.12e-01     N/A   -4.04e-02 -1.88e-01 -1.95e-01   ph/cm2/s
      90%_error_hi   1.03e-01  7.01e-02     N/A    1.90e-01  1.69e-01  2.58e-01   ph/cm2/s

======================================================================
Image
Pre-slew 15.0-350.0 keV image (Event data)
#   RAcent    DECcent   POSerr    Theta     Phi              Peak Cts       SNR   Name
   56.8262   -29.3380   0.0298     1.0725   136.9050         0.2607231      6.444 TRIG_00868312

Foreground time interval of the image:
 -1.644   7.964 (delta_t =   9.608 [sec])
Background time interval of the image:
-239.944  -1.644 (delta_t = 238.300 [sec])
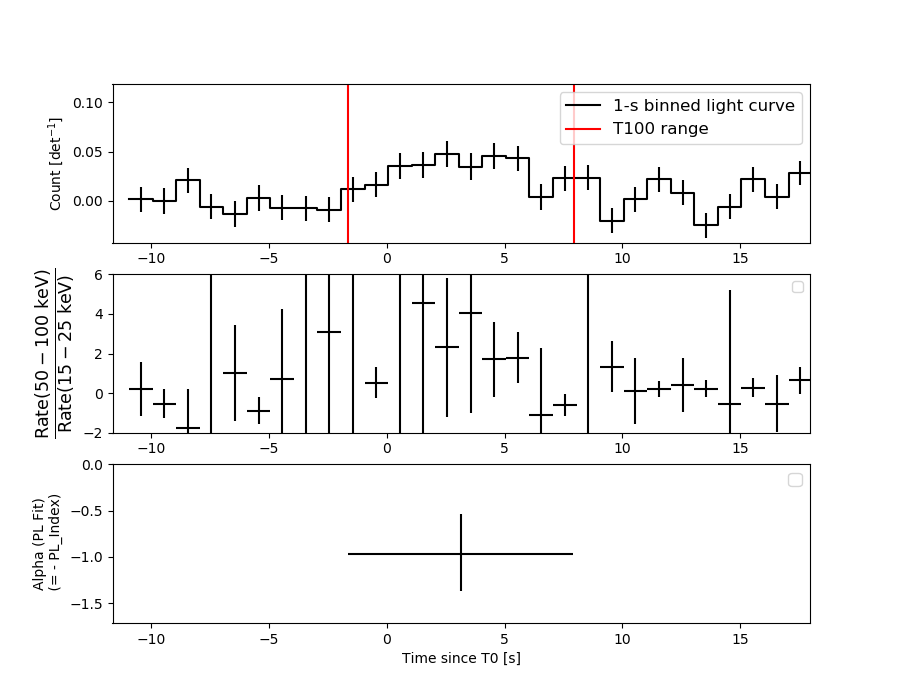
Light Curves
Note: The mask-weighted lightcurves have units of either count/det or counts/sec/det, where a det is 0.4 x 0.4 = 0.16 sq cm.
Full-time range; 1 s binning
Other quick-look light curves:
- 64 ms binning (zoomed)
- 16 ms binning (zoomed)
- 8 ms binning (zoomed)
- 2 ms binning (zoomed)
- SN=5 or 10 s binning (full-time range)
- Raw light curve
Spectra
- 64 ms binning (zoomed)
- 16 ms binning (zoomed)
- 8 ms binning (zoomed)
- 2 ms binning (zoomed)
- SN=5 or 10 s binning (full-time range)
- Raw light curve
Spectra
Notes:
- 1) The fitting includes the systematic errors.
- 2) When the burst includes telescope slew time periods, the fitting uses an average response file made from multiple 5-s response files through out the slew time plus single time preiod for the non-slew times, and weighted by the total counts in the corresponding time period using addrmf. An average response file is needed becuase a spectral fit using the pre-slew DRM will introduce some errors in both a spectral shape and a normalization if the PHA file contains a lot of the slew/post-slew time interval.
- 3) For fits to more complicated models (e.g. a power-law over a cutoff power-law), the BAT team has decided to require a chi-square improvement of more than 6 for each extra dof.
Time averaged spectrum fit using the average DRM
Power-law model

Time interval is from   -1.644 sec. to    7.964 sec.

Spectral model in power-law:
------------------------------------------------------------
Parameters  : value       lower 90%   higher 90%
Photon index: -0.96189     ( -0.426004   0.462632 )
Norm@50keV  : 1.78590E-03    ( -0.000429643   0.000425131 )
------------------------------------------------------------
#Fit statistic : Chi-Squared =          59.86 using 59 PHA bins.
# Reduced chi-squared =          1.050 for     57 degrees of freedom
# Null hypothesis probability =   3.722022e-01

Photon flux (15-150 keV)    in 9.608 sec: 0.205262 ( -0.049519  0.049805 ) ph/cm2/s
Energy fluence (15-150 keV)             : 1.88136e-07 ( -4.88645e-08  4.97028e-08 ) ergs/cm2
Cutoff power-law model
Time interval is from   -1.644 sec. to    7.964 sec.
Spectral model in the cutoff power-law:
------------------------------------------------------------
Parameters  : value       lower 90%   higher 90%
Photon index: -0.955856     ( 0.737134   1.99715 )
Epeak [keV] : 9987.73      ( -9960.41 -9960.41 )
Norm@50keV  : 1.79704E-03    ( -0.000423718   0.0116876 )
------------------------------------------------------------
#Fit statistic : Chi-Squared =          59.86 using 59 PHA bins.
# Reduced chi-squared =          1.069 for     56 degrees of freedom
# Null hypothesis probability =   3.374076e-01

Photon flux (15-150 keV)    in 9.608 sec: 0.204505 ( -0.051965  0.050372 ) ph/cm2/s
Energy fluence (15-150 keV)             : 1.8725e-07 ( -5.25021e-08  5.03205e-08 ) ergs/cm2
1-s peak spectrum fit
Power-law model
Time interval is from    4.404 sec. to    5.404 sec.

Spectral model in power-law:
------------------------------------------------------------
Parameters  : value       lower 90%   higher 90%
Photon index: -1.19232     ( -0.645684   0.635132 )
Norm@50keV  : 3.53582E-03    ( -0.00135222   0.00134487 )
------------------------------------------------------------
#Fit statistic : Chi-Squared =          59.16 using 59 PHA bins.
# Reduced chi-squared =          1.038 for     57 degrees of freedom
# Null hypothesis probability =   3.967057e-01

Photon flux (15-150 keV)    in 1 sec: 0.414595 ( -0.157749  0.158047 ) ph/cm2/s
Energy fluence (15-150 keV)             : 3.59534e-08 ( -1.52033e-08  1.57918e-08 ) ergs/cm2
Cutoff power-law model
Time interval is from    4.404 sec. to    5.404 sec.
Spectral model in the cutoff power-law:
------------------------------------------------------------
Parameters  : value       lower 90%   higher 90%
Photon index: 1.11123     ( -3.41279   -1.15332 )
Epeak [keV] : 75.4480      ( -24.3332 -75.1398 )
Norm@50keV  : 3.80843E-02    ( -0.040345   104.644 )
------------------------------------------------------------
#Fit statistic : Chi-Squared =          57.79 using 59 PHA bins.
# Reduced chi-squared =          1.032 for     56 degrees of freedom
# Null hypothesis probability =   4.090747e-01

Photon flux (15-150 keV)    in 1 sec: 0.378558 ( -0.187768  0.169491 ) ph/cm2/s
Energy fluence (15-150 keV)             : 3.26926e-08 ( -1.39884e-08  1.64027e-08 ) ergs/cm2
Time-resolved spectra
Distribution
T90 vs. Hardness ratio plot
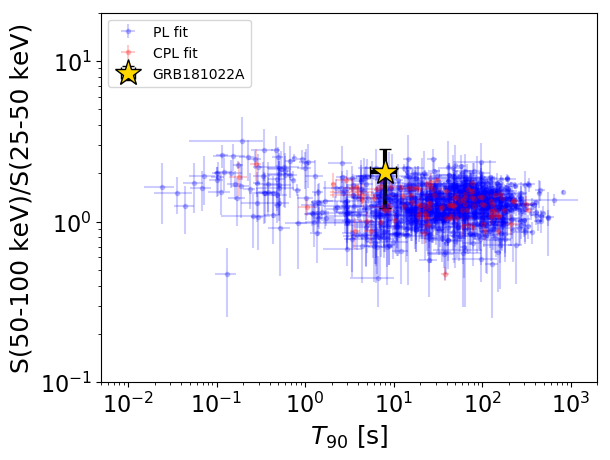
T90                                   = 7.936 sec.
Hardness ratio (energy fluence ratio) = 2.05352487451
S(15-50 keV) vs. S(50-150 keV) plot
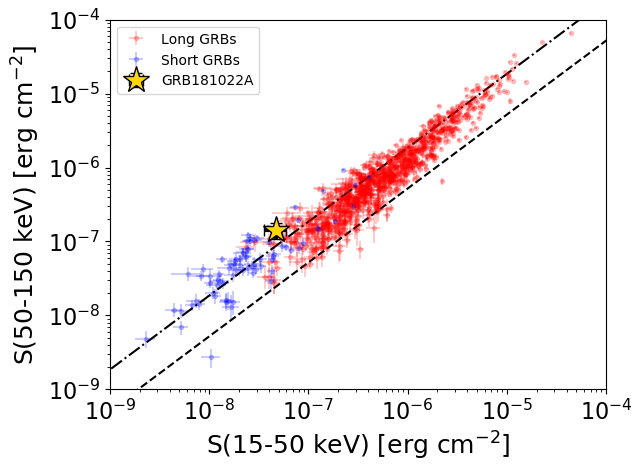
S(15-50 keV)  = 4.723535e-08
S(50-150 keV) = 1.4090277e-07
The dash-dotted line and the dashed line traces the fluences calculated from the Band function with Epeak = 15 and 150 keV, respectively. Both lines assume a canonical values of alpha = -1 and beta = -2.5.
Mask shadow pattern
IMX = -1.367079274893475E-02, IMY = -1.279064624783077E-02
Spacecraft aspect plot
Bright source in the pre-burst/pre-slew/post-slew images
Pre-burst image of 15-350 keV band
Time interval of the image:
-239.944000 -1.644000

# RAcent  DECcent POSerr Theta    Phi  PeakCts   SNR AngSep     Name
#  [deg]    [deg]    ['] [deg]  [deg]                   [']
 13.7721 -26.7913    2.4  37.7   40.1   2.1671   4.7 ------	UNKNOWN
  9.1182 -30.5130    2.9  40.8   32.9   1.8259   4.0 ------	UNKNOWN
334.0981 -66.4745    3.0  59.5  -17.0   5.5291   3.8 ------	UNKNOWN
Pre-slew background subtracted image of 15-350 keV band
Time interval of the image:
-1.644000 7.964000

# RAcent  DECcent POSerr Theta    Phi  PeakCts   SNR AngSep     Name
#  [deg]    [deg]    ['] [deg]  [deg]                   [']
353.5549 -41.9435    2.4  51.2   14.1   0.5963   4.8 ------	UNKNOWN
 56.8262 -29.3380    1.8   1.1  136.9   0.2606   6.4 ------	UNKNOWN
 23.1272 -70.6138    2.2  44.3  -29.1   0.3914   5.3 ------	UNKNOWN
110.9287  -6.9261    2.5  55.8 -147.7   1.0819   4.5 ------	UNKNOWN
Post-slew image of 15-350 keV band
Time interval of the image:
76.356600 962.171100

# RAcent  DECcent POSerr Theta    Phi  PeakCts   SNR AngSep     Name
#  [deg]    [deg]    ['] [deg]  [deg]                   [']
354.2107 -32.4129    3.2  53.0   19.5  10.3026   3.7 ------	UNKNOWN
  5.7383 -30.4144    3.2  43.9   25.1   4.2180   3.6 ------	UNKNOWN
352.1845 -47.7740    3.0  52.1    0.0   5.3932   3.9 ------	UNKNOWN
 92.0481 -42.8151    4.7  31.2 -105.0   2.5897   2.4 ------	UNKNOWN