Analysis Summary
Notes:
- 1) No attempt has been made to eliminate the non-significant decimal places.
- 2) This batgrbproduct analysis is done using the HEASARC data.
- 3) This batgrbproduct analysis is using the flight position for the mask-weighting calculation.
======================================================================
BAT GRB EVENT DATA PROCESSING REPORT
Process Script Ver: batgrbproduct v2.46
Process Start Time: Mon Dec 17 16:48:36 EST 2018
Host Name: bat1
Current Working Dir: /local/data/bat1/alien/Swift_3rdBATcatalog/event/batevent_reproc/trigger868984
======================================================================
Trigger: 00868984 Segment: 000
BAT Trigger Time: 562297761.216 [s; MET]
Trigger Stop: 562297769.408 [s; MET]
UTC: 2018-10-27T01:48:59.396380 [includes UTCF correction]
Where From?: TDRSS position message
BAT
RA: 225.382612995229 Dec: 30.8911164541395 [deg; J2000]
Catalogged Source?: NO
Point Source?: YES
GRB Indicated?: YES [ by BAT flight software ]
Image S/N Ratio: 7.88
Image Trigger?: NO
Rate S/N Ratio: 6.6332495807108 [ if not an image trigger ]
Image S/N Ratio: 7.88
Analysis Position: [ source = BAT ]
RA: 225.382612995229 Dec: 30.8911164541395 [deg; J2000]
Refined Position: [ source = BAT pre-slew burst ]
RA: 225.361813448605 Dec: 30.9377412280724 [deg; J2000]
{ 15h 01m 26.8s , +30d 56' 15.9" }
+/- 1.10086378156983 [arcmin] (estimated 90% radius based on SNR)
+/- 0.444035625508325 [arcmin] (formal 1-sigma fit error)
SNR: 26.515448334366
Angular difference between the analysis and refined position is 2.995378 arcmin
Partial Coding Fraction: 0.9609375 [ including projection effects ]
Duration
T90: 81.3039999008179 +/- 12.1059654022228
Measured from: -7.9559999704361
to: 73.3479999303818 [s; relative to TRIGTIME]
T50: 39.9039999246597 +/- 8.00335331431602
Measured from: 17.3280000686646
to: 57.2319999933243 [s; relative to TRIGTIME]
Fluence
Peak Flux (peak 1 second)
Measured from: 47.808000087738
to: 48.808000087738 [s; relative to TRIGTIME]
Total Fluence
Measured from: -18.4519999027252
to: 85.444000005722 [s; relative to TRIGTIME]
Band 1 Band 2 Band 3 Band 4
15-25 25-50 50-100 100-350 keV
Total 1.134164 1.650992 1.272061 0.362323
0.075358 0.073959 0.063518 0.053697 [error]
Peak 0.043863 0.047352 0.046558 0.020170
0.007877 0.007861 0.006902 0.005723 [error]
[ fluence units of on-axis counts / fully illuminated detector ]
======================================================================
====== Table of the duration information =============================
Value tstart tstop
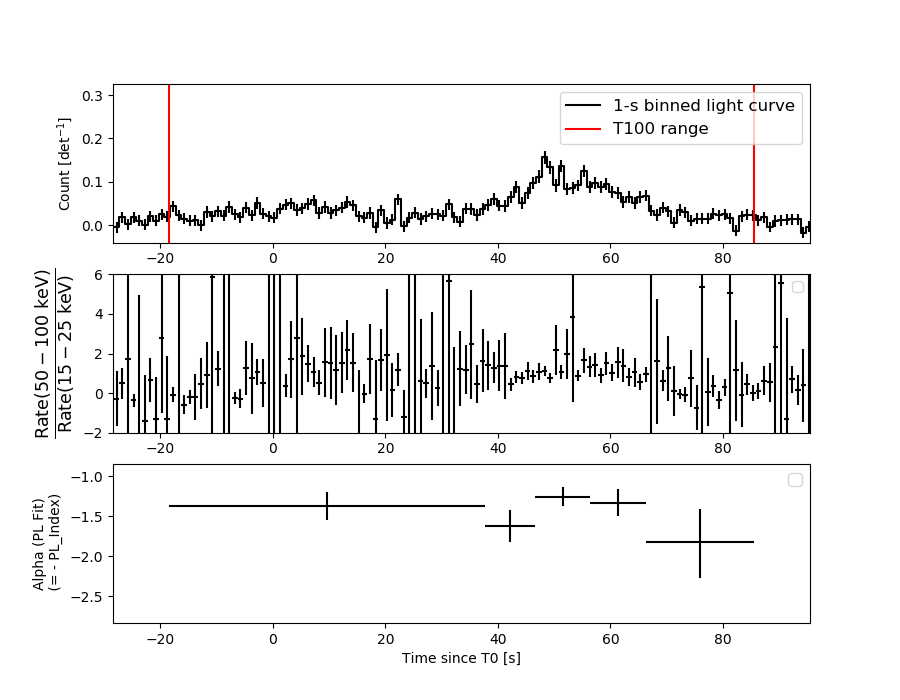
T100 103.896 -18.452 85.444
T90 81.304 -7.956 73.348
T50 39.904 17.328 57.232
Peak 1.000 47.808 48.808
====== Spectral Analysis Summary =====================================
Model : spectral model: simple power-law (PL) and cutoff power-law (CPL)
Ph_index : photon index: E^{Ph_index}
Ph_90err : 90% error of the photon index
Epeak : Epeak in keV
Epeak_90err: 90% error of Epeak
Norm : normalization at 50 keV in both the PL model and CPL model
Nomr_90err : 90% error of the normalization
chi2 : Chi-Squared
dof : degree of freedo
=== Time-averaged spectral analysis ===
(Best model with acceptable fit: PL)
Model Ph_index Ph_90err_low Ph_90err_hi Epeak Epeak_90err_low Epeak_90err_hi Norm Nomr_90err_low Norm_90err_hi chi2 dof
PL -1.417 -0.093 0.093 - - - 2.83e-03 -1.41e-04 1.41e-04 41.070 57
CPL -1.322 -0.271 0.326 348.416 -220.606 -348.416 3.14e-03 -4.34e-04 1.25e-03 41.160 56
=== 1-s peak spectral analysis ===
(Best model with acceptable fit: PL)
Model Ph_index Ph_90err_low Ph_90err_hi Epeak Epeak_90err_low Epeak_90err_hi Norm Nomr_90err_low Norm_90err_hi chi2 dof
PL -1.291 -0.294 0.300 - - - 1.01e-02 -1.49e-03 1.49e-03 44.810 57
CPL -1.313 -0.271 0.329 9999.360 -9999.360 -9999.360 1.02e-02 -1.48e-03 -1.02e-02 44.860 56
=== Fluence/Peak Flux Summary ===
Model Band1 Band2 Band3 Band4 Band5 Total
15-25 25-50 50-100 100-350 15-150 15-350 keV
Fluence PL 3.47e-07 6.71e-07 1.00e-06 3.25e-06 2.83e-06 5.28e-06 erg/cm2
90%_error_low -3.29e-08 -3.76e-08 -6.32e-08 -4.41e-07 -1.54e-07 -4.82e-07 erg/cm2
90%_error_hi 3.40e-08 3.74e-08 6.29e-08 4.88e-07 1.54e-07 5.21e-07 erg/cm2
Peak flux PL 3.42e-01 3.89e-01 3.18e-01 4.35e-01 1.21e+00 1.48e+00 ph/cm2/s
90%_error_low -1.01e-01 -7.07e-02 -5.80e-02 -1.55e-01 -1.86e-01 -2.25e-01 ph/cm2/s
90%_error_hi 1.11e-01 6.77e-02 5.62e-02 2.05e-01 1.86e-01 2.30e-01 ph/cm2/s
Fluence CPL 3.43e-07 6.74e-07 1.01e-06 3.00e-06 2.82e-06 5.03e-06 erg/cm2
90%_error_low -4.05e-08 -3.99e-08 -6.40e-08 -1.18e-06 -1.70e-07 -1.18e-06 erg/cm2
90%_error_hi 3.21e-08 4.20e-08 6.88e-08 3.68e-07 1.63e-07 4.11e-07 erg/cm2
Peak flux CPL 3.42e-01 3.89e-01 3.18e-01 4.32e-01 1.21e+00 1.48e+00 ph/cm2/s
90%_error_low -1.02e-01 -7.36e-02 -5.81e-02 N/A -1.86e-01 -2.38e-01 ph/cm2/s
90%_error_hi 1.10e-01 7.04e-02 5.64e-02 N/A 1.86e-01 2.29e-01 ph/cm2/s
======================================================================
Image
Pre-slew 15.0-350.0 keV image (Event data)
#   RAcent    DECcent   POSerr    Theta     Phi              Peak Cts       SNR   Name
  225.3618    30.9377   0.0073    23.5262   -12.6833         4.3640722     26.515 TRIG_00868984

Foreground time interval of the image:
-18.452  85.444 (delta_t = 103.896 [sec])
Background time interval of the image:
-239.216 -18.452 (delta_t = 220.764 [sec])
Light Curves
Note: The mask-weighted lightcurves have units of either count/det or counts/sec/det, where a det is 0.4 x 0.4 = 0.16 sq cm.
Full-time range; 1 s binning
Other quick-look light curves:
- 64 ms binning (zoomed)
- 16 ms binning (zoomed)
- 8 ms binning (zoomed)
- 2 ms binning (zoomed)
- SN=5 or 10 s binning (full-time range)
- Raw light curve
Spectra
- 64 ms binning (zoomed)
- 16 ms binning (zoomed)
- 8 ms binning (zoomed)
- 2 ms binning (zoomed)
- SN=5 or 10 s binning (full-time range)
- Raw light curve
Spectra
Notes:
- 1) The fitting includes the systematic errors.
- 2) When the burst includes telescope slew time periods, the fitting uses an average response file made from multiple 5-s response files through out the slew time plus single time preiod for the non-slew times, and weighted by the total counts in the corresponding time period using addrmf. An average response file is needed becuase a spectral fit using the pre-slew DRM will introduce some errors in both a spectral shape and a normalization if the PHA file contains a lot of the slew/post-slew time interval.
- 3) For fits to more complicated models (e.g. a power-law over a cutoff power-law), the BAT team has decided to require a chi-square improvement of more than 6 for each extra dof.
Time averaged spectrum fit using the average DRM
Power-law model

Time interval is from  -18.452 sec. to   85.444 sec.

Spectral model in power-law:
------------------------------------------------------------
Parameters  : value       lower 90%   higher 90%
Photon index: -1.41671     ( -0.0928473   0.0930136 )
Norm@50keV  : 2.82671E-03    ( -0.000140767   0.000140676 )
------------------------------------------------------------
#Fit statistic : Chi-Squared =          41.07 using 59 PHA bins.
# Reduced chi-squared =         0.7206 for     57 degrees of freedom
# Null hypothesis probability =   9.446374e-01

Photon flux (15-150 keV)    in 103.9 sec: 0.345575 ( -0.018164  0.018232 ) ph/cm2/s
Energy fluence (15-150 keV)             : 2.82869e-06 ( -1.53615e-07  1.54328e-07 ) ergs/cm2
Cutoff power-law model
Time interval is from  -18.452 sec. to   85.444 sec.
Spectral model in the cutoff power-law:
------------------------------------------------------------
Parameters  : value       lower 90%   higher 90%
Photon index: -1.32162     ( -0.230043   0.366617 )
Epeak [keV] : 348.416      ( -499.201 -627.012 )
Norm@50keV  : 3.13699E-03    ( -0.000294267   0.00138645 )
------------------------------------------------------------
#Fit statistic : Chi-Squared =          41.16 using 59 PHA bins.
# Reduced chi-squared =         0.7351 for     56 degrees of freedom
# Null hypothesis probability =   9.311687e-01

Photon flux (15-150 keV)    in 103.9 sec: 0.344459 ( -0.019427  0.018243 ) ph/cm2/s
Energy fluence (15-150 keV)             : 2.81745e-06 ( -1.69644e-07  1.63029e-07 ) ergs/cm2
1-s peak spectrum fit
Power-law model
Time interval is from   47.808 sec. to   48.808 sec.

Spectral model in power-law:
------------------------------------------------------------
Parameters  : value       lower 90%   higher 90%
Photon index: -1.29133     ( -0.293871   0.300407 )
Norm@50keV  : 1.01376E-02    ( -0.00148715   0.00148581 )
------------------------------------------------------------
#Fit statistic : Chi-Squared =          44.81 using 59 PHA bins.
# Reduced chi-squared =         0.7862 for     57 degrees of freedom
# Null hypothesis probability =   8.791761e-01

Photon flux (15-150 keV)    in 1 sec: 1.20753 ( -0.18578  0.18623 ) ph/cm2/s
Energy fluence (15-150 keV)             : 1.00404e-07 ( -1.65642e-08  1.6713e-08 ) ergs/cm2
Cutoff power-law model
Time interval is from   47.808 sec. to   48.808 sec.
Spectral model in the cutoff power-law:
------------------------------------------------------------
Parameters  : value       lower 90%   higher 90%
Photon index: -1.28893     ( -0.272934   0.327486 )
Epeak [keV] : 1.00000E+04      ( -10000 -10000 )
Norm@50keV  : 1.01793E-02    ( -0.00149225   -0.0101793 )
------------------------------------------------------------
#Fit statistic : Chi-Squared =          44.84 using 59 PHA bins.
# Reduced chi-squared =         0.8007 for     56 degrees of freedom
# Null hypothesis probability =   8.576274e-01

Photon flux (15-150 keV)    in 1 sec: 1.20750 ( -0.18596  0.18607 ) ph/cm2/s
Energy fluence (15-150 keV)             : 9.97861e-08 ( 0  0 ) ergs/cm2
Time-resolved spectra
Distribution
T90 vs. Hardness ratio plot
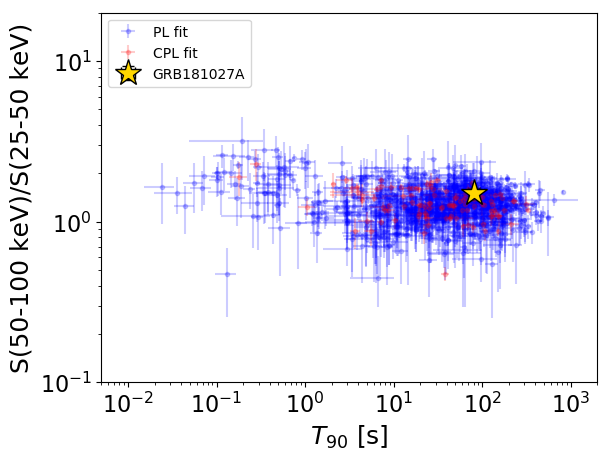
T90                                   = 81.304 sec.
Hardness ratio (energy fluence ratio) = 1.49826929981
S(15-50 keV) vs. S(50-150 keV) plot
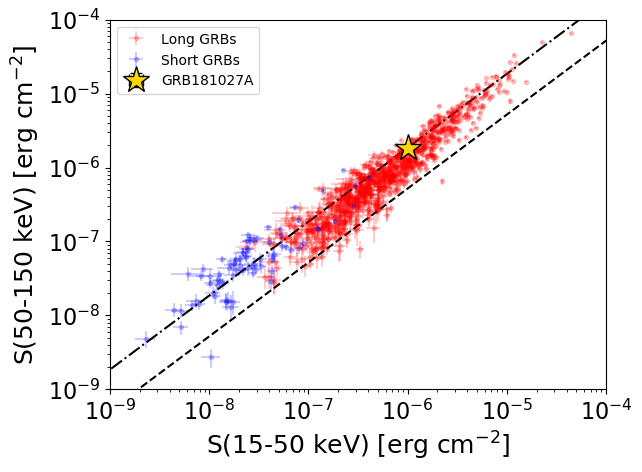
S(15-50 keV)  = 1.0175802e-06
S(50-150 keV) = 1.8111297e-06
The dash-dotted line and the dashed line traces the fluences calculated from the Band function with Epeak = 15 and 150 keV, respectively. Both lines assume a canonical values of alpha = -1 and beta = -2.5.
Mask shadow pattern
IMX = 4.247322076781507E-01, IMY = 9.558767325363765E-02
Spacecraft aspect plot
Bright source in the pre-burst/pre-slew/post-slew images
Pre-burst image of 15-350 keV band
Time interval of the image:
-239.216000 -18.452000

# RAcent  DECcent POSerr Theta    Phi  PeakCts   SNR AngSep     Name
#  [deg]    [deg]    ['] [deg]  [deg]                   [']
244.9903 -15.6260    0.6  35.4 -130.4   7.3253  18.2    1.1	Sco X-1
254.4402  35.3539    1.2  16.6   61.9   2.4712   9.3    1.1	Her X-1
262.9984 -24.6039  357.9  46.5 -154.5  -0.0175  -0.0    8.5	GX 1+4
268.2250  -1.4711    7.3  28.8  179.0  -0.4556  -1.6    8.6	SW J1753.5-0127
270.2881 -24.9535    5.7  49.5 -162.5  -1.2600  -2.0    7.5	GX 5-1
270.3840 -25.7594    5.2  50.2 -162.1   1.3250   2.2    4.5	GRS 1758-258
273.9307 -14.1214    5.6  42.2 -174.6   0.9164   2.1    6.7	GX 17+2
275.8050 -30.3847    4.5  56.6 -164.4  -2.9128  -2.6    6.3	H1820-303
284.9903 -24.9928   15.6  57.2 -176.1   0.9721   0.7    5.0	HT1900.1-2455
288.7976  11.0217    3.9  39.9  140.4   1.9086   3.0    4.6	GRS 1915+105
263.0093 -33.8395    4.4  55.3 -150.8  -3.3157  -2.6    1.0	GX 354-0
279.3899  29.3380    2.7  29.8  109.0   1.6912   4.2 ------	UNKNOWN
268.0315 -31.9500    2.3  55.0 -156.4   4.8308   5.1 ------	UNKNOWN
232.6659  -7.6573    2.6  31.3 -105.0   1.6832   4.4 ------	UNKNOWN
236.1789 -23.8718    2.5  45.1 -120.2   5.3481   4.7 ------	UNKNOWN
Pre-slew background subtracted image of 15-350 keV band
Time interval of the image:
-18.452000 85.444000

# RAcent  DECcent POSerr Theta    Phi  PeakCts   SNR AngSep     Name
#  [deg]    [deg]    ['] [deg]  [deg]                   [']
245.1524 -15.5989    3.7  35.4 -130.7  -0.7751  -3.1   10.3	Sco X-1
254.5109  35.5158    5.3  16.8   61.9  -0.3885  -2.2   10.7	Her X-1
263.2450 -24.7609    0.0  46.7 -154.7  -0.4122  -1.1   12.9	GX 1+4
268.3149  -1.5923    6.7  28.9  179.0   0.3166   1.7    9.0	SW J1753.5-0127
270.2977 -25.0028    6.8  49.5 -162.4   0.6475   1.7    4.6	GX 5-1
270.4684 -25.7245    5.8  50.2 -162.2  -0.7976  -2.0    9.0	GRS 1758-258
273.9703 -13.9639    5.0  42.1 -174.8  -0.6215  -2.3    4.8	GX 17+2
275.9271 -30.2949    7.2  56.6 -164.6  -1.3010  -1.6    4.3	H1820-303
284.8856 -24.8872   20.8  57.0 -176.1   0.4985   0.6    8.4	HT1900.1-2455
288.8930  11.0539    3.9  40.0  140.3  -1.2040  -3.0    8.6	GRS 1915+105
262.9548 -33.8468    3.6  55.3 -150.7   2.6162   3.2    1.9	GX 354-0
252.5921  54.4476    3.1  35.0   48.5   1.1654   3.7 ------	UNKNOWN
225.3618  30.9377    0.4  23.5  -12.7   4.3637  26.5 ------	UNKNOWN
235.7565   6.7186    2.2  17.7  -91.0   0.8836   5.2 ------	UNKNOWN
216.2520  18.9412    2.1  30.2  -41.8   1.0964   5.4 ------	UNKNOWN
Post-slew image of 15-350 keV band
Time interval of the image:
-239.216000 962.834000

# RAcent  DECcent POSerr Theta    Phi  PeakCts   SNR AngSep     Name
#  [deg]    [deg]    ['] [deg]  [deg]                   [']
244.9827 -15.6279    0.5  35.4 -130.4  40.0464  24.8    0.8	Sco X-1
254.4400  35.3515    1.0  16.6   61.9  12.9062  12.0    1.0	Her X-1
262.9799 -24.5864    0.0  46.5 -154.5   2.0308   0.9    9.7	GX 1+4
268.2070  -1.4644    5.4  28.8  179.0  -2.5059  -2.1    9.7	SW J1753.5-0127
270.2593 -25.1505    6.8  49.6 -162.3   4.1862   1.7    4.5	GX 5-1
270.3384 -25.7525    4.8  50.2 -162.0   5.9893   2.4    2.0	GRS 1758-258
273.9609 -14.1511    4.4  42.2 -174.6   4.4236   2.6    7.4	GX 17+2
275.8394 -30.3595    4.7  56.6 -164.5  -9.9995  -2.4    4.5	H1820-303
284.8458 -24.8794    0.0  57.0 -176.0   6.0598   1.3   10.6	HT1900.1-2455
288.7452  10.9955    4.6  39.9  140.5   7.1093   2.5    4.3	GRS 1915+105
262.8269 -33.8475    6.5  55.3 -150.6   8.9945   1.8    8.1	GX 354-0
242.7614  59.8241    3.9  40.4   39.8   6.4083   2.9 ------	UNKNOWN
222.1005  59.3116    3.4  43.9   25.2   6.1140   3.4 ------	UNKNOWN
216.2291  44.9188    3.6  36.6    5.1   4.4381   3.2 ------	UNKNOWN
191.3119  45.8103    3.5  53.2   -2.8   7.5696   3.3 ------	UNKNOWN
232.6645  -7.7108    2.7  31.4 -105.1   6.7702   4.3 ------	UNKNOWN