Analysis Summary
Notes:
- 1) No attempt has been made to eliminate the non-significant decimal places.
- 2) This batgrbproduct analysis is done using the HEASARC data.
- 3) This batgrbproduct analysis is using the flight position for the mask-weighting calculation.
======================================================================
                  BAT GRB EVENT DATA PROCESSING REPORT
    Process Script Ver: batgrbproduct v2.46
    Process Start Time: Mon Dec 17 16:27:59 EST 2018
             Host Name: bat1
   Current Working Dir: /local/data/bat1/alien/Swift_3rdBATcatalog/event/batevent_reproc/trigger869494
======================================================================

  Trigger: 00869494      Segment: 000

  BAT Trigger Time: 562555664   [s; MET]
      Trigger Stop: 562555728   [s; MET]
               UTC: 2018-10-30T01:27:22.164360    [includes UTCF correction]
       Where From?: TDRSS position message

  BAT
    RA: 146.922199813726   Dec: 14.6579611316373  [deg; J2000]

     Catalogged Source?: NO
     Point Source?:      YES
     GRB Indicated?:     YES    [ by BAT flight software ]
     Image S/N Ratio:    17.58
     Image Trigger?:     YES
     Rate S/N Ratio:     0  [ if not an image trigger ]
     Image S/N Ratio:    17.58

  Analysis Position:   [ source = BAT ]
    RA: 146.922199813726   Dec: 14.6579611316373  [deg; J2000]

  Refined Position:   [ source = BAT pre-slew burst ]
    RA: 146.916387552657   Dec: 14.657221636123  [deg; J2000]
        { 09h 47m 39.9s , +14d 39' 26.0" }
         +/- 1.08526543769756 [arcmin] (estimated 90% radius based on SNR)
         +/- 0.402269405279989 [arcmin] (formal 1-sigma fit error)
    SNR: 27.0615523221203

  Angular difference between the analysis and refined position is 0.340291 arcmin

  Partial Coding Fraction: 0.7109375    [ including projection effects ]

  Duration
     T90: 303.195999979973 +/- 78.5981634979086
        Measured from: 18.2439999580383
                   to: 321.439999938011     [s; relative to TRIGTIME]
     T50: 95.191999912262 +/- 12.1475614086886
        Measured from: 56
                   to: 151.191999912262     [s; relative to TRIGTIME]


  Fluence
     Peak Flux  (peak 1 second)
        Measured from: 71.3279999494553
                   to: 72.3279999494553     [s; relative to TRIGTIME]
     Total Fluence
        Measured from: 3.19200003147125
                   to: 443.003999948502     [s; relative to TRIGTIME]

             Band 1     Band 2     Band 3     Band 4
              15-25      25-50     50-100    100-350     keV
 Total     3.113751   4.162622   2.668422   0.569505
           0.153047   0.158696   0.137470   0.116817 [error]
 Peak      0.038323   0.027252   0.031925   0.025538
           0.008462   0.009022   0.007804   0.006434 [error]

     [ fluence units of on-axis counts / fully illuminated detector ]

======================================================================


====== Table of the duration information =============================

        Value   tstart    tstop
T100  439.812    3.192  443.004
T90   303.196   18.244  321.440
T50    95.192   56.000  151.192
Peak    1.000   71.328   72.328


====== Spectral Analysis Summary =====================================

Model      : spectral model: simple power-law (PL) and cutoff power-law (CPL)
Ph_index   : photon index: E^{Ph_index}
Ph_90err   : 90% error of the photon index
Epeak      : Epeak in keV
Epeak_90err: 90% error of Epeak
Norm       : normalization at 50 keV in both the PL model and CPL model
Nomr_90err : 90% error of the normalization
chi2       : Chi-Squared
dof        : degree of freedo

=== Time-averaged spectral analysis ===
(Best model with acceptable fit: PL)

Model Ph_index Ph_90err_low Ph_90err_hi  Epeak  Epeak_90err_low  Epeak_90err_hi  Norm       Nomr_90err_low    Norm_90err_hi    chi2    dof
PL      -1.730    -0.086      0.085       -           -               -         1.51e-03     -7.48e-05          7.44e-05      62.270   57
CPL     -1.337    -0.341      0.370       80.789     -19.037       176.339      2.41e-03     -7.91e-04          1.31e-03      58.370   56


=== 1-s peak spectral analysis ===
(Best model with acceptable fit: PL)

Model Ph_index Ph_90err_low Ph_90err_hi  Epeak  Epeak_90err_low  Epeak_90err_hi  Norm       Nomr_90err_low    Norm_90err_hi    chi2    dof
PL      -1.533     -0.503     0.493       -           -               -         6.72e-03     -1.79e-03          1.73e-03      59.140   57
CPL     -1.563     -0.464    -0.196     9999.360      N/A           N/A         6.63e-03        N/A               N/A         59.160   56


=== Fluence/Peak Flux Summary ===

              Model    Band1     Band2     Band3     Band4     Band5     Total
                       15-25     25-50    50-100    100-350    15-150    15-350    keV
Fluence         PL   1.05e-06  1.68e-06  2.02e-06  4.77e-06  6.12e-06  9.53e-06   erg/cm2
      90%_error_low -8.17e-08 -8.03e-08 -1.35e-07 -6.42e-07 -3.16e-07 -7.59e-07   erg/cm2
      90%_error_hi   8.36e-08  8.02e-08  1.35e-07  7.06e-07  3.18e-07  8.08e-07   erg/cm2
Peak flux       PL   2.86e-01  2.82e-01  1.95e-01  2.12e-01  8.47e-01  9.75e-01   ph/cm2/s
      90%_error_low -1.23e-01 -7.83e-02 -6.75e-02 -1.21e-01 -2.17e-01 -2.46e-01   ph/cm2/s
      90%_error_hi   1.36e-01  7.46e-02  6.41e-02  1.92e-01  2.17e-01  2.48e-01   ph/cm2/s

Fluence        CPL   9.88e-07  1.74e-06  2.05e-06  2.62e-06  5.92e-06  7.40e-06   erg/cm2
      90%_error_low -9.72e-08 -9.84e-08 -1.43e-07 -9.96e-07 -3.63e-07 -1.06e-06   erg/cm2
      90%_error_hi   9.87e-08  1.00e-07  1.44e-07  1.76e-06  3.64e-07  1.77e-06   erg/cm2
Peak flux      CPL   2.86e-01  2.81e-01  1.92e-01  2.38e-01  8.60e-01  9.70e-01   ph/cm2/s
      90%_error_low -1.24e-01 -7.89e-02     N/A       N/A   -2.28e-01 -2.48e-01   ph/cm2/s
      90%_error_hi   1.36e-01  7.76e-02     N/A       N/A    2.06e-01  2.47e-01   ph/cm2/s

======================================================================
Image
Pre-slew 15.0-350.0 keV image (Event data)
#   RAcent    DECcent   POSerr    Theta     Phi              Peak Cts       SNR   Name
  146.9164    14.6572   0.0071    35.7683    -6.4828         4.1669157     27.062 TRIG_00869494

Foreground time interval of the image:
  3.192  72.501 (delta_t =  69.309 [sec])
Background time interval of the image:
-217.899   3.192 (delta_t = 221.091 [sec])
Light Curves
Note: The mask-weighted lightcurves have units of either count/det or counts/sec/det, where a det is 0.4 x 0.4 = 0.16 sq cm.
Full-time range; 1 s binning
Other quick-look light curves:
- 64 ms binning (zoomed)
- 16 ms binning (zoomed)
- 8 ms binning (zoomed)
- 2 ms binning (zoomed)
- SN=5 or 10 s binning (full-time range)
- Raw light curve
Spectra
- 64 ms binning (zoomed)
- 16 ms binning (zoomed)
- 8 ms binning (zoomed)
- 2 ms binning (zoomed)
- SN=5 or 10 s binning (full-time range)
- Raw light curve
Spectra
Notes:
- 1) The fitting includes the systematic errors.
- 2) When the burst includes telescope slew time periods, the fitting uses an average response file made from multiple 5-s response files through out the slew time plus single time preiod for the non-slew times, and weighted by the total counts in the corresponding time period using addrmf. An average response file is needed becuase a spectral fit using the pre-slew DRM will introduce some errors in both a spectral shape and a normalization if the PHA file contains a lot of the slew/post-slew time interval.
- 3) For fits to more complicated models (e.g. a power-law over a cutoff power-law), the BAT team has decided to require a chi-square improvement of more than 6 for each extra dof.
Time averaged spectrum fit using the average DRM
Power-law model
Time interval is from    3.192 sec. to  443.004 sec.

Spectral model in power-law:
------------------------------------------------------------
Parameters  : value       lower 90%   higher 90%
Photon index: -1.72987     ( -0.0862003   0.0852865 )
Norm@50keV  : 1.50718E-03    ( -7.47846e-05   7.44157e-05 )
------------------------------------------------------------
#Fit statistic : Chi-Squared =          62.27 using 59 PHA bins.
# Reduced chi-squared =          1.092 for     57 degrees of freedom
# Null hypothesis probability =   2.941778e-01

Photon flux (15-150 keV)    in 439.8 sec: 0.202314 ( -0.009784  0.009801 ) ph/cm2/s
Energy fluence (15-150 keV)             : 6.12483e-06 ( -3.15645e-07  3.17533e-07 ) ergs/cm2
Cutoff power-law model

Time interval is from    3.192 sec. to  443.004 sec.
Spectral model in the cutoff power-law:
------------------------------------------------------------
Parameters  : value       lower 90%   higher 90%
Photon index: -1.33671     ( -0.341355   0.369857 )
Epeak [keV] : 80.7888      ( -19.0374 176.339 )
Norm@50keV  : 2.41114E-03    ( -0.00079076   0.00131065 )
------------------------------------------------------------
#Fit statistic : Chi-Squared =          58.37 using 59 PHA bins.
# Reduced chi-squared =          1.042 for     56 degrees of freedom
# Null hypothesis probability =   3.884842e-01

Photon flux (15-150 keV)    in 439.8 sec: 0.197881 ( -0.010475  0.010483 ) ph/cm2/s
Energy fluence (15-150 keV)             : 5.91597e-06 ( -3.63385e-07  3.63822e-07 ) ergs/cm2
1-s peak spectrum fit
Power-law model
Time interval is from   71.328 sec. to   72.328 sec.

Spectral model in power-law:
------------------------------------------------------------
Parameters  : value       lower 90%   higher 90%
Photon index: -1.5326     ( -0.502925   0.492543 )
Norm@50keV  : 6.72420E-03    ( -0.00179413   0.00172587 )
------------------------------------------------------------
#Fit statistic : Chi-Squared =          59.14 using 59 PHA bins.
# Reduced chi-squared =          1.038 for     57 degrees of freedom
# Null hypothesis probability =   3.973825e-01

Photon flux (15-150 keV)    in 1 sec: 0.847046 ( -0.216642  0.216624 ) ph/cm2/s
Energy fluence (15-150 keV)             : 6.34717e-08 ( -1.81058e-08  1.83183e-08 ) ergs/cm2
Cutoff power-law model
Time interval is from   71.328 sec. to   72.328 sec.
Spectral model in the cutoff power-law:
------------------------------------------------------------
Parameters  : value       lower 90%   higher 90%
Photon index: -2.02284     ( -0.00425729   0.264393 )
Epeak [keV] : 9.25550      (   )
Norm@50keV  : 3.66672E-03    (     )
------------------------------------------------------------
#Fit statistic : Chi-Squared =          58.81 using 59 PHA bins.
# Reduced chi-squared =          1.050 for     56 degrees of freedom
# Null hypothesis probability =   3.728887e-01

Photon flux (15-150 keV)    in 1 sec: 0.860377 ( -0.227966  0.205523 ) ph/cm2/s
Energy fluence (15-150 keV)             : 0 ( 0  0 ) ergs/cm2
Time-resolved spectra
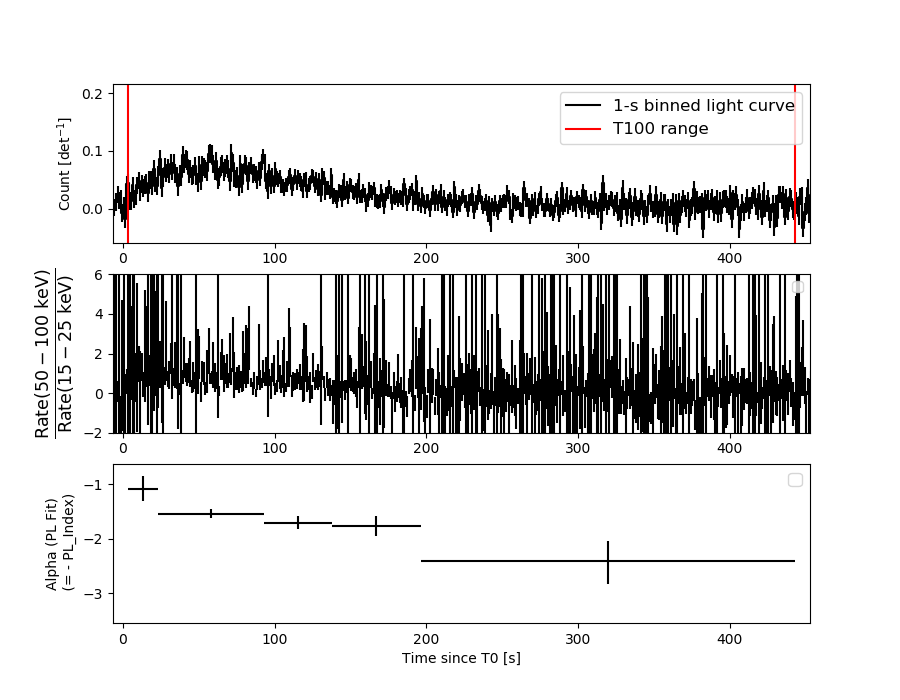
Distribution
T90 vs. Hardness ratio plot
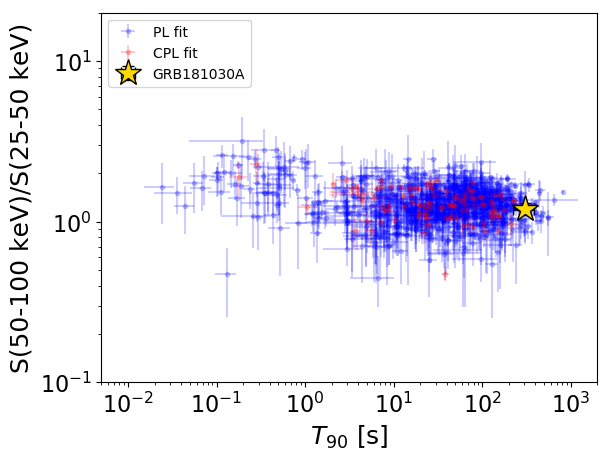
T90                                   = 303.196 sec.
Hardness ratio (energy fluence ratio) = 1.20595153969
S(15-50 keV) vs. S(50-150 keV) plot
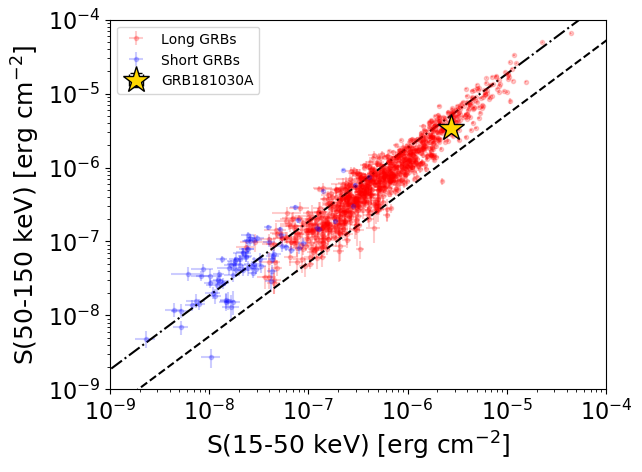
S(15-50 keV)  = 2.728965e-06
S(50-150 keV) = 3.395947e-06
The dash-dotted line and the dashed line traces the fluences calculated from the Band function with Epeak = 15 and 150 keV, respectively. Both lines assume a canonical values of alpha = -1 and beta = -2.5.
Mask shadow pattern
IMX = 7.157760779786505E-01, IMY = 8.133471637255016E-02
Spacecraft aspect plot
Bright source in the pre-burst/pre-slew/post-slew images
Pre-burst image of 15-350 keV band
Time interval of the image:
-217.899400 3.192000

# RAcent  DECcent POSerr Theta    Phi  PeakCts   SNR AngSep     Name
#  [deg]    [deg]    ['] [deg]  [deg]                   [']
276.6990  78.9195    2.8  50.2  143.9   4.6984   4.2 ------	UNKNOWN
116.0699  18.8787    2.6  52.3   30.1   5.0039   4.4 ------	UNKNOWN
258.7231  69.4663    3.0  48.8  157.7   2.6380   3.9 ------	UNKNOWN
213.3669  58.4199    2.1  29.5  175.1   1.4488   5.5 ------	UNKNOWN
173.9646  -3.6066    2.9  47.3  -53.4   4.2038   4.0 ------	UNKNOWN
Pre-slew background subtracted image of 15-350 keV band
Time interval of the image:
3.192000 72.500600

# RAcent  DECcent POSerr Theta    Phi  PeakCts   SNR AngSep     Name
#  [deg]    [deg]    ['] [deg]  [deg]                   [']
115.0992  45.1548    2.7  39.5   62.5   1.6626   4.2 ------	UNKNOWN
146.9164  14.6572    0.4  35.8   -6.5   4.1662  27.1 ------	UNKNOWN
155.5977  23.1686    2.5  24.3  -12.2   0.5632   4.7 ------	UNKNOWN
234.5180  42.4760    2.2  44.9 -161.5   1.3950   5.3 ------	UNKNOWN
225.7346  21.9936    2.1  49.4 -132.3   3.5573   5.5 ------	UNKNOWN
Post-slew image of 15-350 keV band
Time interval of the image:
131.100610 270.700600

# RAcent  DECcent POSerr Theta    Phi  PeakCts   SNR AngSep     Name
#  [deg]    [deg]    ['] [deg]  [deg]                   [']
135.5082 -40.4897    4.7  56.1   -9.2   1.2703   2.5    4.0	Vela X-1
150.2028  69.4639    3.0  54.9  161.7   3.4914   3.8 ------	UNKNOWN
116.7234 -12.1358    2.4  40.2   30.1   1.5178   4.7 ------	UNKNOWN
146.9098  14.6597    0.8   0.0  104.4   2.4472  14.4 ------	UNKNOWN
152.6830 -23.8168    2.7  38.9  -28.1   0.9695   4.3 ------	UNKNOWN