Analysis Summary
Notes:
- 1) No attempt has been made to eliminate the non-significant decimal places.
- 2) This batgrbproduct analysis is done using the HEASARC data.
- 3) This batgrbproduct analysis is using the flight position for the mask-weighting calculation.
======================================================================
                  BAT GRB EVENT DATA PROCESSING REPORT
    Process Script Ver: batgrbproduct v2.46
    Process Start Time: Mon Dec 17 16:03:58 EST 2018
             Host Name: bat1
   Current Working Dir: /local/data/bat1/alien/Swift_3rdBATcatalog/event/batevent_reproc/trigger870201
======================================================================

  Trigger: 00870201      Segment: 000

  BAT Trigger Time: 562911772.288   [s; MET]
      Trigger Stop: 562911774.336   [s; MET]
               UTC: 2018-11-03T04:22:30.430260    [includes UTCF correction]
       Where From?: TDRSS position message

  BAT
    RA: 197.10891460287   Dec: 52.2305069576985  [deg; J2000]

     Catalogged Source?: NO
     Point Source?:      YES
     GRB Indicated?:     YES    [ by BAT flight software ]
     Image S/N Ratio:    7
     Image Trigger?:     NO
     Rate S/N Ratio:     10.770329614269  [ if not an image trigger ]
     Image S/N Ratio:    7

  Analysis Position:   [ source = BAT ]
    RA: 197.10891460287   Dec: 52.2305069576985  [deg; J2000]

  Refined Position:   [ source = BAT pre-slew burst ]
    RA: 197.090349965947   Dec: 52.222041269635  [deg; J2000]
        { 13h 08m 21.7s , +52d 13' 19.3" }
         +/- 1.92698730902695 [arcmin] (estimated 90% radius based on SNR)
         +/- 0.892041234210368 [arcmin] (formal 1-sigma fit error)
    SNR: 11.9164964495664

  Angular difference between the analysis and refined position is 0.850610 arcmin

  Partial Coding Fraction: 0.7890625    [ including projection effects ]

  Duration
     T90: 9.16800010204315 +/- 2.87293578110704
        Measured from: -0.728000044822693
                   to: 8.44000005722046     [s; relative to TRIGTIME]
     T50: 3.48800003528595 +/- 1.34001790374638
        Measured from: 0.407999992370605
                   to: 3.89600002765656     [s; relative to TRIGTIME]


  Fluence
     Peak Flux  (peak 1 second)
        Measured from: -0.388000011444092
                   to: 0.611999988555908     [s; relative to TRIGTIME]
     Total Fluence
        Measured from: -1.22399997711182
                   to: 9.96000003814697     [s; relative to TRIGTIME]

             Band 1     Band 2     Band 3     Band 4
              15-25      25-50     50-100    100-350     keV
 Total     0.222852   0.189819   0.109921   0.058467
           0.025520   0.026439   0.022445   0.019302 [error]
 Peak      0.033007   0.050885   0.018616   0.014112
           0.007796   0.008321   0.007122   0.005728 [error]

     [ fluence units of on-axis counts / fully illuminated detector ]

======================================================================


====== Table of the duration information =============================

        Value   tstart    tstop
T100   11.184   -1.224    9.960
T90     9.168   -0.728    8.440
T50     3.488    0.408    3.896
Peak    1.000   -0.388    0.612


====== Spectral Analysis Summary =====================================

Model      : spectral model: simple power-law (PL) and cutoff power-law (CPL)
Ph_index   : photon index: E^{Ph_index}
Ph_90err   : 90% error of the photon index
Epeak      : Epeak in keV
Epeak_90err: 90% error of Epeak
Norm       : normalization at 50 keV in both the PL model and CPL model
Nomr_90err : 90% error of the normalization
chi2       : Chi-Squared
dof        : degree of freedo

=== Time-averaged spectral analysis ===
(Best model with acceptable fit: PL)

Model Ph_index Ph_90err_low Ph_90err_hi  Epeak  Epeak_90err_low  Epeak_90err_hi  Norm       Nomr_90err_low    Norm_90err_hi    chi2    dof
PL      -1.932    -0.280      0.261       -           -               -         2.77e-03     -5.08e-04          4.89e-04      45.820   57
CPL     -1.945    -0.673      1.007     9999.360      N/A           N/A         2.75e-03        N/A               N/A         45.830   56


=== 1-s peak spectral analysis ===
(Best model with acceptable fit: N/A)

Model Ph_index Ph_90err_low Ph_90err_hi  Epeak  Epeak_90err_low  Epeak_90err_hi  Norm       Nomr_90err_low    Norm_90err_hi    chi2    dof
PL      -1.746     -0.385     0.368       -           -               -         6.30e-03     -1.62e-03          1.57e-03      75.780   57
CPL     -1.352      7.157     1.352       63.187     -36.618       -31.578      1.11e-02     -1.11e-02          4.25e+06      75.580   56


=== Fluence/Peak Flux Summary ===

              Model    Band1     Band2     Band3     Band4     Band5     Total
                       15-25     25-50    50-100    100-350    15-150    15-350    keV
Fluence         PL   5.95e-08  8.41e-08  8.81e-08  1.70e-07  2.85e-07  4.02e-07   erg/cm2
      90%_error_low -1.15e-08 -1.18e-08 -2.16e-08 -7.05e-08 -4.93e-08 -9.71e-08   erg/cm2
      90%_error_hi   1.18e-08  1.17e-08  2.22e-08  9.80e-08  5.08e-08  1.19e-07   erg/cm2
Peak flux       PL   3.28e-01  2.86e-01  1.70e-01  1.53e-01  8.50e-01  9.37e-01   ph/cm2/s
      90%_error_low -1.02e-01 -6.30e-02 -5.46e-02 -7.68e-02 -1.87e-01 -2.11e-01   ph/cm2/s
      90%_error_hi   1.06e-01  6.28e-02  5.58e-02  1.14e-01  1.87e-01  2.13e-01   ph/cm2/s

Fluence        CPL   5.98e-08  8.32e-08  8.84e-08  2.12e-07  2.87e-07  3.96e-07   erg/cm2
      90%_error_low -1.26e-08 -1.77e-08 -2.12e-08 -1.49e-07 -5.09e-08 -1.55e-07   erg/cm2
      90%_error_hi   1.20e-08  1.15e-08  1.21e-08  2.27e-08  3.97e-08  6.51e-08   erg/cm2
Peak flux      CPL   3.25e-01  3.03e-01  1.66e-01  7.75e-02  8.42e-01  8.71e-01   ph/cm2/s
      90%_error_low -1.04e-01 1.06e-02     N/A   -7.75e-02 -2.48e-01 -2.78e-01   ph/cm2/s
      90%_error_hi   1.08e-01  2.21e-01     N/A    1.05e-01  7.18e-02  4.22e-02   ph/cm2/s

======================================================================
Image
Pre-slew 15.0-350.0 keV image (Event data)
#   RAcent    DECcent   POSerr    Theta     Phi              Peak Cts       SNR   Name
  197.0903    52.2220   0.0163    20.7151  -115.2725         0.5594912     11.916 TRIG_00870201

Foreground time interval of the image:
 -1.224   9.960 (delta_t =  11.184 [sec])
Background time interval of the image:
-239.288  -1.224 (delta_t = 238.064 [sec])
Light Curves
Note: The mask-weighted lightcurves have units of either count/det or counts/sec/det, where a det is 0.4 x 0.4 = 0.16 sq cm.
Full-time range; 1 s binning
Other quick-look light curves:
- 64 ms binning (zoomed)
- 16 ms binning (zoomed)
- 8 ms binning (zoomed)
- 2 ms binning (zoomed)
- SN=5 or 10 s binning (full-time range)
- Raw light curve
Spectra
- 64 ms binning (zoomed)
- 16 ms binning (zoomed)
- 8 ms binning (zoomed)
- 2 ms binning (zoomed)
- SN=5 or 10 s binning (full-time range)
- Raw light curve
Spectra
Notes:
- 1) The fitting includes the systematic errors.
- 2) When the burst includes telescope slew time periods, the fitting uses an average response file made from multiple 5-s response files through out the slew time plus single time preiod for the non-slew times, and weighted by the total counts in the corresponding time period using addrmf. An average response file is needed becuase a spectral fit using the pre-slew DRM will introduce some errors in both a spectral shape and a normalization if the PHA file contains a lot of the slew/post-slew time interval.
- 3) For fits to more complicated models (e.g. a power-law over a cutoff power-law), the BAT team has decided to require a chi-square improvement of more than 6 for each extra dof.
Time averaged spectrum fit using the average DRM
Power-law model

Time interval is from   -1.224 sec. to    9.960 sec.

Spectral model in power-law:
------------------------------------------------------------
Parameters  : value       lower 90%   higher 90%
Photon index: -1.93245     ( -0.279787   0.260518 )
Norm@50keV  : 2.77355E-03    ( -0.000507503   0.000489352 )
------------------------------------------------------------
#Fit statistic : Chi-Squared =          45.82 using 59 PHA bins.
# Reduced chi-squared =         0.8039 for     57 degrees of freedom
# Null hypothesis probability =   8.556099e-01

Photon flux (15-150 keV)    in 11.18 sec: 0.403657 ( -0.05575  0.05575 ) ph/cm2/s
Energy fluence (15-150 keV)             : 2.85273e-07 ( -4.92517e-08  5.07905e-08 ) ergs/cm2
Cutoff power-law model
Time interval is from   -1.224 sec. to    9.960 sec.
Spectral model in the cutoff power-law:
------------------------------------------------------------
Parameters  : value       lower 90%   higher 90%
Photon index: -1.94548     ( -0.677016   1.00326 )
Epeak [keV] : 9999.36      (   )
Norm@50keV  : 2.75050E-03    (     )
------------------------------------------------------------
#Fit statistic : Chi-Squared =          45.83 using 59 PHA bins.
# Reduced chi-squared =         0.8183 for     56 degrees of freedom
# Null hypothesis probability =   8.321073e-01

Photon flux (15-150 keV)    in 11.18 sec: 0.404939 ( -0.084865  0.054859 ) ph/cm2/s
Energy fluence (15-150 keV)             : 2.87139e-07 ( -5.08784e-08  3.97208e-08 ) ergs/cm2
1-s peak spectrum fit
Power-law model
Time interval is from   -0.388 sec. to    0.612 sec.

Spectral model in power-law:
------------------------------------------------------------
Parameters  : value       lower 90%   higher 90%
Photon index: -1.74624     ( -0.385386   0.367754 )
Norm@50keV  : 6.29604E-03    ( -0.00161951   0.00157062 )
------------------------------------------------------------
#Fit statistic : Chi-Squared =          75.78 using 59 PHA bins.
# Reduced chi-squared =          1.329 for     57 degrees of freedom
# Null hypothesis probability =   4.879432e-02

Photon flux (15-150 keV)    in 1 sec: 0.850192 ( -0.186793  0.186818 ) ph/cm2/s
Energy fluence (15-150 keV)             : 5.81179e-08 ( -1.50206e-08  1.55656e-08 ) ergs/cm2
Cutoff power-law model
Time interval is from   -0.388 sec. to    0.612 sec.
Spectral model in the cutoff power-law:
------------------------------------------------------------
Parameters  : value       lower 90%   higher 90%
Photon index: 9.98933     ( -4.19105   -9.99613 )
Epeak [keV] : 28.9973      ( -2.43922 2.60064 )
Norm@50keV  : 1.26454E+06    ( -1.28648e+06   2.96301e+06 )
------------------------------------------------------------
#Fit statistic : Chi-Squared =          66.71 using 59 PHA bins.
# Reduced chi-squared =          1.191 for     56 degrees of freedom
# Null hypothesis probability =   1.548034e-01

Photon flux (15-150 keV)    in 1 sec: 0.841800 ( -0.248093  0.071762 ) ph/cm2/s
Energy fluence (15-150 keV)             : 5.46298e-08 ( -2.86438e-08  -1.45782e-08 ) ergs/cm2
Time-resolved spectra
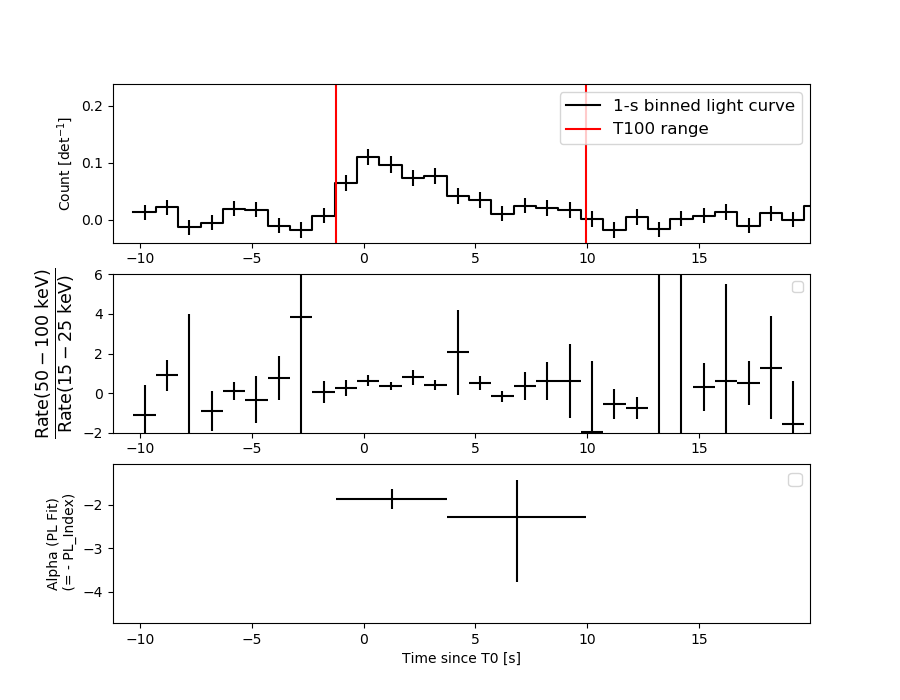
Distribution
T90 vs. Hardness ratio plot
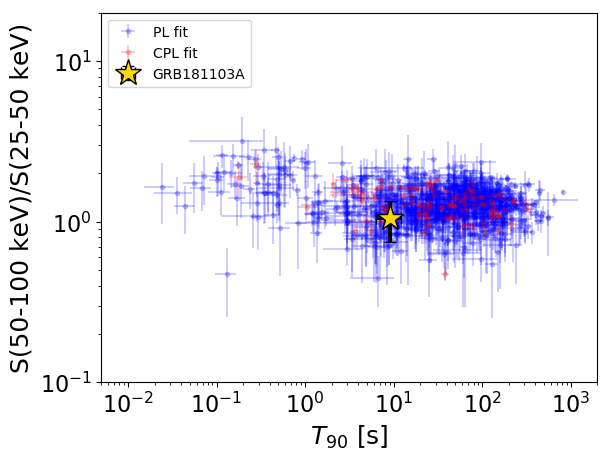
T90                                   = 9.168 sec.
Hardness ratio (energy fluence ratio) = 1.0479727049
S(15-50 keV) vs. S(50-150 keV) plot
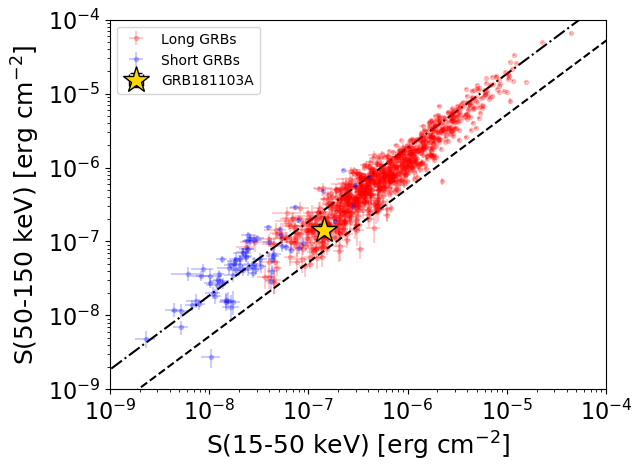
S(15-50 keV)  = 1.4362734e-07
S(50-150 keV) = 1.4164849e-07
The dash-dotted line and the dashed line traces the fluences calculated from the Band function with Epeak = 15 and 150 keV, respectively. Both lines assume a canonical values of alpha = -1 and beta = -2.5.
Mask shadow pattern
IMX = -1.614498973310166E-01, IMY = 3.419747014472937E-01
Spacecraft aspect plot
Bright source in the pre-burst/pre-slew/post-slew images
Pre-burst image of 15-350 keV band
Time interval of the image:
-239.288000 -1.224000

# RAcent  DECcent POSerr Theta    Phi  PeakCts   SNR AngSep     Name
#  [deg]    [deg]    ['] [deg]  [deg]                   [']
316.3782  61.4512    2.9  51.7  148.8   4.8556   4.0 ------	UNKNOWN
111.6910  21.6062    2.5  55.4   16.7   5.6799   4.7 ------	UNKNOWN
275.2316  73.5981    2.9  34.0  160.1   1.3385   4.0 ------	UNKNOWN
188.3190  32.8851    3.1  35.2  -83.5   1.7158   3.7 ------	UNKNOWN
183.5622  24.8661    2.3  42.0  -73.8   4.3727   5.0 ------	UNKNOWN
Pre-slew background subtracted image of 15-350 keV band
Time interval of the image:
-1.224000 9.960000

# RAcent  DECcent POSerr Theta    Phi  PeakCts   SNR AngSep     Name
#  [deg]    [deg]    ['] [deg]  [deg]                   [']
100.2513  31.1626    2.7  51.4   33.5   0.9285   4.2 ------	UNKNOWN
197.0904  52.2220    1.0  20.7 -115.3   0.5594  11.9 ------	UNKNOWN
Post-slew image of 15-350 keV band
Time interval of the image:
74.612600 714.456800
720.712000 782.719300
840.712000 962.746200

# RAcent  DECcent POSerr Theta    Phi  PeakCts   SNR AngSep     Name
#  [deg]    [deg]    ['] [deg]  [deg]                   [']
254.6721  35.4203    6.7  43.5 -158.8   1.9803   1.7   11.5	Her X-1
152.6155   5.2790    2.8  59.5  -13.9  15.1033   4.2 ------	UNKNOWN
156.7522   6.1418    3.2  56.7  -17.6   7.6884   3.6 ------	UNKNOWN
217.4000  24.8942    3.4  31.4 -105.2   3.2515   3.4 ------	UNKNOWN
240.3825  18.0570    2.5  48.0 -129.3  11.2193   4.5 ------	UNKNOWN