Analysis Summary
Notes:
- 1) No attempt has been made to eliminate the non-significant decimal places.
- 2) This batgrbproduct analysis is done using the HEASARC data.
- 3) This batgrbproduct analysis is using the flight position for the mask-weighting calculation.
======================================================================
BAT GRB EVENT DATA PROCESSING REPORT
Process Script Ver: batgrbproduct v2.46
Process Start Time: Mon Dec 17 15:47:45 EST 2018
Host Name: bat1
Current Working Dir: /local/data/bat1/alien/Swift_3rdBATcatalog/event/batevent_reproc/trigger871316
======================================================================
Trigger: 00871316 Segment: 000
BAT Trigger Time: 563532233.216 [s; MET]
Trigger Stop: 563532234.24 [s; MET]
UTC: 2018-11-10T08:43:31.319640 [includes UTCF correction]
Where From?: TDRSS position message
BAT
RA: 302.342535673998 Dec: -36.902699253889 [deg; J2000]
Catalogged Source?: NO
Point Source?: YES
GRB Indicated?: YES [ by BAT flight software ]
Image S/N Ratio: 7.48
Image Trigger?: NO
Rate S/N Ratio: 12.8840987267251 [ if not an image trigger ]
Image S/N Ratio: 7.48
Analysis Position: [ source = BAT ]
RA: 302.342535673998 Dec: -36.902699253889 [deg; J2000]
Refined Position: [ source = BAT pre-slew burst ]
RA: 302.330123559643 Dec: -36.8781732848984 [deg; J2000]
{ 20h 09m 19.2s , -36d 52' 41.4" }
+/- 1.41270866791035 [arcmin] (estimated 90% radius based on SNR)
+/- 0.582905752057834 [arcmin] (formal 1-sigma fit error)
SNR: 18.56767427053
Angular difference between the analysis and refined position is 1.587529 arcmin
Partial Coding Fraction: 1.015625 [ including projection effects ]
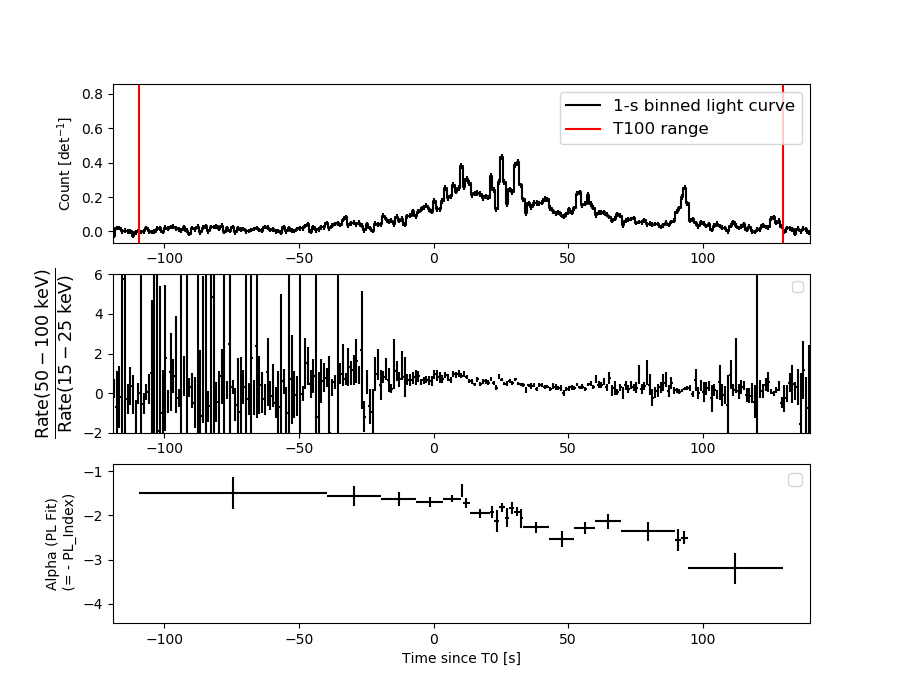
Duration
T90: 138.424000024796 +/- 10.9277832336458
Measured from: -39.2680000066757
to: 99.1560000181198 [s; relative to TRIGTIME]
T50: 47.1999999284744 +/- 1.64099964656047
Measured from: 7.29200005531311
to: 54.4919999837875 [s; relative to TRIGTIME]
Fluence
Peak Flux (peak 1 second)
Measured from: 25.0320000648499
to: 26.0320000648499 [s; relative to TRIGTIME]
Total Fluence
Measured from: -109.304000020027
to: 129.808000087738 [s; relative to TRIGTIME]
Band 1 Band 2 Band 3 Band 4
15-25 25-50 50-100 100-350 keV
Total 7.698149 7.402830 3.795698 0.692785
0.121709 0.121605 0.104181 0.092860 [error]
Peak 0.157004 0.176677 0.100426 0.026498
0.009986 0.010588 0.008450 0.006579 [error]
[ fluence units of on-axis counts / fully illuminated detector ]
======================================================================
====== Table of the duration information =============================
Value tstart tstop
T100 239.112 -109.304 129.808
T90 138.424 -39.268 99.156
T50 47.200 7.292 54.492
Peak 1.000 25.032 26.032
====== Spectral Analysis Summary =====================================
Model : spectral model: simple power-law (PL) and cutoff power-law (CPL)
Ph_index : photon index: E^{Ph_index}
Ph_90err : 90% error of the photon index
Epeak : Epeak in keV
Epeak_90err: 90% error of Epeak
Norm : normalization at 50 keV in both the PL model and CPL model
Nomr_90err : 90% error of the normalization
chi2 : Chi-Squared
dof : degree of freedo
=== Time-averaged spectral analysis ===
(Best model with acceptable fit: PL)
Model Ph_index Ph_90err_low Ph_90err_hi Epeak Epeak_90err_low Epeak_90err_hi Norm Nomr_90err_low Norm_90err_hi chi2 dof
PL -2.023 -0.054 0.054 - - - 4.45e-03 -1.20e-04 1.19e-04 66.300 57
CPL -1.908 -0.216 0.228 39.229 -34.736 -39.229 5.07e-03 -1.08e-03 1.48e-03 65.500 56
=== 1-s peak spectral analysis ===
(Best model with acceptable fit: PL)
Model Ph_index Ph_90err_low Ph_90err_hi Epeak Epeak_90err_low Epeak_90err_hi Norm Nomr_90err_low Norm_90err_hi chi2 dof
PL -1.852 -0.126 0.123 - - - 2.60e-02 -2.05e-03 2.02e-03 33.480 57
CPL -1.473 -0.452 0.549 62.245 -17.048 -62.245 4.20e-02 -1.76e-02 4.16e-02 31.730 56
=== Fluence/Peak Flux Summary ===
Model Band1 Band2 Band3 Band4 Band5 Total
15-25 25-50 50-100 100-350 15-150 15-350 keV
Fluence PL 2.22e-06 2.98e-06 2.93e-06 5.18e-06 9.82e-06 1.33e-05 erg/cm2
90%_error_low -1.07e-07 -7.90e-08 -1.11e-07 -4.27e-07 -2.53e-07 -5.00e-07 erg/cm2
90%_error_hi 1.09e-07 7.89e-08 1.11e-07 4.54e-07 2.53e-07 5.17e-07 erg/cm2
Peak flux PL 1.50e+00 1.23e+00 6.80e-01 5.54e-01 3.65e+00 3.96e+00 ph/cm2/s
90%_error_low -1.57e-01 -8.40e-02 -7.01e-02 -1.05e-01 -2.52e-01 -2.70e-01 ph/cm2/s
90%_error_hi 1.61e-01 8.40e-02 7.02e-02 1.19e-01 2.52e-01 2.70e-01 ph/cm2/s
Fluence CPL 2.17e-06 3.00e-06 2.94e-06 4.34e-06 9.71e-06 1.24e-05 erg/cm2
90%_error_low -1.42e-07 -8.77e-08 -1.13e-07 -1.20e-06 -3.33e-07 -1.28e-06 erg/cm2
90%_error_hi 1.12e-07 8.82e-08 1.13e-07 1.09e-06 3.32e-07 1.78e-06 erg/cm2
Peak flux CPL 1.43e+00 1.28e+00 6.87e-01 3.38e-01 3.60e+00 3.74e+00 ph/cm2/s
90%_error_low -1.82e-01 -1.07e-01 -7.45e-02 -1.58e-01 -2.63e-01 -3.18e-01 ph/cm2/s
90%_error_hi 1.83e-01 1.10e-01 7.49e-02 2.57e-01 2.62e-01 3.87e-01 ph/cm2/s
======================================================================
Image
Pre-slew 15.0-350.0 keV image (Event data)
#   RAcent    DECcent   POSerr    Theta     Phi              Peak Cts       SNR   Name
  302.3301   -36.8782   0.0104    11.0722   165.6238         8.1671786     18.568 TRIG_00871316

Foreground time interval of the image:
-109.304  17.685 (delta_t = 126.989 [sec])
Background time interval of the image:
-130.315 -109.304 (delta_t =  21.011 [sec])
Light Curves
Note: The mask-weighted lightcurves have units of either count/det or counts/sec/det, where a det is 0.4 x 0.4 = 0.16 sq cm.
Full-time range; 1 s binning
Other quick-look light curves:
- 64 ms binning (zoomed)
- 16 ms binning (zoomed)
- 8 ms binning (zoomed)
- 2 ms binning (zoomed)
- SN=5 or 10 s binning (full-time range)
- Raw light curve
Spectra
- 64 ms binning (zoomed)
- 16 ms binning (zoomed)
- 8 ms binning (zoomed)
- 2 ms binning (zoomed)
- SN=5 or 10 s binning (full-time range)
- Raw light curve
Spectra
Notes:
- 1) The fitting includes the systematic errors.
- 2) When the burst includes telescope slew time periods, the fitting uses an average response file made from multiple 5-s response files through out the slew time plus single time preiod for the non-slew times, and weighted by the total counts in the corresponding time period using addrmf. An average response file is needed becuase a spectral fit using the pre-slew DRM will introduce some errors in both a spectral shape and a normalization if the PHA file contains a lot of the slew/post-slew time interval.
- 3) For fits to more complicated models (e.g. a power-law over a cutoff power-law), the BAT team has decided to require a chi-square improvement of more than 6 for each extra dof.
Time averaged spectrum fit using the average DRM
Power-law model
Time interval is from -109.304 sec. to  129.808 sec.

Spectral model in power-law:
------------------------------------------------------------
Parameters  : value       lower 90%   higher 90%
Photon index: -2.02269     ( -0.0544884   0.054072 )
Norm@50keV  : 4.44827E-03    ( -0.000119611   0.000118999 )
------------------------------------------------------------
#Fit statistic : Chi-Squared =          66.30 using 59 PHA bins.
# Reduced chi-squared =          1.163 for     57 degrees of freedom
# Null hypothesis probability =   1.868445e-01

Photon flux (15-150 keV)    in 239.1 sec: 0.674351 ( -0.019752  0.019883 ) ph/cm2/s
Energy fluence (15-150 keV)             : 9.8229e-06 ( -2.52729e-07  2.52903e-07 ) ergs/cm2
Cutoff power-law model
Time interval is from -109.304 sec. to  129.808 sec.
Spectral model in the cutoff power-law:
------------------------------------------------------------
Parameters  : value       lower 90%   higher 90%
Photon index: -1.90776     ( -0.215776   0.2279 )
Epeak [keV] : 39.2291      ( -34.736 -39.2293 )
Norm@50keV  : 5.07392E-03    ( -0.00107932   0.00147684 )
------------------------------------------------------------
#Fit statistic : Chi-Squared =          65.50 using 59 PHA bins.
# Reduced chi-squared =          1.170 for     56 degrees of freedom
# Null hypothesis probability =   1.803828e-01

Photon flux (15-150 keV)    in 239.1 sec: 0.666671 ( -0.024199  0.023043 ) ph/cm2/s
Energy fluence (15-150 keV)             : 9.70598e-06 ( -3.33174e-07  3.31847e-07 ) ergs/cm2
1-s peak spectrum fit
Power-law model
Time interval is from   25.032 sec. to   26.032 sec.

Spectral model in power-law:
------------------------------------------------------------
Parameters  : value       lower 90%   higher 90%
Photon index: -1.85221     ( -0.126398   0.123132 )
Norm@50keV  : 2.59709E-02    ( -0.00204714   0.00202081 )
------------------------------------------------------------
#Fit statistic : Chi-Squared =          33.48 using 59 PHA bins.
# Reduced chi-squared =         0.5873 for     57 degrees of freedom
# Null hypothesis probability =   9.945364e-01

Photon flux (15-150 keV)    in 1 sec: 3.65397 ( -0.25182  0.25199 ) ph/cm2/s
Energy fluence (15-150 keV)             : 2.38831e-07 ( -1.87716e-08  1.89613e-08 ) ergs/cm2
Cutoff power-law model
Time interval is from   25.032 sec. to   26.032 sec.
Spectral model in the cutoff power-law:
------------------------------------------------------------
Parameters  : value       lower 90%   higher 90%
Photon index: -1.47332     ( -0.451737   0.548919 )
Epeak [keV] : 62.2446      ( -17.0483 -62.2447 )
Norm@50keV  : 4.20129E-02    ( -0.0175822   0.0416273 )
------------------------------------------------------------
#Fit statistic : Chi-Squared =          31.73 using 59 PHA bins.
# Reduced chi-squared =         0.5667 for     56 degrees of freedom
# Null hypothesis probability =   9.963205e-01

Photon flux (15-150 keV)    in 1 sec: 3.59661 ( -0.26263  0.26219 ) ph/cm2/s
Energy fluence (15-150 keV)             : 0 ( 0  0 ) ergs/cm2
Time-resolved spectra
Distribution
T90 vs. Hardness ratio plot
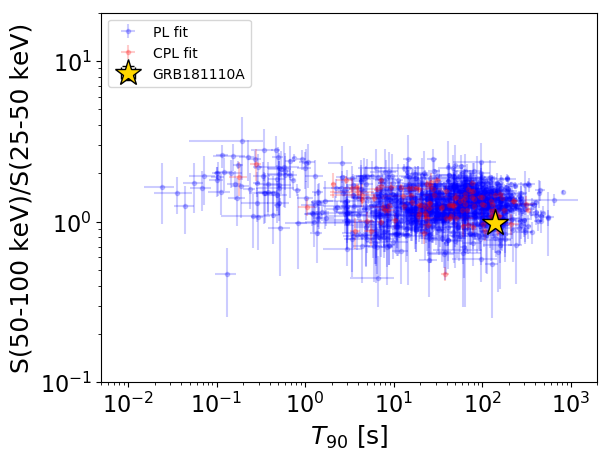
T90                                   = 138.424 sec.
Hardness ratio (energy fluence ratio) = 0.984441855863
S(15-50 keV) vs. S(50-150 keV) plot
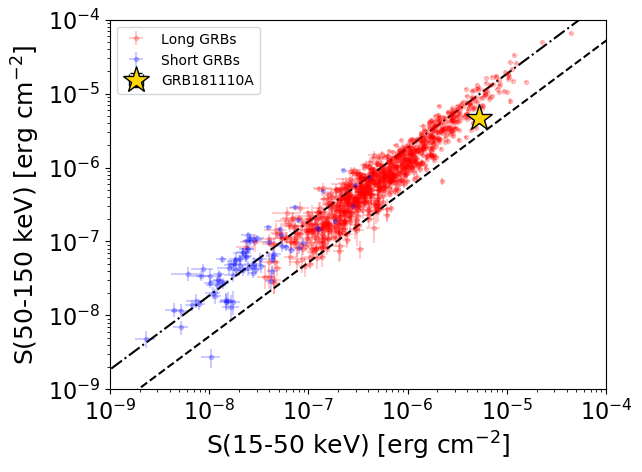
S(15-50 keV)  = 5.200139e-06
S(50-150 keV) = 4.622633e-06
The dash-dotted line and the dashed line traces the fluences calculated from the Band function with Epeak = 15 and 150 keV, respectively. Both lines assume a canonical values of alpha = -1 and beta = -2.5.
Mask shadow pattern
IMX = -1.895602209165389E-01, IMY = -4.858698402020623E-02
Spacecraft aspect plot
Bright source in the pre-burst/pre-slew/post-slew images
Pre-burst image of 15-350 keV band
Time interval of the image:
-130.315400 -109.304000

# RAcent  DECcent POSerr Theta    Phi  PeakCts   SNR AngSep     Name
#  [deg]    [deg]    ['] [deg]  [deg]                   [']
256.1609 -37.9476    7.0  34.9 -105.0   0.2094   1.6   10.3	4U 1700-377
256.2557 -36.3765   10.1  34.7 -102.3  -0.1471  -1.1    9.1	GX 349+2
262.8461 -24.8759   42.9  29.8  -80.0   0.0278   0.3   11.8	GX 1+4
264.5990 -44.2962    9.0  30.4 -119.4  -0.1150  -1.3   11.1	4U 1735-44
268.4987  -1.5291    3.5  36.8  -37.3   0.3044   3.3    9.1	SW J1753.5-0127
270.2273 -25.0574    5.4  23.2  -77.4   0.1658   2.2    3.4	GX 5-1
270.1941 -25.6791    2.9  23.1  -79.0   0.3271   4.2    7.0	GRS 1758-258
274.1469 -13.8733    0.0  24.3  -48.1  -0.0455  -0.7   12.8	GX 17+2
275.7491 -30.3422    7.6  18.0  -91.7  -0.1138  -1.5    9.2	H1820-303
285.1399 -25.0507   16.3  10.0  -66.9  -0.0450  -0.7    9.6	HT1900.1-2455
288.7867  10.9790    6.0  38.8    1.8   0.1877   1.9    2.1	GRS 1915+105
263.0129 -33.8213    5.0  29.0  -98.2   0.2180   2.3    1.4	GX 354-0
299.5338 -80.5626    2.2  53.4 -167.6   1.0315   5.1 ------	UNKNOWN
270.3466   5.1105    2.0  40.7  -28.2   0.5508   5.9 ------	UNKNOWN
263.6340  -3.4724    1.9  38.9  -45.0   0.6495   6.0 ------	UNKNOWN
Pre-slew background subtracted image of 15-350 keV band
Time interval of the image:
-109.304000 17.684600

# RAcent  DECcent POSerr Theta    Phi  PeakCts   SNR AngSep     Name
#  [deg]    [deg]    ['] [deg]  [deg]                   [']
256.1604 -37.9511    6.5  34.9 -105.0  -1.5070  -1.8   10.4	4U 1700-377
256.2548 -36.3833   13.5  34.7 -102.3   0.7233   0.9    9.0	GX 349+2
263.1725 -24.7690    5.7  29.5  -79.7   1.3178   2.0    9.0	GX 1+4
264.6771 -44.5789    9.3  30.4 -120.0   0.7083   1.2    8.2	4U 1735-44
268.4759  -1.5127    3.4  36.8  -37.3  -2.1137  -3.4    7.4	SW J1753.5-0127
270.1195 -25.1138    7.4  23.3  -77.6  -0.8018  -1.6    9.2	GX 5-1
270.2172 -25.6641    3.8  23.1  -79.0  -1.6655  -3.2    6.6	GRS 1758-258
274.1059 -13.9499    4.2  24.3  -48.3   1.2791   2.8    7.8	GX 17+2
275.8757 -30.3390    4.6  17.9  -91.8   1.1974   2.5    3.1	H1820-303
285.1287 -24.9361   13.0  10.0  -66.2   0.3843   0.9    5.1	HT1900.1-2455
288.6800  10.9292    7.1  38.8    1.6   1.0494   1.6    7.0	GRS 1915+105
262.9544 -33.8937    7.0  29.1  -98.4  -1.0475  -1.6    3.9	GX 354-0
317.7715 -49.4572    2.0  27.9  162.0   2.8838   5.7 ------	UNKNOWN
302.3301 -36.8782    0.6  11.1  165.6   8.1669  18.6 ------	UNKNOWN
Post-slew image of 15-350 keV band
Time interval of the image:
52.884600 962.844000

# RAcent  DECcent POSerr Theta    Phi  PeakCts   SNR AngSep     Name
#  [deg]    [deg]    ['] [deg]  [deg]                   [']
255.8688 -37.6679    0.0  36.6  -99.0   4.1619   2.4   12.0	4U 1700-377
256.2181 -36.4636   10.9  36.6  -97.0  -1.8735  -1.1   10.8	GX 349+2
263.1492 -24.6435   69.4  35.5  -74.5  -0.2420  -0.2    9.8	GX 1+4
264.9016 -44.4207   16.2  29.1 -110.1   0.6936   0.7    7.0	4U 1735-44
268.2265  -1.4856   34.8  47.4  -43.0   0.7135   0.3    8.7	SW J1753.5-0127
270.2494 -25.0640    1.9  29.8  -69.1   5.9300   6.1    2.1	GX 5-1
270.1596 -25.8221    7.8  29.5  -70.5   1.4227   1.5    9.1	GRS 1758-258
274.0449 -14.0917    4.9  34.0  -48.7   2.2972   2.3    4.0	GX 17+2
275.9499 -30.5097   11.9  22.8  -74.8   0.8117   1.0    8.7	H1820-303
285.1456 -25.0671    8.4  18.8  -49.3  -1.0879  -1.4   10.6	HT1900.1-2455
288.8288  10.9485    3.7  49.5  -10.9   4.5525   3.1    1.8	GRS 1915+105
262.9484 -33.7243    4.4  32.1  -89.6   3.0614   2.6    6.9	GX 354-0
334.2705  -8.6707    4.5  40.4   60.5   7.9028   2.6 ------	UNKNOWN
302.3189 -36.8935    1.7   0.0  -95.5   4.8455   6.7 ------	UNKNOWN
151.0936 -85.0181    2.7  57.5 -170.5  17.9819   4.4 ------	UNKNOWN
229.8507 -59.3939    3.6  50.3 -134.2  11.2915   3.2 ------	UNKNOWN