Analysis Summary
Notes:
- 1) No attempt has been made to eliminate the non-significant decimal places.
- 2) This batgrbproduct analysis is done using the HEASARC data.
- 3) This batgrbproduct analysis is using the flight position for the mask-weighting calculation.
======================================================================
                  BAT GRB EVENT DATA PROCESSING REPORT
    Process Script Ver: batgrbproduct v2.46
    Process Start Time: Mon Dec 17 15:09:08 EST 2018
             Host Name: bat1
   Current Working Dir: /local/data/bat1/alien/Swift_3rdBATcatalog/event/batevent_reproc/trigger873433
======================================================================

  Trigger: 00873433      Segment: 000

  BAT Trigger Time: 564828901.888   [s; MET]
      Trigger Stop: 564828902.912   [s; MET]
               UTC: 2018-11-25T08:54:39.910800    [includes UTCF correction]
       Where From?: TDRSS position message

  BAT
    RA: 268.412921582668   Dec: -2.61324691311512  [deg; J2000]

     Catalogged Source?: NO
     Point Source?:      YES
     GRB Indicated?:     YES    [ by BAT flight software ]
     Image S/N Ratio:    8.18
     Image Trigger?:     NO
     Rate S/N Ratio:     12.2882057274445  [ if not an image trigger ]
     Image S/N Ratio:    8.18

  Analysis Position:   [ source = BAT ]
    RA: 268.412921582668   Dec: -2.61324691311512  [deg; J2000]

  Refined Position:   [ source = BAT pre-slew burst ]
    RA: 268.392374393739   Dec: -2.63433922465096  [deg; J2000]
        { 17h 53m 34.2s , -02d 38' 03.6" }
         +/- 2.2167643405626 [arcmin] (estimated 90% radius based on SNR)
         +/- 0.934868610086708 [arcmin] (formal 1-sigma fit error)
    SNR: 9.7551363025335

  Angular difference between the analysis and refined position is 1.765864 arcmin

  Partial Coding Fraction: 0.6953125    [ including projection effects ]

  Duration
     T90: 10.5119999647141 +/- 4.7872497517333
        Measured from: 0.0720000267028809
                   to: 10.5839999914169     [s; relative to TRIGTIME]
     T50: 3.19199991226196 +/- 2.03750835430094
        Measured from: 0.740000009536743
                   to: 3.93199992179871     [s; relative to TRIGTIME]


  Fluence
     Peak Flux  (peak 1 second)
        Measured from: 0.240000009536743
                   to: 1.24000000953674     [s; relative to TRIGTIME]
     Total Fluence
        Measured from: -0.180000066757202
                   to: 11.2400000095367     [s; relative to TRIGTIME]

             Band 1     Band 2     Band 3     Band 4
              15-25      25-50     50-100    100-350     keV
 Total     0.147171   0.203855   0.176195   0.018709
           0.032491   0.032237   0.027307   0.023587 [error]
 Peak      0.053621   0.077098   0.047314   0.018500
           0.010325   0.010800   0.009226   0.007174 [error]

     [ fluence units of on-axis counts / fully illuminated detector ]

======================================================================


====== Table of the duration information =============================

        Value   tstart    tstop
T100   11.420   -0.180   11.240
T90    10.512    0.072   10.584
T50     3.192    0.740    3.932
Peak    1.000    0.240    1.240


====== Spectral Analysis Summary =====================================

Model      : spectral model: simple power-law (PL) and cutoff power-law (CPL)
Ph_index   : photon index: E^{Ph_index}
Ph_90err   : 90% error of the photon index
Epeak      : Epeak in keV
Epeak_90err: 90% error of Epeak
Norm       : normalization at 50 keV in both the PL model and CPL model
Nomr_90err : 90% error of the normalization
chi2       : Chi-Squared
dof        : degree of freedo

=== Time-averaged spectral analysis ===
(Best model with acceptable fit: N/A)

Model Ph_index Ph_90err_low Ph_90err_hi  Epeak  Epeak_90err_low  Epeak_90err_hi  Norm       Nomr_90err_low    Norm_90err_hi    chi2    dof
PL      -1.555    -0.309      0.298       -           -               -         3.07e-03     -5.52e-04          5.43e-04      99.510   57
CPL     -0.847    -0.649      1.597       83.727     -30.090       -83.727      6.84e-03     -4.21e-03          3.01e-02      98.550   56


=== 1-s peak spectral analysis ===
(Best model with acceptable fit: N/A)

Model Ph_index Ph_90err_low Ph_90err_hi  Epeak  Epeak_90err_low  Epeak_90err_hi  Norm       Nomr_90err_low    Norm_90err_hi    chi2    dof
PL      -1.749     -0.327     0.307       -           -               -         1.11e-02     -2.20e-03          2.12e-03      72.200   57
CPL     -1.756     -0.322     0.316     9999.360    -9999.350      -9999.360      1.11e-02     -6.92e-03          3.76e-02      72.210   56


=== Fluence/Peak Flux Summary ===

              Model    Band1     Band2     Band3     Band4     Band5     Total
                       15-25     25-50    50-100    100-350    15-150    15-350    keV
Fluence         PL   4.71e-08  8.37e-08  1.14e-07  3.20e-07  3.30e-07  5.65e-07   erg/cm2
      90%_error_low -1.28e-08 -1.47e-08 -2.69e-08 -1.35e-07 -6.36e-08 -1.62e-07   erg/cm2
      90%_error_hi   1.37e-08  1.46e-08  2.67e-08  1.87e-07  6.48e-08  2.04e-07   erg/cm2
Peak flux       PL   5.81e-01  5.04e-01  3.00e-01  2.68e-01  1.50e+00  1.65e+00   ph/cm2/s
      90%_error_low -1.48e-01 -8.52e-02 -7.74e-02 -1.16e-01 -2.53e-01 -2.82e-01   ph/cm2/s
      90%_error_hi   1.57e-01  8.50e-02  7.72e-02  1.59e-01  2.53e-01  2.85e-01   ph/cm2/s

Fluence        CPL   4.12e-08  8.92e-08  1.20e-07  1.32e-07  3.16e-07  3.83e-07   erg/cm2
      90%_error_low -1.69e-08 -1.75e-08 -2.97e-08 -9.63e-08 -6.59e-08 -1.20e-07   erg/cm2
      90%_error_hi   1.69e-08  1.83e-08  3.11e-08  3.07e-07  6.87e-08  2.54e-07   erg/cm2
Peak flux      CPL   5.64e-01  3.86e-01  1.81e-01  1.42e-01  1.19e+00  1.25e+00   ph/cm2/s
      90%_error_low -1.92e-01 -1.32e-01 -6.93e-02     N/A   -4.09e-01 -4.29e-01   ph/cm2/s
      90%_error_hi   2.00e-01  1.93e-01  8.45e-02     N/A    3.93e-01  4.34e-01   ph/cm2/s

======================================================================
Image
Pre-slew 15.0-350.0 keV image (Event data)
#   RAcent    DECcent   POSerr    Theta     Phi              Peak Cts       SNR   Name
  268.3924    -2.6343   0.0197    23.9308   -63.1154         0.6314978      9.755 TRIG_00873433

Foreground time interval of the image:
 -0.180  11.240 (delta_t =  11.420 [sec])
Background time interval of the image:
-38.787  -0.180 (delta_t =  38.607 [sec])
Light Curves
Note: The mask-weighted lightcurves have units of either count/det or counts/sec/det, where a det is 0.4 x 0.4 = 0.16 sq cm.
Full-time range; 1 s binning
Other quick-look light curves:
- 64 ms binning (zoomed)
- 16 ms binning (zoomed)
- 8 ms binning (zoomed)
- 2 ms binning (zoomed)
- SN=5 or 10 s binning (full-time range)
- Raw light curve
Spectra
- 64 ms binning (zoomed)
- 16 ms binning (zoomed)
- 8 ms binning (zoomed)
- 2 ms binning (zoomed)
- SN=5 or 10 s binning (full-time range)
- Raw light curve
Spectra
Notes:
- 1) The fitting includes the systematic errors.
- 2) When the burst includes telescope slew time periods, the fitting uses an average response file made from multiple 5-s response files through out the slew time plus single time preiod for the non-slew times, and weighted by the total counts in the corresponding time period using addrmf. An average response file is needed becuase a spectral fit using the pre-slew DRM will introduce some errors in both a spectral shape and a normalization if the PHA file contains a lot of the slew/post-slew time interval.
- 3) For fits to more complicated models (e.g. a power-law over a cutoff power-law), the BAT team has decided to require a chi-square improvement of more than 6 for each extra dof.
Time averaged spectrum fit using the average DRM
Power-law model
Time interval is from   -0.180 sec. to   11.240 sec.

Spectral model in power-law:
------------------------------------------------------------
Parameters  : value       lower 90%   higher 90%
Photon index: -1.55508     ( -0.308539   0.298234 )
Norm@50keV  : 3.06694E-03    ( -0.000551537   0.000543242 )
------------------------------------------------------------
#Fit statistic : Chi-Squared =          99.51 using 59 PHA bins.
# Reduced chi-squared =          1.746 for     57 degrees of freedom
# Null hypothesis probability =   4.225498e-04

Photon flux (15-150 keV)    in 11.42 sec: 0.388841 ( -0.067075  0.067216 ) ph/cm2/s
Energy fluence (15-150 keV)             : 3.29531e-07 ( -6.36262e-08  6.47957e-08 ) ergs/cm2
Cutoff power-law model
Time interval is from   -0.180 sec. to   11.240 sec.
Spectral model in the cutoff power-law:
------------------------------------------------------------
Parameters  : value       lower 90%   higher 90%
Photon index: -0.846828     ( -0.649463   1.59685 )
Epeak [keV] : 83.7274      ( -30.1286 -83.7661 )
Norm@50keV  : 6.83839E-03    ( -0.00421199   0.0300567 )
------------------------------------------------------------
#Fit statistic : Chi-Squared =          98.55 using 59 PHA bins.
# Reduced chi-squared =          1.760 for     56 degrees of freedom
# Null hypothesis probability =   3.883166e-04

Photon flux (15-150 keV)    in 11.42 sec: 0.375825 ( -0.071857  0.071 ) ph/cm2/s
Energy fluence (15-150 keV)             : 3.1568e-07 ( -6.5912e-08  6.87051e-08 ) ergs/cm2
1-s peak spectrum fit
Power-law model
Time interval is from    0.240 sec. to    1.240 sec.

Spectral model in power-law:
------------------------------------------------------------
Parameters  : value       lower 90%   higher 90%
Photon index: -1.74948     ( -0.32737   0.306969 )
Norm@50keV  : 1.11014E-02    ( -0.00220299   0.00212205 )
------------------------------------------------------------
#Fit statistic : Chi-Squared =          72.20 using 59 PHA bins.
# Reduced chi-squared =          1.267 for     57 degrees of freedom
# Null hypothesis probability =   8.452847e-02

Photon flux (15-150 keV)    in 1 sec: 1.50088 ( -0.25269  0.25283 ) ph/cm2/s
Energy fluence (15-150 keV)             : 1.02457e-07 ( -2.05653e-08  2.11036e-08 ) ergs/cm2
Cutoff power-law model

Time interval is from    0.240 sec. to    1.240 sec.
Spectral model in the cutoff power-law:
------------------------------------------------------------
Parameters  : value       lower 90%   higher 90%
Photon index: -1.75571     ( -0.324195   0.313538 )
Epeak [keV] : 9999.36      ( -9999.35 -9999.36 )
Norm@50keV  : 1.10721E-02    ( -0.00694804   0.0376146 )
------------------------------------------------------------
#Fit statistic : Chi-Squared =          72.21 using 59 PHA bins.
# Reduced chi-squared =          1.289 for     56 degrees of freedom
# Null hypothesis probability =   7.131080e-02

Photon flux (15-150 keV)    in 1 sec: 1.19217 ( -0.408755  0.39326 ) ph/cm2/s
Energy fluence (15-150 keV)             : 1.03055e-07 ( -2.41708e-08  1.62916e-08 ) ergs/cm2
Time-resolved spectra
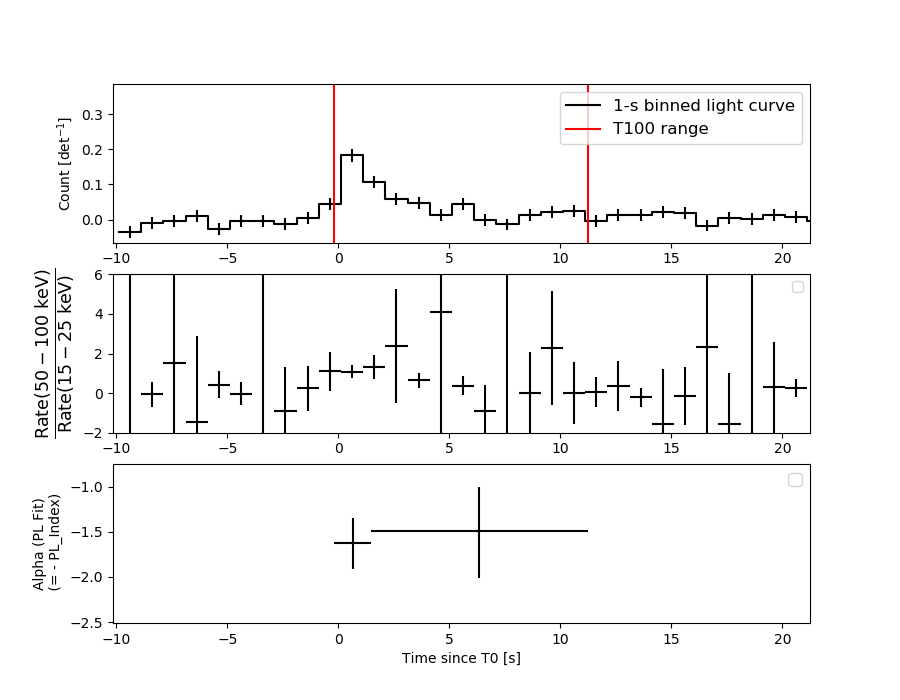
Distribution
T90 vs. Hardness ratio plot
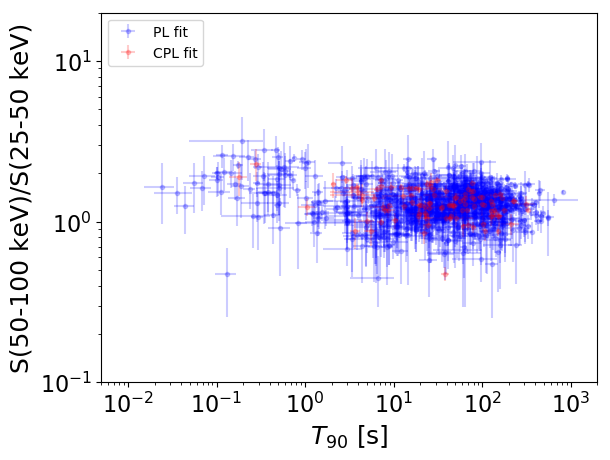
T90                                   = N/A sec.
Hardness ratio (energy fluence ratio) = N/A
S(15-50 keV) vs. S(50-150 keV) plot
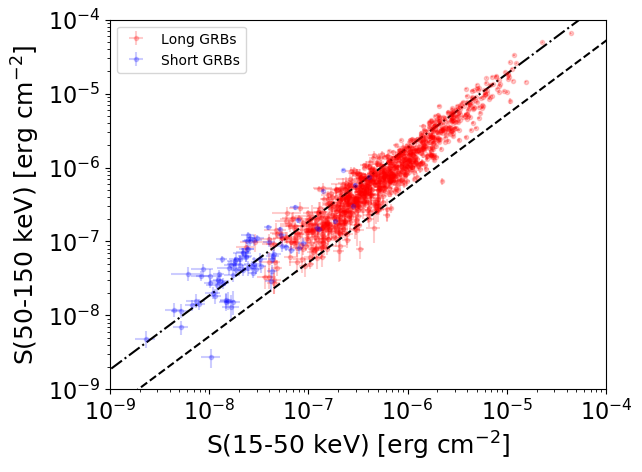
S(15-50 keV)  = N/A
S(50-150 keV) = N/A
The dash-dotted line and the dashed line traces the fluences calculated from the Band function with Epeak = 15 and 150 keV, respectively. Both lines assume a canonical values of alpha = -1 and beta = -2.5.
Mask shadow pattern
IMX = 2.006762960250901E-01, IMY = 3.958181450901550E-01
Spacecraft aspect plot
Bright source in the pre-burst/pre-slew/post-slew images
Pre-burst image of 15-350 keV band
Time interval of the image:
-38.787400 -0.180000

# RAcent  DECcent POSerr Theta    Phi  PeakCts   SNR AngSep     Name
#  [deg]    [deg]    ['] [deg]  [deg]                   [']
254.4289  35.3454    5.5  57.3  -25.6   1.0240   2.1    1.4	Her X-1
255.9316 -37.9026    1.9  42.0 -127.2   1.2196   6.3    4.4	4U 1700-377
256.3226 -36.5329   10.9  41.0 -125.6   0.2036   1.1    8.5	GX 349+2
262.8443 -24.7170    4.4  30.6 -112.0  -0.3670  -2.6    9.1	GX 1+4
264.7399 -44.5191    5.2  41.2 -141.2  -0.3608  -2.2    4.1	4U 1735-44
268.3646  -1.5952    7.6  24.3  -60.8  -0.1672  -1.5    8.6	SW J1753.5-0127
270.4623 -25.2162    0.0  24.8 -120.0   0.1538   1.4   12.7	GX 5-1
270.1574 -25.8842    4.8  25.4 -121.0   0.2615   2.4   11.5	GRS 1758-258
273.9391 -13.8992   16.0  17.3  -94.0   0.0684   0.7    9.1	GX 17+2
276.0964 -30.5064   33.4  24.7 -137.5   0.0335   0.3   12.2	H1820-303
285.2214 -25.0494    0.0  15.9 -149.8   0.1549   1.7   12.7	HT1900.1-2455
288.8096  10.7953    6.7  21.2    3.3   0.1526   1.7    9.0	GRS 1915+105
299.6561  35.1490    2.5  46.1   19.5   0.9438   4.6    4.5	Cyg X-1
307.9789  40.9235    3.0  53.5   25.6   1.9219   3.8    6.2	Cyg X-3
263.1527 -33.7618   23.6  34.9 -126.9  -0.0685  -0.5    9.3	GX 354-0
301.2112  30.3873    2.5  41.7   22.9   0.7841   4.6 ------	UNKNOWN
287.9171  26.1494    2.8  36.5    4.9   0.4999   4.1 ------	UNKNOWN
Pre-slew background subtracted image of 15-350 keV band
Time interval of the image:
-0.180000 11.240000

# RAcent  DECcent POSerr Theta    Phi  PeakCts   SNR AngSep     Name
#  [deg]    [deg]    ['] [deg]  [deg]                   [']
254.3725  35.2988    4.9  57.3  -25.7  -0.6709  -2.4    4.9	Her X-1
255.8417 -37.9468    3.6  42.1 -127.2  -0.3996  -3.2    9.2	4U 1700-377
256.2683 -36.5231    0.0  41.1 -125.6  -0.1885  -1.6   10.1	GX 349+2
262.8398 -24.6584    3.3  30.6 -111.9   0.2755   3.5   10.6	GX 1+4
264.8270 -44.4907    5.7  41.1 -141.2   0.1997   2.0    4.4	4U 1735-44
268.2144  -1.3374    5.3  24.6  -60.3   0.1441   2.2   11.5	SW J1753.5-0127
270.1063 -24.9423    0.0  24.9 -119.1  -0.0521  -0.8   12.7	GX 5-1
270.1390 -25.7415    6.0  25.3 -120.7   0.1257   1.9    8.8	GRS 1758-258
274.1429 -13.8781    0.0  17.1  -94.1  -0.1378  -2.4   12.4	GX 17+2
276.0885 -30.3437    8.0  24.6 -137.2   0.0863   1.4    8.6	H1820-303
284.8722 -24.9148   28.4  15.9 -148.5  -0.0210  -0.4    8.9	HT1900.1-2455
288.7331  11.0853    4.5  21.5    3.2   0.1460   2.6    9.2	GRS 1915+105
299.7752  35.0640   89.4  46.0   19.6  -0.0158  -0.1   12.3	Cyg X-1
307.9968  40.8822    6.1  53.4   25.6  -0.5326  -1.9    6.7	Cyg X-3
262.9765 -33.8177  157.3  35.0 -126.8  -0.0065  -0.1    1.2	GX 354-0
268.3924  -2.6343    1.2  23.9  -63.1   0.6315   9.7 ------	UNKNOWN
Post-slew image of 15-350 keV band
Time interval of the image:
730.212600 962.257700

# RAcent  DECcent POSerr Theta    Phi  PeakCts   SNR AngSep     Name
#  [deg]    [deg]    ['] [deg]  [deg]                   [']
326.2289  38.2992    4.5  34.3  -98.5   1.3979   2.6    3.0	Cyg X-2
 53.8099  23.1907    2.6  39.9   86.5   4.5985   4.3 ------	UNKNOWN
 38.0588   9.3118    2.7  40.2  118.6   4.7415   4.4 ------	UNKNOWN
 55.5812  43.3180    2.6  32.2   54.4   2.0684   4.5 ------	UNKNOWN
354.0741  45.1612    2.9  12.9  -87.3   1.1372   4.0 ------	UNKNOWN
337.4253  35.1994    3.2  27.1 -110.9   1.3991   3.6 ------	UNKNOWN
310.4949  49.6631    2.7  41.9  -75.6   5.2614   4.2 ------	UNKNOWN