Analysis Summary
Notes:
- 1) No attempt has been made to eliminate the non-significant decimal places.
- 2) This batgrbproduct analysis is done using the HEASARC data.
- 3) This batgrbproduct analysis is using the flight position for the mask-weighting calculation.
======================================================================
BAT GRB EVENT DATA PROCESSING REPORT
Process Script Ver: batgrbproduct v2.46
Process Start Time: Mon Dec 17 14:06:16 EST 2018
Host Name: bat1
Current Working Dir: /local/data/bat1/alien/Swift_3rdBATcatalog/event/batevent_reproc/trigger874475
======================================================================
Trigger: 00874475 Segment: 000
BAT Trigger Time: 565531749.888 [s; MET]
Trigger Stop: 565531750.912 [s; MET]
UTC: 2018-12-03T12:08:47.866980 [includes UTCF correction]
Where From?: TDRSS position message
BAT
RA: 108.368923591337 Dec: -39.7690778271218 [deg; J2000]
Catalogged Source?: NO
Point Source?: YES
GRB Indicated?: YES [ by BAT flight software ]
Image S/N Ratio: 8.24
Image Trigger?: NO
Rate S/N Ratio: 14.8323969741913 [ if not an image trigger ]
Image S/N Ratio: 8.24
Analysis Position: [ source = BAT ]
RA: 108.368923591337 Dec: -39.7690778271218 [deg; J2000]
Refined Position: [ source = BAT pre-slew burst ]
RA: 108.337169327052 Dec: -39.7783831251791 [deg; J2000]
{ 07h 13m 20.9s , -39d 46' 42.2" }
+/- 1.29356544984538 [arcmin] (estimated 90% radius based on SNR)
+/- 0.413170845025074 [arcmin] (formal 1-sigma fit error)
SNR: 21.058171347652
Angular difference between the analysis and refined position is 1.567162 arcmin
Partial Coding Fraction: 0.8359375 [ including projection effects ]
Duration
T90: 15.0599999427795 +/- 1.76298946536287
Measured from: -0.812000036239624
to: 14.2479999065399 [s; relative to TRIGTIME]
T50: 8.39199995994568 +/- 0.950696620199982
Measured from: 1.49199998378754
to: 9.88399994373322 [s; relative to TRIGTIME]
Fluence
Peak Flux (peak 1 second)
Measured from: 1.0239999294281
to: 2.0239999294281 [s; relative to TRIGTIME]
Total Fluence
Measured from: -1.7960000038147
to: 15.8519999980927 [s; relative to TRIGTIME]
Band 1 Band 2 Band 3 Band 4
15-25 25-50 50-100 100-350 keV
Total 0.463087 0.544931 0.320919 0.074589
0.034495 0.036360 0.031140 0.026034 [error]
Peak 0.031797 0.050128 0.046322 0.022838
0.008435 0.008997 0.007820 0.006418 [error]
[ fluence units of on-axis counts / fully illuminated detector ]
======================================================================
====== Table of the duration information =============================
Value tstart tstop
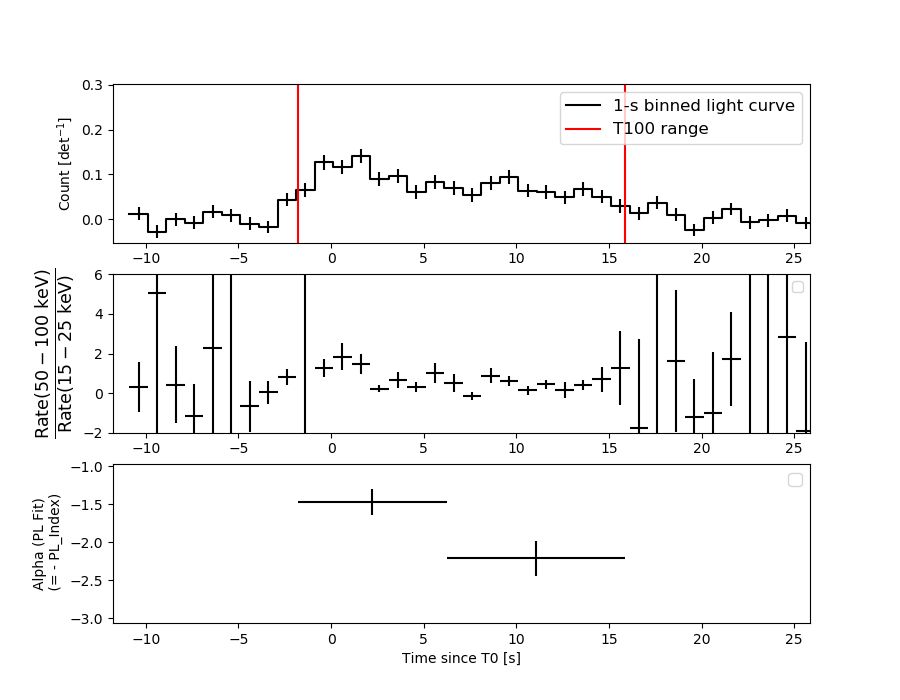
T100 17.648 -1.796 15.852
T90 15.060 -0.812 14.248
T50 8.392 1.492 9.884
Peak 1.000 1.024 2.024
====== Spectral Analysis Summary =====================================
Model : spectral model: simple power-law (PL) and cutoff power-law (CPL)
Ph_index : photon index: E^{Ph_index}
Ph_90err : 90% error of the photon index
Epeak : Epeak in keV
Epeak_90err: 90% error of Epeak
Norm : normalization at 50 keV in both the PL model and CPL model
Nomr_90err : 90% error of the normalization
chi2 : Chi-Squared
dof : degree of freedo
=== Time-averaged spectral analysis ===
(Best model with acceptable fit: PL)
Model Ph_index Ph_90err_low Ph_90err_hi Epeak Epeak_90err_low Epeak_90err_hi Norm Nomr_90err_low Norm_90err_hi chi2 dof
PL -1.814 -0.147 0.143 - - - 4.75e-03 -4.28e-04 4.22e-04 56.000 57
CPL -1.629 -0.562 0.612 89.358 N/A N/A 6.01e-03 N/A N/A 55.670 56
=== 1-s peak spectral analysis ===
(Best model with acceptable fit: PL)
Model Ph_index Ph_90err_low Ph_90err_hi Epeak Epeak_90err_low Epeak_90err_hi Norm Nomr_90err_low Norm_90err_hi chi2 dof
PL -1.204 -0.366 0.383 - - - 9.05e-03 -1.66e-03 1.66e-03 57.840 57
CPL -1.227 -0.343 0.414 9999.360 -9999.360 -9999.360 9.02e-03 -1.59e-03 -9.02e-03 57.880 56
=== Fluence/Peak Flux Summary ===
Model Band1 Band2 Band3 Band4 Band5 Total
15-25 25-50 50-100 100-350 15-150 15-350 keV
Fluence PL 1.44e-07 2.18e-07 2.48e-07 5.39e-07 7.71e-07 1.15e-06 erg/cm2
90%_error_low -1.69e-08 -1.68e-08 -3.06e-08 -1.25e-07 -7.01e-08 -1.57e-07 erg/cm2
90%_error_hi 1.73e-08 1.68e-08 3.08e-08 1.48e-07 7.11e-08 1.75e-07 erg/cm2
Peak flux PL 2.81e-01 3.37e-01 2.93e-01 4.34e-01 1.06e+00 1.34e+00 ph/cm2/s
90%_error_low -1.04e-01 -7.88e-02 -6.57e-02 -1.84e-01 -2.03e-01 -2.60e-01 ph/cm2/s
90%_error_hi 1.17e-01 7.43e-02 6.31e-02 2.64e-01 2.03e-01 2.71e-01 ph/cm2/s
Fluence CPL 1.41e-07 2.23e-07 2.48e-07 3.84e-07 7.56e-07 9.96e-07 erg/cm2
90%_error_low -1.91e-08 -2.00e-08 -3.18e-08 -2.34e-07 -8.25e-08 -2.51e-07 erg/cm2
90%_error_hi 1.86e-08 2.24e-08 3.17e-08 3.34e-07 8.13e-08 2.13e-07 erg/cm2
Peak flux CPL 2.90e-01 3.38e-01 2.89e-01 4.46e-01 1.07e+00 1.34e+00 ph/cm2/s
90%_error_low -1.16e-01 -8.18e-02 -6.42e-02 N/A -2.18e-01 -2.77e-01 ph/cm2/s
90%_error_hi 1.11e-01 7.61e-02 6.92e-02 N/A 2.05e-01 2.76e-01 ph/cm2/s
======================================================================
Image
Pre-slew 15.0-350.0 keV image (Event data)
#   RAcent    DECcent   POSerr    Theta     Phi              Peak Cts       SNR   Name
  108.3372   -39.7784   0.0091    21.6201   156.9337         1.4409948     21.058 TRIG_00874475

Foreground time interval of the image:
 -1.796  15.852 (delta_t =  17.648 [sec])
Background time interval of the image:
-298.187 -277.496 (delta_t =  20.691 [sec])
-239.888  -1.796 (delta_t = 238.092 [sec])
Light Curves
Note: The mask-weighted lightcurves have units of either count/det or counts/sec/det, where a det is 0.4 x 0.4 = 0.16 sq cm.
Full-time range; 1 s binning
Other quick-look light curves:
- 64 ms binning (zoomed)
- 16 ms binning (zoomed)
- 8 ms binning (zoomed)
- 2 ms binning (zoomed)
- SN=5 or 10 s binning (full-time range)
- Raw light curve
Spectra
- 64 ms binning (zoomed)
- 16 ms binning (zoomed)
- 8 ms binning (zoomed)
- 2 ms binning (zoomed)
- SN=5 or 10 s binning (full-time range)
- Raw light curve
Spectra
Notes:
- 1) The fitting includes the systematic errors.
- 2) When the burst includes telescope slew time periods, the fitting uses an average response file made from multiple 5-s response files through out the slew time plus single time preiod for the non-slew times, and weighted by the total counts in the corresponding time period using addrmf. An average response file is needed becuase a spectral fit using the pre-slew DRM will introduce some errors in both a spectral shape and a normalization if the PHA file contains a lot of the slew/post-slew time interval.
- 3) For fits to more complicated models (e.g. a power-law over a cutoff power-law), the BAT team has decided to require a chi-square improvement of more than 6 for each extra dof.
Time averaged spectrum fit using the average DRM
Power-law model
Time interval is from   -1.796 sec. to   15.852 sec.

Spectral model in power-law:
------------------------------------------------------------
Parameters  : value       lower 90%   higher 90%
Photon index: -1.81411     ( -0.147382   0.143235 )
Norm@50keV  : 4.74708E-03    ( -0.000428446   0.000421681 )
------------------------------------------------------------
#Fit statistic : Chi-Squared =          56.00 using 59 PHA bins.
# Reduced chi-squared =         0.9825 for     57 degrees of freedom
# Null hypothesis probability =   5.126057e-01

Photon flux (15-150 keV)    in 17.65 sec: 0.657787 ( -0.051072  0.0511 ) ph/cm2/s
Energy fluence (15-150 keV)             : 7.71107e-07 ( -7.0145e-08  7.11498e-08 ) ergs/cm2
Cutoff power-law model
Time interval is from   -1.796 sec. to   15.852 sec.
Spectral model in the cutoff power-law:
------------------------------------------------------------
Parameters  : value       lower 90%   higher 90%
Photon index: -1.62861     ( -0.562442   0.611539 )
Epeak [keV] : 89.3582      (   )
Norm@50keV  : 6.01123E-03    (     )
------------------------------------------------------------
#Fit statistic : Chi-Squared =          55.67 using 59 PHA bins.
# Reduced chi-squared =         0.9941 for     56 degrees of freedom
# Null hypothesis probability =   4.873852e-01

Photon flux (15-150 keV)    in 17.65 sec: 0.652226 ( -0.053692  0.05351 ) ph/cm2/s
Energy fluence (15-150 keV)             : 7.56214e-07 ( -8.25016e-08  8.12662e-08 ) ergs/cm2
1-s peak spectrum fit
Power-law model
Time interval is from    1.024 sec. to    2.024 sec.

Spectral model in power-law:
------------------------------------------------------------
Parameters  : value       lower 90%   higher 90%
Photon index: -1.20429     ( -0.365754   0.383372 )
Norm@50keV  : 9.05344E-03    ( -0.00165752   0.00165735 )
------------------------------------------------------------
#Fit statistic : Chi-Squared =          57.84 using 59 PHA bins.
# Reduced chi-squared =          1.015 for     57 degrees of freedom
# Null hypothesis probability =   4.439689e-01

Photon flux (15-150 keV)    in 1 sec: 1.06333 ( -0.20264  0.20346 ) ph/cm2/s
Energy fluence (15-150 keV)             : 9.17508e-08 ( -1.90097e-08  1.92203e-08 ) ergs/cm2
Cutoff power-law model

Time interval is from    1.024 sec. to    2.024 sec.
Spectral model in the cutoff power-law:
------------------------------------------------------------
Parameters  : value       lower 90%   higher 90%
Photon index: -1.20155     ( -0.344458   0.412172 )
Epeak [keV] : 1.00000E+04      ( -10000 -10000 )
Norm@50keV  : 9.09559E-03    ( -0.00166515   -0.00909559 )
------------------------------------------------------------
#Fit statistic : Chi-Squared =          57.86 using 59 PHA bins.
# Reduced chi-squared =          1.033 for     56 degrees of freedom
# Null hypothesis probability =   4.063147e-01

Photon flux (15-150 keV)    in 1 sec: 1.06976 ( -0.218146  0.20498 ) ph/cm2/s
Energy fluence (15-150 keV)             : 9.09829e-08 ( -1.82887e-08  1.99116e-08 ) ergs/cm2
Time-resolved spectra
Distribution
T90 vs. Hardness ratio plot
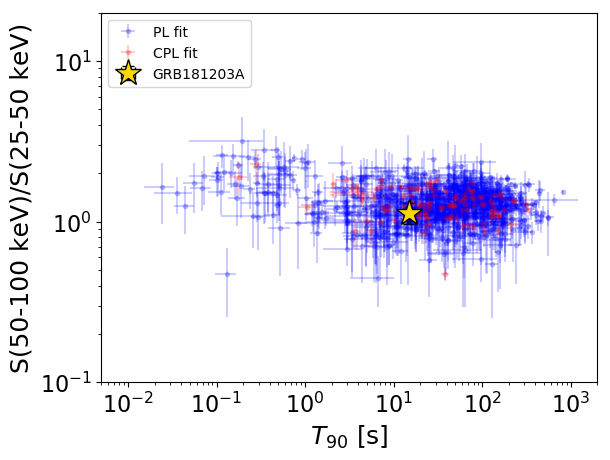
T90                                   = 15.06 sec.
Hardness ratio (energy fluence ratio) = 1.13754859909
S(15-50 keV) vs. S(50-150 keV) plot
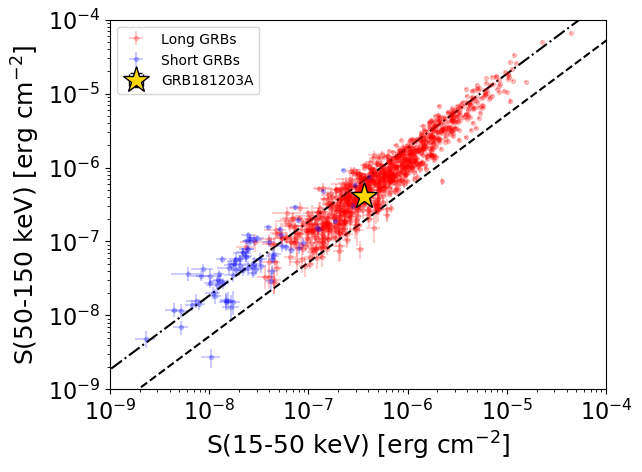
S(15-50 keV)  = 3.620541e-07
S(50-150 keV) = 4.090611e-07
The dash-dotted line and the dashed line traces the fluences calculated from the Band function with Epeak = 15 and 150 keV, respectively. Both lines assume a canonical values of alpha = -1 and beta = -2.5.
Mask shadow pattern
IMX = -3.646480396765555E-01, IMY = -1.552817912817654E-01
Spacecraft aspect plot
Bright source in the pre-burst/pre-slew/post-slew images
Pre-burst image of 15-350 keV band
Time interval of the image:
-298.187400 -277.496100
-239.888000 -1.796000

# RAcent  DECcent POSerr Theta    Phi  PeakCts   SNR AngSep     Name
#  [deg]    [deg]    ['] [deg]  [deg]                   [']
135.4639 -40.5188   11.5  35.4 -169.6   0.3349   1.0    3.7	Vela X-1
170.0526 -60.7291    0.0  41.7 -122.8  -1.1338  -1.7   10.0	Cen X-3
 38.3144 -27.1524    2.5  44.3   34.0   2.8592   4.6 ------	UNKNOWN
 53.0195 -29.0431    2.2  35.3   49.0   2.9732   5.3 ------	UNKNOWN
156.7354 -37.4734    3.0  49.5 -156.0   2.5124   3.9 ------	UNKNOWN
159.6455 -38.9094    3.0  50.1 -152.5   2.6223   3.9 ------	UNKNOWN
Pre-slew background subtracted image of 15-350 keV band
Time interval of the image:
-1.796000 15.852000

# RAcent  DECcent POSerr Theta    Phi  PeakCts   SNR AngSep     Name
#  [deg]    [deg]    ['] [deg]  [deg]                   [']
135.5094 -40.6794    5.6  35.4 -169.4   0.1787   2.1    7.5	Vela X-1
170.1437 -60.4841    9.3  41.8 -123.1   0.1908   1.2    9.8	Cen X-3
108.3372 -39.7784    0.5  21.6  156.9   1.4411  21.1 ------	UNKNOWN
Post-slew image of 15-350 keV band
Time interval of the image:
60.012590 962.201700

# RAcent  DECcent POSerr Theta    Phi  PeakCts   SNR AngSep     Name
#  [deg]    [deg]    ['] [deg]  [deg]                   [']
135.4888 -40.6407    5.5  20.7 -131.1   1.7595   2.1    5.5	Vela X-1
102.5984   0.0856    3.6  40.2  118.8   9.0329   3.3 ------	UNKNOWN
121.8017   6.1901    3.7  47.6  146.0   8.2856   3.1 ------	UNKNOWN
 75.0653 -75.7406    3.6  38.9  -39.8   3.4552   3.2 ------	UNKNOWN