Analysis Summary
Notes:
- 1) No attempt has been made to eliminate the non-significant decimal places.
- 2) This batgrbproduct analysis is done using the HEASARC data.
- 3) This batgrbproduct analysis is using the flight position for the mask-weighting calculation.
======================================================================
                  BAT GRB EVENT DATA PROCESSING REPORT
    Process Script Ver: batgrbproduct v2.46
    Process Start Time: Thu Mar 21 18:04:05 EDT 2019
             Host Name: bat1
   Current Working Dir: /local/data/bat1/alien/Swift_3rdBATcatalog/event/batevent_reproc/trigger878911
======================================================================

  Trigger: 00878911      Segment: 000

  BAT Trigger Time: 567351433.728   [s; MET]
      Trigger Stop: 567351434.752   [s; MET]
               UTC: 2018-12-24T13:36:51.593320    [includes UTCF correction]
       Where From?: TDRSS position message

  BAT
    RA: 125.931158144386   Dec: 6.20566865282203  [deg; J2000]

     Catalogged Source?: NO
     Point Source?:      YES
     GRB Indicated?:     YES    [ by BAT flight software ]
     Image S/N Ratio:    8.72
     Image Trigger?:     NO
     Rate S/N Ratio:     10.1488915650922  [ if not an image trigger ]
     Image S/N Ratio:    8.72

  Analysis Position:   [ source = BAT ]
    RA: 125.931158144386   Dec: 6.20566865282203  [deg; J2000]

  Refined Position:   [ source = BAT pre-slew burst ]
    RA: 125.948945736151   Dec: 6.19443852973039  [deg; J2000]
        { 08h 23m 47.7s , +06d 11' 40.0" }
         +/- 1.85467090399224 [arcmin] (estimated 90% radius based on SNR)
         +/- 0.70504519514209 [arcmin] (formal 1-sigma fit error)
    SNR: 12.58577635569

  Angular difference between the analysis and refined position is 1.256887 arcmin

  Partial Coding Fraction: 0.8046875    [ including projection effects ]

  Duration
     T90: 12.4879999160767 +/- 4.20341810663401
        Measured from: -9.50800001621246
                   to: 2.9799998998642     [s; relative to TRIGTIME]
     T50: 4.39599990844727 +/- 1.82103493633097
        Measured from: -3.02799999713898
                   to: 1.36799991130829     [s; relative to TRIGTIME]


  Fluence
     Peak Flux  (peak 1 second)
        Measured from: 0.479999899864197
                   to: 1.4799998998642     [s; relative to TRIGTIME]
     Total Fluence
        Measured from: -12.0360000133514
                   to: 3.30399990081787     [s; relative to TRIGTIME]

             Band 1     Band 2     Band 3     Band 4
              15-25      25-50     50-100    100-350     keV
 Total     0.161565   0.264346   0.252307   0.001988
           0.028814   0.030101   0.026589   0.022730 [error]
 Peak      0.022956   0.044222   0.048606   0.014019
           0.007527   0.008370   0.007294   0.006309 [error]

     [ fluence units of on-axis counts / fully illuminated detector ]

======================================================================


====== Table of the duration information =============================

        Value   tstart    tstop
T100   15.340  -12.036    3.304
T90    12.488   -9.508    2.980
T50     4.396   -3.028    1.368
Peak    1.000    0.480    1.480


====== Spectral Analysis Summary =====================================

Model      : spectral model: simple power-law (PL) and cutoff power-law (CPL)
Ph_index   : photon index: E^{Ph_index}
Ph_90err   : 90% error of the photon index
Epeak      : Epeak in keV
Epeak_90err: 90% error of Epeak
Norm       : normalization at 50 keV in both the PL model and CPL model
Nomr_90err : 90% error of the normalization
chi2       : Chi-Squared
dof        : degree of freedo

=== Time-averaged spectral analysis ===
(Best model with acceptable fit: PL)

Model Ph_index Ph_90err_low Ph_90err_hi  Epeak  Epeak_90err_low  Epeak_90err_hi  Norm       Nomr_90err_low    Norm_90err_hi    chi2    dof
PL      -1.269    -0.195      0.197       -           -               -         3.23e-03     -3.78e-04          3.78e-04      41.320   57
CPL     -0.413    -0.795      0.981       99.453     -28.281       422.256      8.22e-03     -4.70e-03          1.45e-02      37.900   56


=== 1-s peak spectral analysis ===
(Best model with acceptable fit: N/A)

Model Ph_index Ph_90err_low Ph_90err_hi  Epeak  Epeak_90err_low  Epeak_90err_hi  Norm       Nomr_90err_low    Norm_90err_hi    chi2    dof
PL      -1.026     -0.331     0.355       -           -               -         8.57e-03     -1.61e-03          1.59e-03      74.810   57
CPL     -0.957      0.957     1.204      873.500    -873.500      -873.500      9.21e-03     -2.20e-03          -9.21e-03      74.870   56


=== Fluence/Peak Flux Summary ===

              Model    Band1     Band2     Band3     Band4     Band5     Total
                       15-25     25-50    50-100    100-350    15-150    15-350    keV
Fluence         PL   5.10e-08  1.08e-07  1.79e-07  6.76e-07  4.94e-07  1.01e-06   erg/cm2
      90%_error_low -1.06e-08 -1.43e-08 -2.50e-08 -1.84e-07 -6.29e-08 -2.04e-07   erg/cm2
      90%_error_hi   1.12e-08  1.41e-08  2.48e-08  2.26e-07  6.34e-08  2.38e-07   erg/cm2
Peak flux       PL   2.24e-01  3.00e-01  2.94e-01  5.18e-01  9.88e-01  1.34e+00   ph/cm2/s
      90%_error_low -8.43e-02 -7.40e-02 -5.81e-02 -1.96e-01 -1.90e-01 -2.56e-01   ph/cm2/s
      90%_error_hi   9.67e-02  7.13e-02  5.70e-02  2.67e-01  1.91e-01  2.68e-01   ph/cm2/s

Fluence        CPL   4.27e-08  1.16e-07  1.93e-07  2.45e-07  4.70e-07  5.96e-07   erg/cm2
      90%_error_low -1.29e-08 -1.67e-08 -2.90e-08 -1.37e-07 -6.71e-08 -1.51e-07   erg/cm2
      90%_error_hi   1.35e-08  1.72e-08  2.98e-08  3.79e-07  6.75e-08  3.74e-07   erg/cm2
Peak flux      CPL   2.33e-01  3.01e-01  2.93e-01  5.44e-01  9.91e-01  1.33e+00   ph/cm2/s
      90%_error_low -1.10e-01     N/A   -5.69e-02     N/A   -1.99e-01 -4.08e-01   ph/cm2/s
      90%_error_hi   8.88e-02     N/A    6.90e-02     N/A    1.94e-01  2.45e-01   ph/cm2/s

======================================================================
Image
Pre-slew 15.0-350.0 keV image (Event data)
#   RAcent    DECcent   POSerr    Theta     Phi              Peak Cts       SNR   Name
  125.9489     6.1944   0.0152    29.9608  -171.2382         0.7210820     12.586 TRIG_00878911

Foreground time interval of the image:
-12.036   3.304 (delta_t =  15.340 [sec])
Background time interval of the image:
-239.728 -12.036 (delta_t = 227.692 [sec])
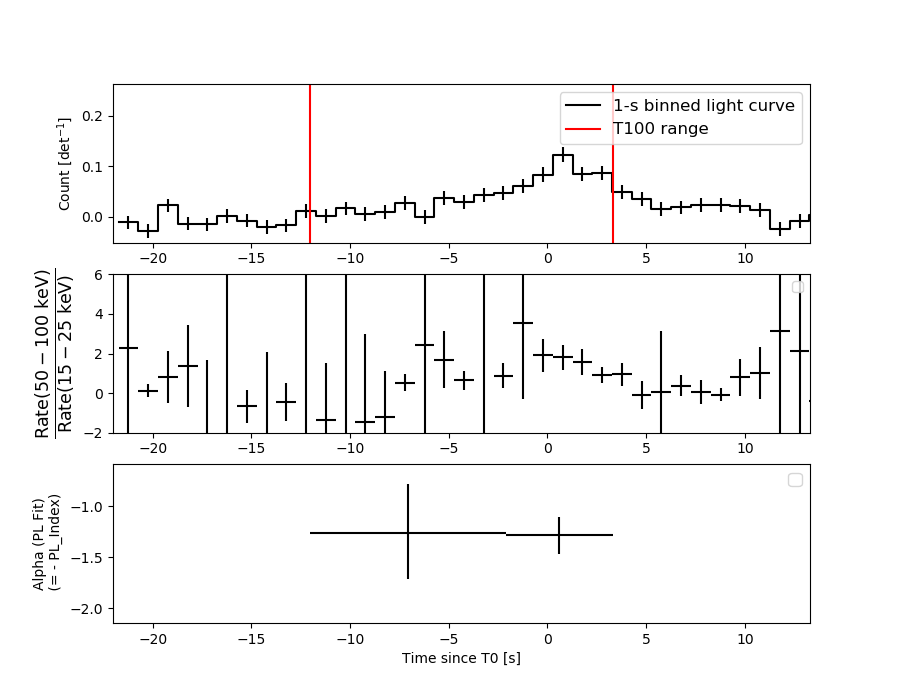
Light Curves
Note: The mask-weighted lightcurves have units of either count/det or counts/sec/det, where a det is 0.4 x 0.4 = 0.16 sq cm.
Full-time range; 1 s binning
Other quick-look light curves:
- 64 ms binning (zoomed)
- 16 ms binning (zoomed)
- 8 ms binning (zoomed)
- 2 ms binning (zoomed)
- SN=5 or 10 s binning (full-time range)
- Raw light curve
Spectra
- 64 ms binning (zoomed)
- 16 ms binning (zoomed)
- 8 ms binning (zoomed)
- 2 ms binning (zoomed)
- SN=5 or 10 s binning (full-time range)
- Raw light curve
Spectra
Notes:
- 1) The fitting includes the systematic errors.
- 2) When the burst includes telescope slew time periods, the fitting uses an average response file made from multiple 5-s response files through out the slew time plus single time preiod for the non-slew times, and weighted by the total counts in the corresponding time period using addrmf. An average response file is needed becuase a spectral fit using the pre-slew DRM will introduce some errors in both a spectral shape and a normalization if the PHA file contains a lot of the slew/post-slew time interval.
- 3) For fits to more complicated models (e.g. a power-law over a cutoff power-law), the BAT team has decided to require a chi-square improvement of more than 6 for each extra dof.
Time averaged spectrum fit using the average DRM
Power-law model
Time interval is from  -12.036 sec. to    3.304 sec.

Spectral model in power-law:
------------------------------------------------------------
Parameters  : value       lower 90%   higher 90%
Photon index: -1.26912     ( -0.194615   0.197301 )
Norm@50keV  : 3.23205E-03    ( -0.000377708   0.000377689 )
------------------------------------------------------------
#Fit statistic : Chi-Squared =          41.32 using 59 PHA bins.
# Reduced chi-squared =         0.7249 for     57 degrees of freedom
# Null hypothesis probability =   9.413339e-01

Photon flux (15-150 keV)    in 15.34 sec: 0.383488 ( -0.046281  0.046409 ) ph/cm2/s
Energy fluence (15-150 keV)             : 4.93793e-07 ( -6.29041e-08  6.33738e-08 ) ergs/cm2
Cutoff power-law model
Time interval is from  -12.036 sec. to    3.304 sec.
Spectral model in the cutoff power-law:
------------------------------------------------------------
Parameters  : value       lower 90%   higher 90%
Photon index: -0.41315     ( -0.795498   0.980828 )
Epeak [keV] : 99.4525      ( -28.2812 422.257 )
Norm@50keV  : 8.22327E-03    ( -0.00469827   0.0144547 )
------------------------------------------------------------
#Fit statistic : Chi-Squared =          37.90 using 59 PHA bins.
# Reduced chi-squared =         0.6768 for     56 degrees of freedom
# Null hypothesis probability =   9.695580e-01

Photon flux (15-150 keV)    in 15.34 sec: 0.370049 ( -0.048202  0.048173 ) ph/cm2/s
Energy fluence (15-150 keV)             : 4.70235e-07 ( -6.70866e-08  6.75207e-08 ) ergs/cm2
1-s peak spectrum fit
Power-law model

Time interval is from    0.480 sec. to    1.480 sec.

Spectral model in power-law:
------------------------------------------------------------
Parameters  : value       lower 90%   higher 90%
Photon index: -1.02633     ( -0.33064   0.355027 )
Norm@50keV  : 8.56837E-03    ( -0.00161202   0.00159077 )
------------------------------------------------------------
#Fit statistic : Chi-Squared =          74.81 using 59 PHA bins.
# Reduced chi-squared =          1.312 for     57 degrees of freedom
# Null hypothesis probability =   5.690410e-02

Photon flux (15-150 keV)    in 1 sec: 0.987989 ( -0.189772  0.191191 ) ph/cm2/s
Energy fluence (15-150 keV)             : 9.18142e-08 ( -1.78486e-08  1.79549e-08 ) ergs/cm2
Cutoff power-law model
Time interval is from    0.480 sec. to    1.480 sec.
Spectral model in the cutoff power-law:
------------------------------------------------------------
Parameters  : value       lower 90%   higher 90%
Photon index: -1.02063     ( 0.958824   1.20566 )
Epeak [keV] : 1.00000E+04      ( -10000 -10000 )
Norm@50keV  : 8.61811E-03    ( -0.00161727   -0.00861837 )
------------------------------------------------------------
#Fit statistic : Chi-Squared =          74.81 using 59 PHA bins.
# Reduced chi-squared =          1.336 for     56 degrees of freedom
# Null hypothesis probability =   4.728779e-02

Photon flux (15-150 keV)    in 1 sec: 0.991427 ( -0.199362  0.194003 ) ph/cm2/s
Energy fluence (15-150 keV)             : 9.20322e-08 ( -1.84166e-08  1.46716e-08 ) ergs/cm2
Time-resolved spectra
Distribution
T90 vs. Hardness ratio plot
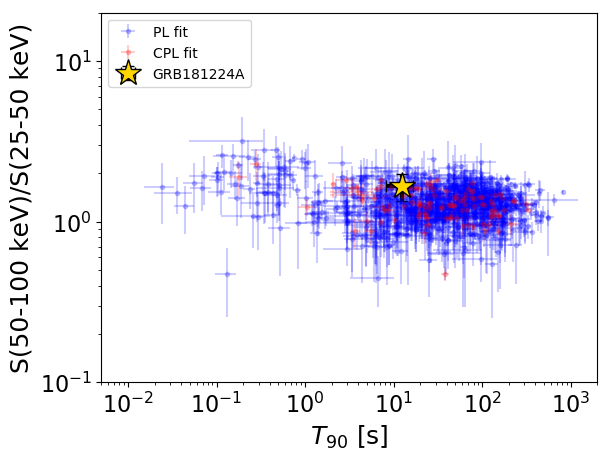
T90                                   = 12.488 sec.
Hardness ratio (energy fluence ratio) = 1.6597021725
S(15-50 keV) vs. S(50-150 keV) plot
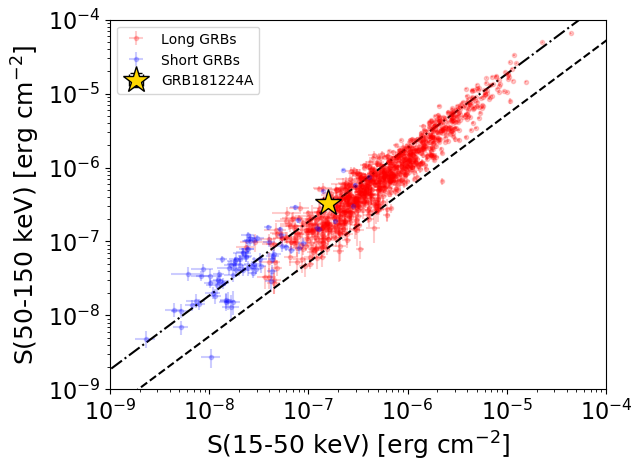
S(15-50 keV)  = 1.5900892e-07
S(50-150 keV) = 3.347849e-07
The dash-dotted line and the dashed line traces the fluences calculated from the Band function with Epeak = 15 and 150 keV, respectively. Both lines assume a canonical values of alpha = -1 and beta = -2.5.
Mask shadow pattern
IMX = -5.697109598222289E-01, IMY = 8.780683887632658E-02
Spacecraft aspect plot
Bright source in the pre-burst/pre-slew/post-slew images
Pre-burst image of 15-350 keV band
Time interval of the image:
-239.728000 -12.036000

# RAcent  DECcent POSerr Theta    Phi  PeakCts   SNR AngSep     Name
#  [deg]    [deg]    ['] [deg]  [deg]                   [']
 83.5984  22.0126    0.5  28.2   88.6   9.0787  21.1    1.9	Crab
 76.1156   9.4118    2.5  24.4   56.6   1.4569   4.7 ------	UNKNOWN
140.7857  -9.1635    3.2  43.6 -143.3   1.6967   3.6 ------	UNKNOWN
126.0638 -32.4354    2.2  40.0 -102.8   5.2226   5.3 ------	UNKNOWN
 85.5404 -48.7854    3.5  47.1  -53.1   4.1786   3.3 ------	UNKNOWN
Pre-slew background subtracted image of 15-350 keV band
Time interval of the image:
-12.036000 3.304000

# RAcent  DECcent POSerr Theta    Phi  PeakCts   SNR AngSep     Name
#  [deg]    [deg]    ['] [deg]  [deg]                   [']
 83.6617  21.8578    2.6  28.1   88.6   0.3589   4.4    9.5	Crab
125.9489   6.1944    0.9  30.0 -171.2   0.7213  12.6 ------	UNKNOWN
107.8696 -24.4640    1.9  23.9  -87.9   0.3515   6.0 ------	UNKNOWN
148.4065  -4.9942    2.5  51.0 -149.5   0.6714   4.7 ------	UNKNOWN
 67.4126 -48.7769    2.4  52.6  -39.2   1.1280   4.9 ------	UNKNOWN
Post-slew image of 15-350 keV band
Time interval of the image: