Analysis Summary
Notes:
- 1) No attempt has been made to eliminate the non-significant decimal places.
- 2) This batgrbproduct analysis is done using the HEASARC data.
- 3) This batgrbproduct analysis is using the flight position for the mask-weighting calculation.
======================================================================
BAT GRB EVENT DATA PROCESSING REPORT
Process Script Ver: batgrbproduct v2.46
Process Start Time: Sun Mar 17 22:59:35 EDT 2019
Host Name: bat1
Current Working Dir: /local/data/bat1/alien/Swift_3rdBATcatalog/event/batevent_reproc/trigger882252
======================================================================
Trigger: 00882252 Segment: 000
BAT Trigger Time: 568474506.816 [s; MET]
Trigger Stop: 568474507.328 [s; MET]
UTC: 2019-01-06T13:34:44.611040 [includes UTCF correction]
Where From?: TDRSS position message
BAT
RA: 29.8861170639664 Dec: 23.8568699774236 [deg; J2000]
Catalogged Source?: NO
Point Source?: YES
GRB Indicated?: YES [ by BAT flight software ]
Image S/N Ratio: 8.34
Image Trigger?: NO
Rate S/N Ratio: 16.2172747402269 [ if not an image trigger ]
Image S/N Ratio: 8.34
Analysis Position: [ source = BAT ]
RA: 29.8861170639664 Dec: 23.8568699774236 [deg; J2000]
Refined Position: [ source = BAT pre-slew burst ]
RA: 29.8783469872996 Dec: 23.8395668658353 [deg; J2000]
{ 01h 59m 30.8s , +23d 50' 22.4" }
+/- 0.807463733533503 [arcmin] (estimated 90% radius based on SNR)
+/- 0.27309884411791 [arcmin] (formal 1-sigma fit error)
SNR: 41.2857113732231
Angular difference between the analysis and refined position is 1.122341 arcmin
Partial Coding Fraction: 0.65625 [ including projection effects ]
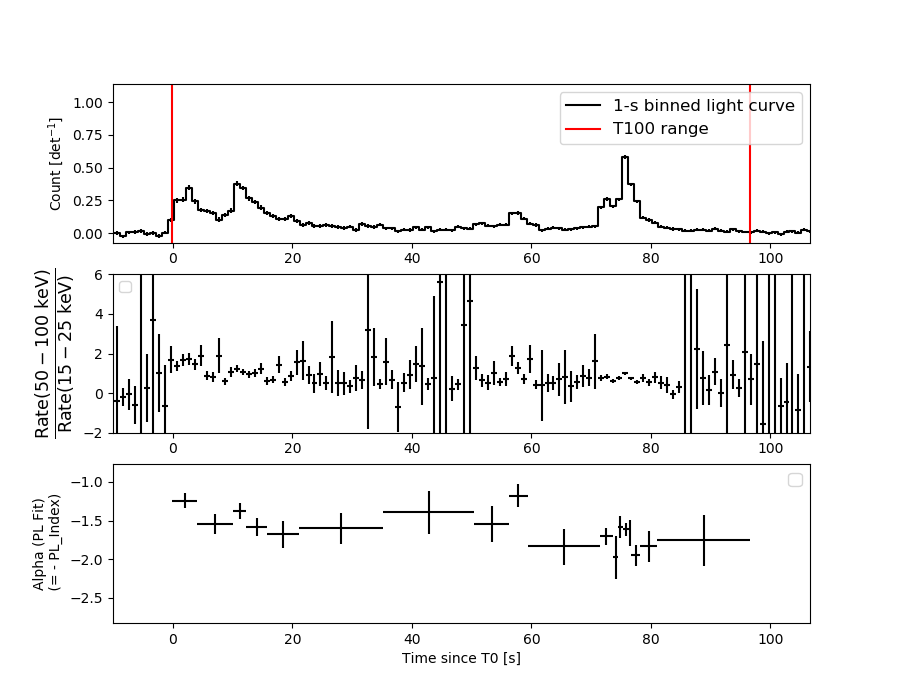
Duration
T90: 78.095999956131 +/- 2.08513594337612
Measured from: 1.85600006580353
to: 79.9520000219345 [s; relative to TRIGTIME]
T50: 62.0879999399185 +/- 0.639362154458515
Measured from: 10.9639999866486
to: 73.0519999265671 [s; relative to TRIGTIME]
Fluence
Peak Flux (peak 1 second)
Measured from: 75.2760000228882
to: 76.2760000228882 [s; relative to TRIGTIME]
Total Fluence
Measured from: -0.123999953269958
to: 96.6160000562668 [s; relative to TRIGTIME]
Band 1 Band 2 Band 3 Band 4
15-25 25-50 50-100 100-350 keV
Total 2.779173 3.554286 2.628089 0.602124
0.071938 0.075414 0.065843 0.055096 [error]
Peak 0.166576 0.252362 0.158662 0.025274
0.008892 0.009950 0.008639 0.005872 [error]
[ fluence units of on-axis counts / fully illuminated detector ]
======================================================================
====== Table of the duration information =============================
Value tstart tstop
T100 96.740 -0.124 96.616
T90 78.096 1.856 79.952
T50 62.088 10.964 73.052
Peak 1.000 75.276 76.276
====== Spectral Analysis Summary =====================================
Model : spectral model: simple power-law (PL) and cutoff power-law (CPL)
Ph_index : photon index: E^{Ph_index}
Ph_90err : 90% error of the photon index
Epeak : Epeak in keV
Epeak_90err: 90% error of Epeak
Norm : normalization at 50 keV in both the PL model and CPL model
Nomr_90err : 90% error of the normalization
chi2 : Chi-Squared
dof : degree of freedo
=== Time-averaged spectral analysis ===
(Best model with acceptable fit: PL)
Model Ph_index Ph_90err_low Ph_90err_hi Epeak Epeak_90err_low Epeak_90err_hi Norm Nomr_90err_low Norm_90err_hi chi2 dof
PL -1.588 -0.052 0.052 - - - 6.47e-03 -1.74e-04 1.74e-04 41.200 57
CPL -1.368 -0.201 0.210 154.628 -50.066 738.297 8.19e-03 -1.54e-03 2.00e-03 37.680 56
=== 1-s peak spectral analysis ===
(Best model with acceptable fit: CPL)
Model Ph_index Ph_90err_low Ph_90err_hi Epeak Epeak_90err_low Epeak_90err_hi Norm Nomr_90err_low Norm_90err_hi chi2 dof
PL -1.605 -0.082 0.081 - - - 3.79e-02 -1.92e-03 1.91e-03 72.560 57
CPL -0.893 -0.356 0.389 74.771 -11.898 28.201 8.92e-02 -3.05e-02 5.24e-02 59.880 56
=== Fluence/Peak Flux Summary ===
Model Band1 Band2 Band3 Band4 Band5 Total
15-25 25-50 50-100 100-350 15-150 15-350 keV
Fluence PL 8.69e-07 1.51e-06 2.01e-06 5.47e-06 5.86e-06 9.86e-06 erg/cm2
90%_error_low -4.57e-08 -4.60e-08 -6.90e-08 -4.17e-07 -1.66e-07 -4.57e-07 erg/cm2
90%_error_hi 4.67e-08 4.59e-08 6.88e-08 4.40e-07 1.66e-07 4.75e-07 erg/cm2
Peak flux PL 1.73e+00 1.63e+00 1.07e+00 1.09e+00 4.88e+00 5.53e+00 ph/cm2/s
90%_error_low -1.36e-01 -8.25e-02 -6.83e-02 -1.33e-01 -2.40e-01 -2.69e-01 ph/cm2/s
90%_error_hi 1.39e-01 8.23e-02 6.81e-02 1.43e-01 2.40e-01 2.69e-01 ph/cm2/s
Fluence CPL 8.57e-07 1.16e-06 1.21e-06 2.84e-06 4.00e-06 6.07e-06 erg/cm2
90%_error_low -4.17e-08 -8.01e-08 -6.62e-08 -1.74e-07 -2.40e-07 -2.12e-07 erg/cm2
90%_error_hi 4.16e-08 7.34e-08 5.71e-08 1.61e-07 2.09e-07 1.84e-07 erg/cm2
Peak flux CPL 1.54e+00 1.75e+00 1.12e+00 5.09e-01 4.74e+00 4.93e+00 ph/cm2/s
90%_error_low -1.61e-01 -1.03e-01 -7.69e-02 -1.56e-01 -2.49e-01 -2.99e-01 ph/cm2/s
90%_error_hi 1.63e-01 1.05e-01 7.75e-02 2.24e-01 2.49e-01 3.25e-01 ph/cm2/s
======================================================================
Image
Pre-slew 15.0-350.0 keV image (Event data)
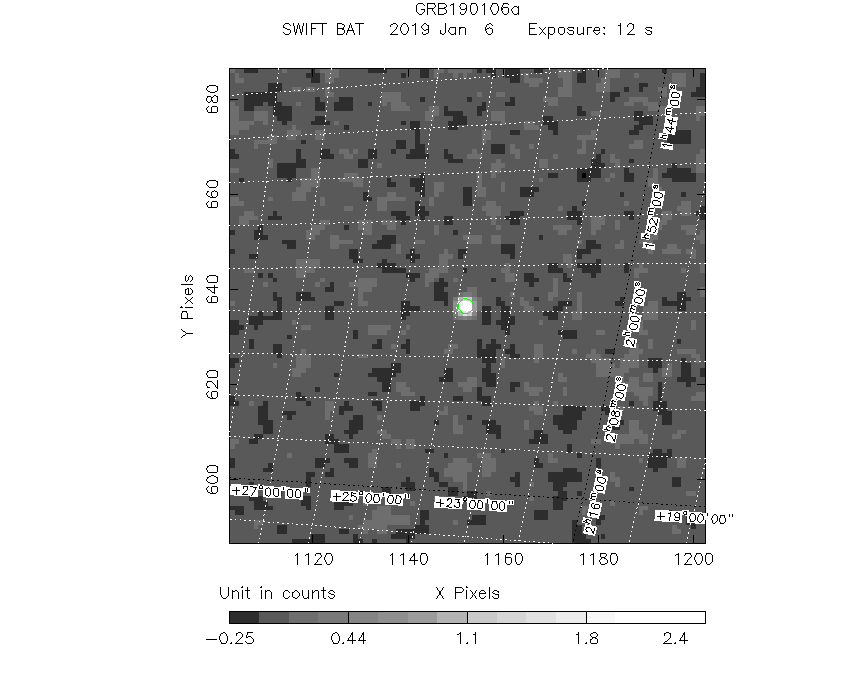
#   RAcent    DECcent   POSerr    Theta     Phi              Peak Cts       SNR   Name
   29.8783    23.8396   0.0047    33.5753  -149.6076         2.7932499     41.286 TRIG_00882252

Foreground time interval of the image:
 -0.124  11.885 (delta_t =  12.009 [sec])
Background time interval of the image:
-572.715 -554.030 (delta_t =  18.686 [sec])
-239.816  -0.124 (delta_t = 239.692 [sec])
Light Curves
Note: The mask-weighted lightcurves have units of either count/det or counts/sec/det, where a det is 0.4 x 0.4 = 0.16 sq cm.
Full-time range; 1 s binning
Other quick-look light curves:
- 64 ms binning (zoomed)
- 16 ms binning (zoomed)
- 8 ms binning (zoomed)
- 2 ms binning (zoomed)
- SN=5 or 10 s binning (full-time range)
- Raw light curve
Spectra
- 64 ms binning (zoomed)
- 16 ms binning (zoomed)
- 8 ms binning (zoomed)
- 2 ms binning (zoomed)
- SN=5 or 10 s binning (full-time range)
- Raw light curve
Spectra
Notes:
- 1) The fitting includes the systematic errors.
- 2) When the burst includes telescope slew time periods, the fitting uses an average response file made from multiple 5-s response files through out the slew time plus single time preiod for the non-slew times, and weighted by the total counts in the corresponding time period using addrmf. An average response file is needed becuase a spectral fit using the pre-slew DRM will introduce some errors in both a spectral shape and a normalization if the PHA file contains a lot of the slew/post-slew time interval.
- 3) For fits to more complicated models (e.g. a power-law over a cutoff power-law), the BAT team has decided to require a chi-square improvement of more than 6 for each extra dof.
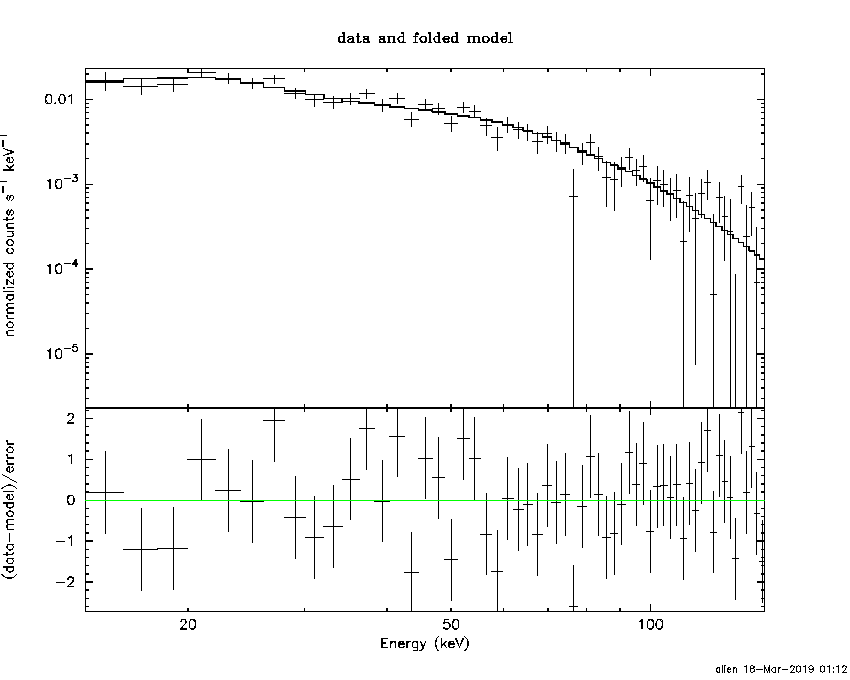
Time averaged spectrum fit using the average DRM
Power-law model
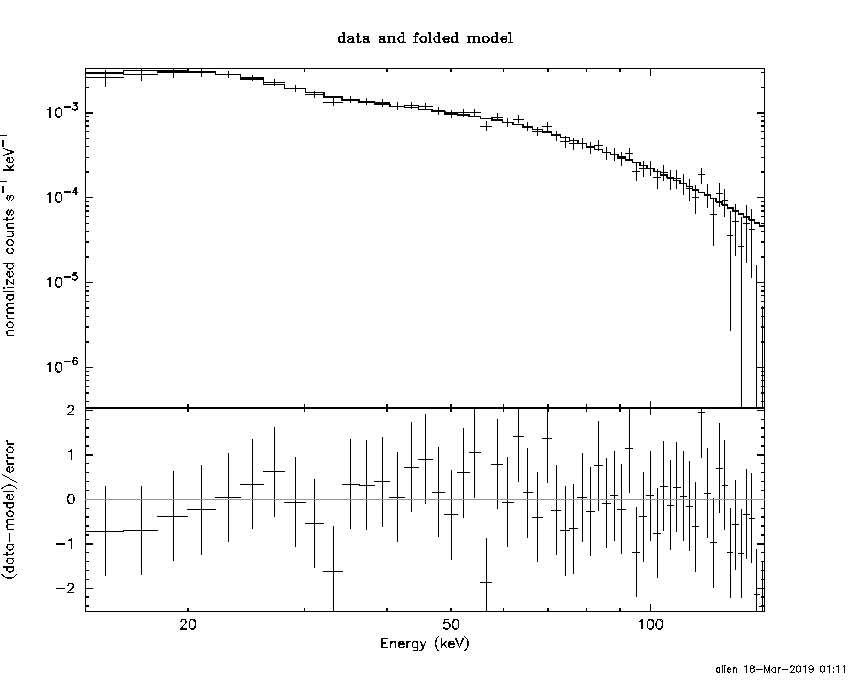
Time interval is from   -0.124 sec. to   96.616 sec.

Spectral model in power-law:
------------------------------------------------------------
Parameters  : value       lower 90%   higher 90%
Photon index: -1.58844     ( -0.0517753   0.0516712 )
Norm@50keV  : 6.47202E-03    ( -0.000173924   0.000173877 )
------------------------------------------------------------
#Fit statistic : Chi-Squared =          41.20 using 59 PHA bins.
# Reduced chi-squared =         0.7229 for     57 degrees of freedom
# Null hypothesis probability =   9.429108e-01

Photon flux (15-150 keV)    in 96.74 sec: 0.828762 ( -0.024651  0.024735 ) ph/cm2/s
Energy fluence (15-150 keV)             : 5.86457e-06 ( -1.65606e-07  1.65966e-07 ) ergs/cm2
Cutoff power-law model
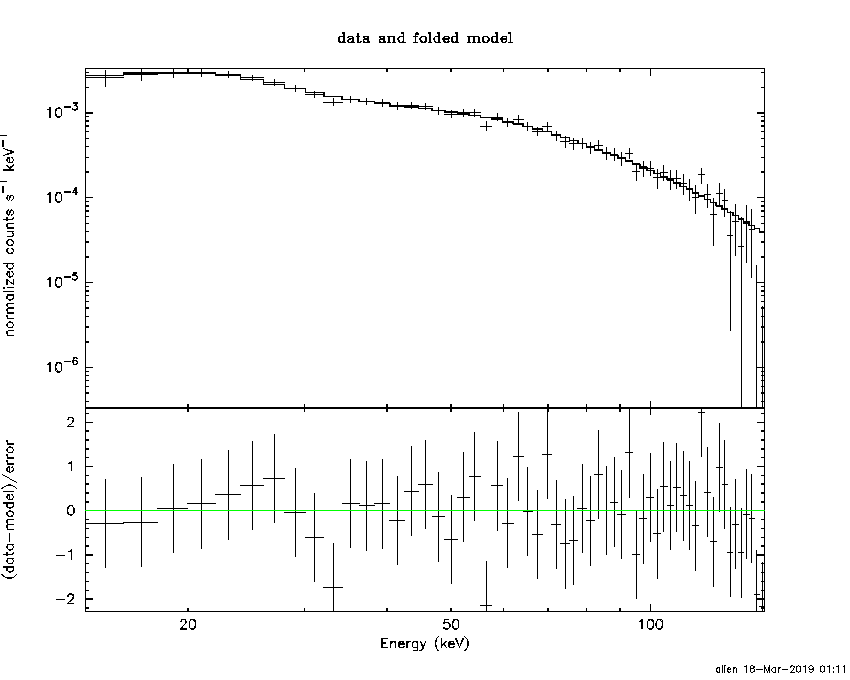
Time interval is from   -0.124 sec. to   96.616 sec.
Spectral model in the cutoff power-law:
------------------------------------------------------------
Parameters  : value       lower 90%   higher 90%
Photon index: -1.36822     ( -0.200549   0.210106 )
Epeak [keV] : 154.628      ( -50.0653 738.298 )
Norm@50keV  : 8.18970E-03    ( -0.00154095   0.00200013 )
------------------------------------------------------------
#Fit statistic : Chi-Squared =          37.68 using 59 PHA bins.
# Reduced chi-squared =         0.6728 for     56 degrees of freedom
# Null hypothesis probability =   9.714335e-01

Photon flux (15-150 keV)    in 96.74 sec: 0.814324 ( -0.027627  0.027746 ) ph/cm2/s
Energy fluence (15-150 keV)             : 4.00365e-06 ( -2.40116e-07  2.08519e-07 ) ergs/cm2
1-s peak spectrum fit
Power-law model
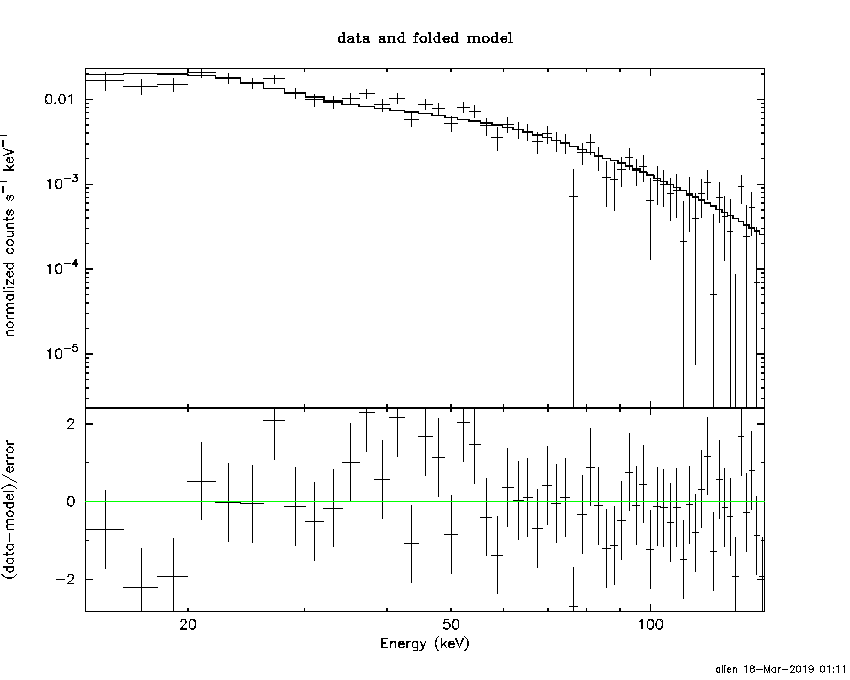
Time interval is from   75.276 sec. to   76.276 sec.

Spectral model in power-law:
------------------------------------------------------------
Parameters  : value       lower 90%   higher 90%
Photon index: -1.60516     ( -0.0820543   0.0812595 )
Norm@50keV  : 3.79181E-02    ( -0.00191809   0.00191124 )
------------------------------------------------------------
#Fit statistic : Chi-Squared =          72.56 using 59 PHA bins.
# Reduced chi-squared =          1.273 for     57 degrees of freedom
# Null hypothesis probability =   8.025763e-02

Photon flux (15-150 keV)    in 1 sec: 4.88064 ( -0.24029  0.24046 ) ph/cm2/s
Energy fluence (15-150 keV)             : 3.54446e-07 ( -1.91642e-08  1.92513e-08 ) ergs/cm2
Cutoff power-law model
Time interval is from   75.276 sec. to   76.276 sec.
Spectral model in the cutoff power-law:
------------------------------------------------------------
Parameters  : value       lower 90%   higher 90%
Photon index: -0.892926     ( -0.35556   0.389094 )
Epeak [keV] : 74.7712      ( -11.8985 28.2012 )
Norm@50keV  : 8.92257E-02    ( -0.0304938   0.0523995 )
------------------------------------------------------------
#Fit statistic : Chi-Squared =          59.88 using 59 PHA bins.
# Reduced chi-squared =          1.069 for     56 degrees of freedom
# Null hypothesis probability =   3.369476e-01

Photon flux (15-150 keV)    in 1 sec: 4.74436 ( -0.24939  0.24935 ) ph/cm2/s
Energy fluence (15-150 keV)             : 3.35885e-07 ( -2.13782e-08  2.14043e-08 ) ergs/cm2
Time-resolved spectra
Distribution
T90 vs. Hardness ratio plot
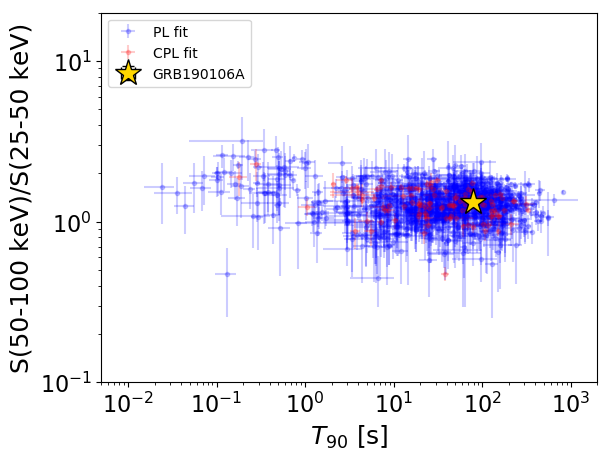
T90                                   = 78.096 sec.
Hardness ratio (energy fluence ratio) = 1.33014737193
S(15-50 keV) vs. S(50-150 keV) plot
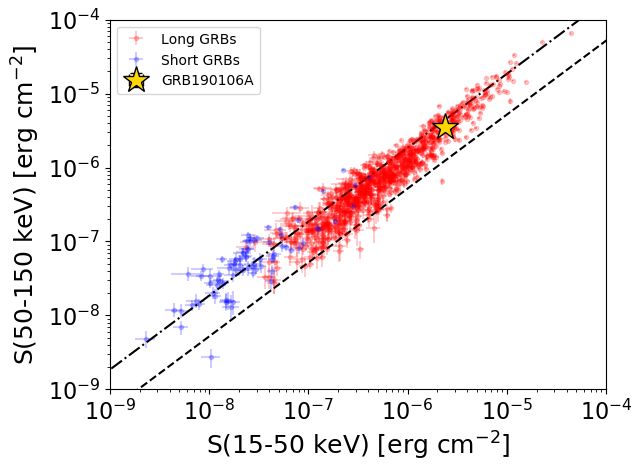
S(15-50 keV)  = 2.3810565e-06
S(50-150 keV) = 3.483593e-06
The dash-dotted line and the dashed line traces the fluences calculated from the Band function with Epeak = 15 and 150 keV, respectively. Both lines assume a canonical values of alpha = -1 and beta = -2.5.
Mask shadow pattern
IMX = -5.725623150005047E-01, IMY = 3.358176116065797E-01
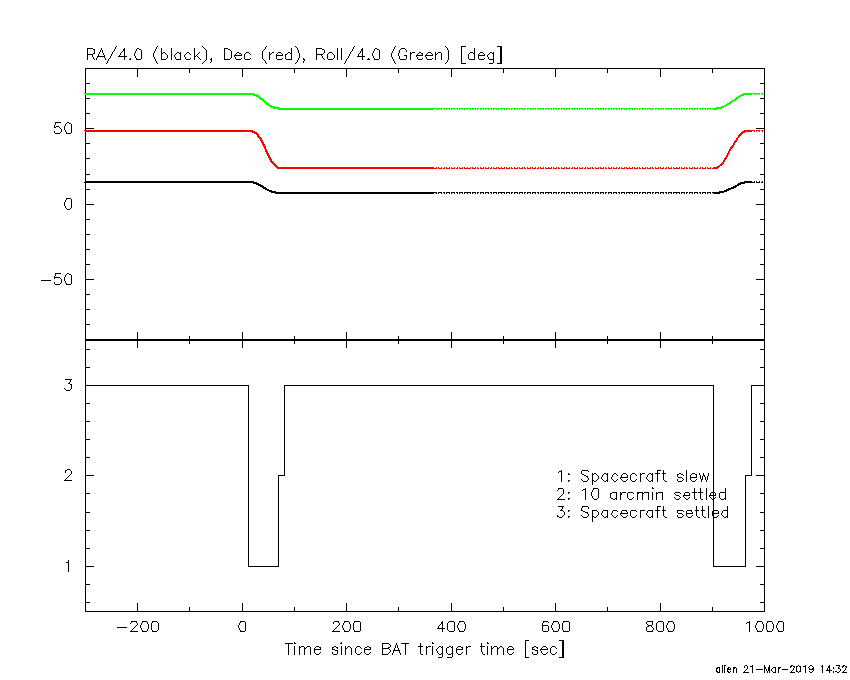
Spacecraft aspect plot
Bright source in the pre-burst/pre-slew/post-slew images
Pre-burst image of 15-350 keV band
Time interval of the image:
-572.715410 -554.029900
-239.816000 -0.124000

# RAcent  DECcent POSerr Theta    Phi  PeakCts   SNR AngSep     Name
#  [deg]    [deg]    ['] [deg]  [deg]                   [']
 83.6476  22.0126    0.7  33.2  111.9   9.3900  15.6    0.8	Crab
 40.8992  61.4309    0.6  16.3  -53.9   5.8787  19.4 ------	UNKNOWN
Pre-slew background subtracted image of 15-350 keV band
Time interval of the image:
-0.124000 11.884600

# RAcent  DECcent POSerr Theta    Phi  PeakCts   SNR AngSep     Name
#  [deg]    [deg]    ['] [deg]  [deg]                   [']
 83.5102  21.9351    7.4  33.2  112.1  -0.1738  -1.6    8.3	Crab
 90.6392  18.2681    3.1  39.8  105.8   0.7299   3.7 ------	UNKNOWN
 29.8783  23.8396    0.3  33.6 -149.6   2.7932  41.3 ------	UNKNOWN
Post-slew image of 15-350 keV band
Time interval of the image:
70.484590 901.984600

# RAcent  DECcent POSerr Theta    Phi  PeakCts   SNR AngSep     Name
#  [deg]    [deg]    ['] [deg]  [deg]                   [']
 72.2663  44.2358    4.1  40.0   65.5   6.5769   2.8 ------	UNKNOWN
 40.9248  61.4357    0.7  38.3   25.2  17.4535  16.2 ------	UNKNOWN
 16.4508  59.1153    3.1  36.5    5.2   3.1101   3.7 ------	UNKNOWN
 16.4341  19.9694    2.2  13.1  -88.0   3.3134   5.2 ------	UNKNOWN
  2.6690  27.6441    2.8  24.7  -58.7   2.9084   4.0 ------	UNKNOWN
  8.1009 -22.5756    3.4  51.0 -137.1  12.8108   3.4 ------	UNKNOWN