Analysis Summary
Notes:
- 1) No attempt has been made to eliminate the non-significant decimal places.
- 2) This batgrbproduct analysis is done using the HEASARC data.
- 3) This batgrbproduct analysis is using the flight position for the mask-weighting calculation.
======================================================================
BAT GRB EVENT DATA PROCESSING REPORT
Process Script Ver: batgrbproduct v2.46
Process Start Time: Sun Mar 17 22:56:43 EDT 2019
Host Name: bat1
Current Working Dir: /local/data/bat1/alien/Swift_3rdBATcatalog/event/batevent_reproc/trigger882747
======================================================================
Trigger: 00882747 Segment: 000
BAT Trigger Time: 568703584 [s; MET]
Trigger Stop: 568703680 [s; MET]
UTC: 2019-01-09T05:12:41.780680 [includes UTCF correction]
Where From?: TDRSS position message
BAT
RA: 33.2181437048103 Dec: 38.1099859036362 [deg; J2000]
Catalogged Source?: NO
Point Source?: YES
GRB Indicated?: YES [ by BAT flight software ]
Image S/N Ratio: 19.78
Image Trigger?: YES
Rate S/N Ratio: 0 [ if not an image trigger ]
Image S/N Ratio: 19.78
Analysis Position: [ source = BAT ]
RA: 33.2181437048103 Dec: 38.1099859036362 [deg; J2000]
Refined Position: [ source = BAT pre-slew burst ]
RA: 33.2143907597294 Dec: 38.1112460329202 [deg; J2000]
{ 02h 12m 51.5s , +38d 06' 40.5" }
+/- 1.02805090206141 [arcmin] (estimated 90% radius based on SNR)
+/- 0.373776012119829 [arcmin] (formal 1-sigma fit error)
SNR: 29.2384697514341
Angular difference between the analysis and refined position is 0.192632 arcmin
Partial Coding Fraction: 0.2851562 [ including projection effects ]
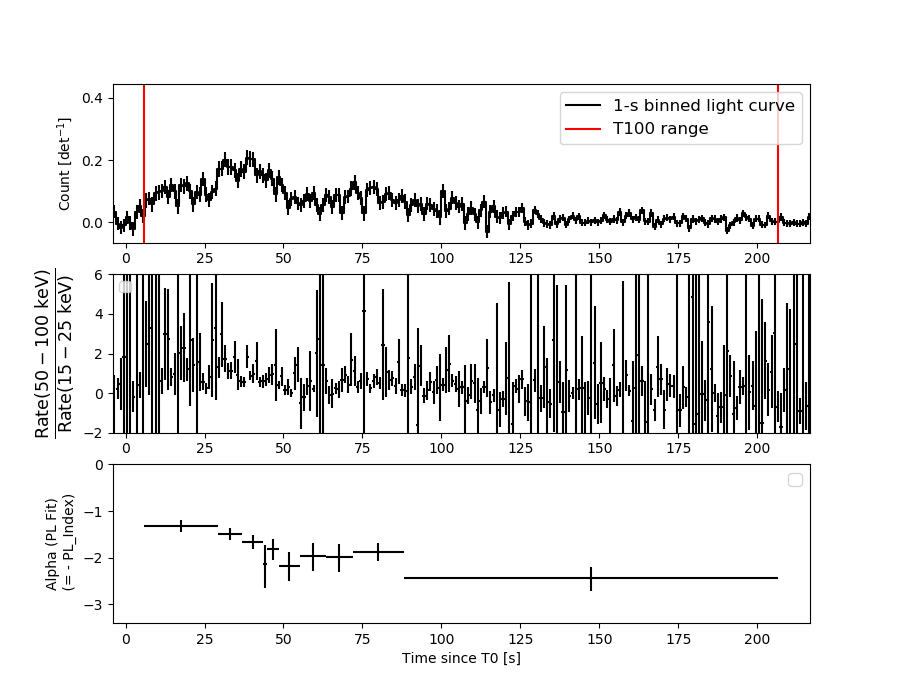
Duration
T90: 115.007999897003 +/- 33.8917526652539
Measured from: 12.2560000419617
to: 127.263999938965 [s; relative to TRIGTIME]
T50: 45.3880000114441 +/- 3.69487054579114
Measured from: 31.4839999675751
to: 76.8719999790192 [s; relative to TRIGTIME]
Fluence
Peak Flux (peak 1 second)
Measured from: 38.8279999494553
to: 39.8279999494553 [s; relative to TRIGTIME]
Total Fluence
Measured from: 5.86800003051758
to: 206.679999947548 [s; relative to TRIGTIME]
Band 1 Band 2 Band 3 Band 4
15-25 25-50 50-100 100-350 keV
Total 3.162105 4.612923 2.367926 0.352234
0.145105 0.151791 0.129867 0.109244 [error]
Peak 0.074511 0.072266 0.076282 0.003877
0.013786 0.015314 0.012665 0.009429 [error]
[ fluence units of on-axis counts / fully illuminated detector ]
======================================================================
====== Table of the duration information =============================
Value tstart tstop
T100 200.812 5.868 206.680
T90 115.008 12.256 127.264
T50 45.388 31.484 76.872
Peak 1.000 38.828 39.828
====== Spectral Analysis Summary =====================================
Model : spectral model: simple power-law (PL) and cutoff power-law (CPL)
Ph_index : photon index: E^{Ph_index}
Ph_90err : 90% error of the photon index
Epeak : Epeak in keV
Epeak_90err: 90% error of Epeak
Norm : normalization at 50 keV in both the PL model and CPL model
Nomr_90err : 90% error of the normalization
chi2 : Chi-Squared
dof : degree of freedo
=== Time-averaged spectral analysis ===
(Best model with acceptable fit: CPL)
Model Ph_index Ph_90err_low Ph_90err_hi Epeak Epeak_90err_low Epeak_90err_hi Norm Nomr_90err_low Norm_90err_hi chi2 dof
PL -1.864 -0.079 0.078 - - - 3.33e-03 -1.61e-04 1.60e-04 88.840 57
CPL -0.329 -0.451 0.502 49.501 -3.452 4.370 2.19e-02 -9.27e-03 1.87e-02 46.110 56
=== 1-s peak spectral analysis ===
(Best model with acceptable fit: PL)
Model Ph_index Ph_90err_low Ph_90err_hi Epeak Epeak_90err_low Epeak_90err_hi Norm Nomr_90err_low Norm_90err_hi chi2 dof
PL -1.668 -0.317 0.299 - - - 1.42e-02 -2.86e-03 2.80e-03 65.630 57
CPL -0.913 -1.290 1.572 72.650 -46.554 -72.650 3.44e-02 -3.44e-02 1.66e-01 64.500 56
=== Fluence/Peak Flux Summary ===
Model Band1 Band2 Band3 Band4 Band5 Total
15-25 25-50 50-100 100-350 15-150 15-350 keV
Fluence PL 1.20e-06 1.77e-06 1.95e-06 4.03e-06 6.16e-06 8.95e-06 erg/cm2
90%_error_low -8.33e-08 -7.88e-08 -1.25e-07 -5.08e-07 -2.96e-07 -6.30e-07 erg/cm2
90%_error_hi 8.48e-08 7.88e-08 1.26e-07 5.54e-07 2.98e-07 6.64e-07 erg/cm2
Peak flux PL 6.85e-01 6.25e-01 3.93e-01 3.78e-01 1.86e+00 2.08e+00 ph/cm2/s
90%_error_low -1.91e-01 -1.20e-01 -9.90e-02 -1.58e-01 -3.52e-01 -3.91e-01 ph/cm2/s
90%_error_hi 2.04e-01 1.19e-01 9.73e-02 2.07e-01 3.52e-01 3.93e-01 ph/cm2/s
Fluence CPL 9.64e-07 2.04e-06 1.93e-06 6.74e-07 5.45e-06 5.61e-06 erg/cm2
90%_error_low -1.02e-07 -1.08e-07 -1.57e-07 -2.46e-07 -3.31e-07 -4.05e-07 erg/cm2
90%_error_hi 1.04e-07 1.10e-07 1.53e-07 3.70e-07 3.39e-07 4.83e-07 erg/cm2
Peak flux CPL 6.04e-01 6.77e-01 4.26e-01 1.88e-01 1.83e+00 1.89e+00 ph/cm2/s
90%_error_low -2.39e-01 -1.45e-01 -1.14e-01 -1.88e-01 -3.60e-01 -3.97e-01 ph/cm2/s
90%_error_hi 2.41e-01 1.54e-01 1.21e-01 2.62e-01 3.58e-01 4.75e-01 ph/cm2/s
======================================================================
Image
Pre-slew 15.0-350.0 keV image (Event data)
#   RAcent    DECcent   POSerr    Theta     Phi              Peak Cts       SNR   Name
   33.2144    38.1112   0.0065    32.6971    75.0753         9.7042926     29.238 TRIG_00882747

Foreground time interval of the image:
  5.868 105.701 (delta_t =  99.833 [sec])
Background time interval of the image:
-239.000   5.868 (delta_t = 244.868 [sec])
Light Curves
Note: The mask-weighted lightcurves have units of either count/det or counts/sec/det, where a det is 0.4 x 0.4 = 0.16 sq cm.
Full-time range; 1 s binning
Other quick-look light curves:
- 64 ms binning (zoomed)
- 16 ms binning (zoomed)
- 8 ms binning (zoomed)
- 2 ms binning (zoomed)
- SN=5 or 10 s binning (full-time range)
- Raw light curve
Spectra
- 64 ms binning (zoomed)
- 16 ms binning (zoomed)
- 8 ms binning (zoomed)
- 2 ms binning (zoomed)
- SN=5 or 10 s binning (full-time range)
- Raw light curve
Spectra
Notes:
- 1) The fitting includes the systematic errors.
- 2) When the burst includes telescope slew time periods, the fitting uses an average response file made from multiple 5-s response files through out the slew time plus single time preiod for the non-slew times, and weighted by the total counts in the corresponding time period using addrmf. An average response file is needed becuase a spectral fit using the pre-slew DRM will introduce some errors in both a spectral shape and a normalization if the PHA file contains a lot of the slew/post-slew time interval.
- 3) For fits to more complicated models (e.g. a power-law over a cutoff power-law), the BAT team has decided to require a chi-square improvement of more than 6 for each extra dof.
Time averaged spectrum fit using the average DRM
Power-law model
Time interval is from    5.868 sec. to  206.680 sec.

Spectral model in power-law:
------------------------------------------------------------
Parameters  : value       lower 90%   higher 90%
Photon index: -1.86377     ( -0.0789212   0.0777441 )
Norm@50keV  : 3.33414E-03    ( -0.000160588   0.000159786 )
------------------------------------------------------------
#Fit statistic : Chi-Squared =          88.84 using 59 PHA bins.
# Reduced chi-squared =          1.559 for     57 degrees of freedom
# Null hypothesis probability =   4.421823e-03

Photon flux (15-150 keV)    in 200.8 sec: 0.471319 ( -0.021483  0.021519 ) ph/cm2/s
Energy fluence (15-150 keV)             : 6.15607e-06 ( -2.96389e-07  2.97857e-07 ) ergs/cm2
Cutoff power-law model
Time interval is from    5.868 sec. to  206.680 sec.
Spectral model in the cutoff power-law:
------------------------------------------------------------
Parameters  : value       lower 90%   higher 90%
Photon index: -0.329152     ( -0.451168   0.501856 )
Epeak [keV] : 49.5010      ( -3.45164 4.3706 )
Norm@50keV  : 2.19279E-02    ( -0.0092747   0.0187229 )
------------------------------------------------------------
#Fit statistic : Chi-Squared =          46.11 using 59 PHA bins.
# Reduced chi-squared =         0.8234 for     56 degrees of freedom
# Null hypothesis probability =   8.243563e-01

Photon flux (15-150 keV)    in 200.8 sec: 0.435178 ( -0.023269  0.023359 ) ph/cm2/s
Energy fluence (15-150 keV)             : 5.45272e-06 ( -3.30675e-07  3.38944e-07 ) ergs/cm2
1-s peak spectrum fit
Power-law model
Time interval is from   38.828 sec. to   39.828 sec.

Spectral model in power-law:
------------------------------------------------------------
Parameters  : value       lower 90%   higher 90%
Photon index: -1.66823     ( -0.316979   0.299432 )
Norm@50keV  : 1.41677E-02    ( -0.00285587   0.00279874 )
------------------------------------------------------------
#Fit statistic : Chi-Squared =          65.63 using 59 PHA bins.
# Reduced chi-squared =          1.151 for     57 degrees of freedom
# Null hypothesis probability =   2.026216e-01

Photon flux (15-150 keV)    in 1 sec: 1.86130 ( -0.35172  0.35208 ) ph/cm2/s
Energy fluence (15-150 keV)             : 1.31553e-07 ( -2.75035e-08  2.77926e-08 ) ergs/cm2
Cutoff power-law model
Time interval is from   38.828 sec. to   39.828 sec.
Spectral model in the cutoff power-law:
------------------------------------------------------------
Parameters  : value       lower 90%   higher 90%
Photon index: -0.912667     ( -1.29019   1.57242 )
Epeak [keV] : 72.6505      ( -46.5543 -72.6503 )
Norm@50keV  : 3.44005E-02    ( -0.0344017   0.165804 )
------------------------------------------------------------
#Fit statistic : Chi-Squared =          64.50 using 59 PHA bins.
# Reduced chi-squared =          1.152 for     56 degrees of freedom
# Null hypothesis probability =   2.036946e-01

Photon flux (15-150 keV)    in 1 sec: 1.82764 ( -0.36021  0.35795 ) ph/cm2/s
Energy fluence (15-150 keV)             : 9.43865e-08 ( -3.1676e-08  2.08075e-08 ) ergs/cm2
Time-resolved spectra
Distribution
T90 vs. Hardness ratio plot
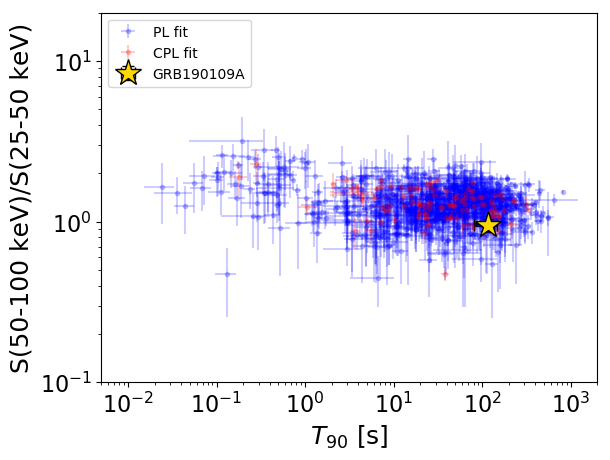
T90                                   = 115.008 sec.
Hardness ratio (energy fluence ratio) = 0.94920534386
S(15-50 keV) vs. S(50-150 keV) plot
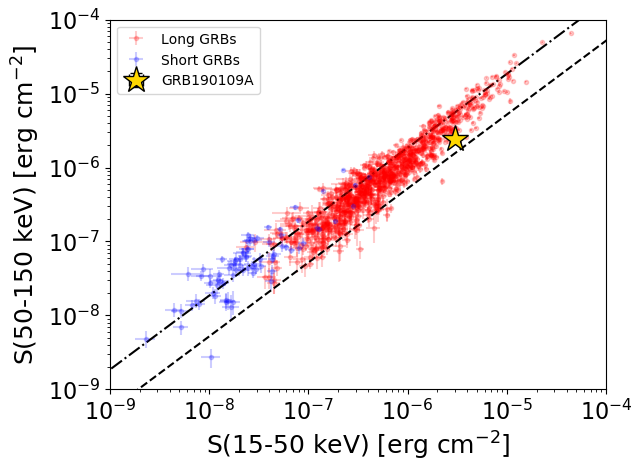
S(15-50 keV)  = 3.0010334e-06
S(50-150 keV) = 2.4516496e-06
The dash-dotted line and the dashed line traces the fluences calculated from the Band function with Epeak = 15 and 150 keV, respectively. Both lines assume a canonical values of alpha = -1 and beta = -2.5.
Mask shadow pattern
IMX = 1.653252734593688E-01, IMY = -6.202629123611765E-01
Spacecraft aspect plot
Bright source in the pre-burst/pre-slew/post-slew images
Pre-burst image of 15-350 keV band
Time interval of the image:
-239.000000 5.868000

# RAcent  DECcent POSerr Theta    Phi  PeakCts   SNR AngSep     Name
#  [deg]    [deg]    ['] [deg]  [deg]                   [']
308.0959  40.9137    3.2  49.6  -27.7   2.0539   3.6    2.4	Cyg X-3
326.3993  38.3017    0.0  35.3  -26.3   0.4438   1.4   10.8	Cyg X-2
 30.0973  15.8777    2.4  27.5  119.5   1.5027   4.8 ------	UNKNOWN
 13.4795  36.2126    2.5  19.1   55.8   1.1385   4.6 ------	UNKNOWN
 28.4048 -24.3842    2.7  51.7  173.5   3.1030   4.2 ------	UNKNOWN
327.0795  50.4806    2.7  40.6   -8.4   1.4210   4.2 ------	UNKNOWN
Pre-slew background subtracted image of 15-350 keV band
Time interval of the image:
5.868000 105.700600

# RAcent  DECcent POSerr Theta    Phi  PeakCts   SNR AngSep     Name
#  [deg]    [deg]    ['] [deg]  [deg]                   [']
308.0456  40.8425    6.7  49.6  -27.8  -0.5601  -1.7    7.2	Cyg X-3
326.1583  38.1848    6.6  35.4  -26.6   0.3478   1.7    8.2	Cyg X-2
 33.2144  38.1113    0.4  32.7   75.1   9.7035  29.2 ------	UNKNOWN
345.2162  63.8784    2.1  45.0   15.1   1.6219   5.5 ------	UNKNOWN
 18.5578  18.1042    2.4  16.2  119.7   0.8024   4.8 ------	UNKNOWN
 15.6440 -26.9911    2.4  49.1 -171.5   1.6885   4.8 ------	UNKNOWN
  6.6721 -16.1770    2.1  36.7 -163.1   1.0400   5.4 ------	UNKNOWN
295.2937  50.0896    2.0  59.5  -17.8   5.2771   5.8 ------	UNKNOWN
307.8753  32.8062    3.1  49.1  -38.4   1.6334   3.8 ------	UNKNOWN
310.7987  21.7621    2.3  47.2  -53.4   3.3137   5.0 ------	UNKNOWN
Post-slew image of 15-350 keV band
Time interval of the image:
158.300590 963.082300

# RAcent  DECcent POSerr Theta    Phi  PeakCts   SNR AngSep     Name
#  [deg]    [deg]    ['] [deg]  [deg]                   [']
212.0899  86.0079    4.1  55.9   10.8   8.0669   2.8 ------	UNKNOWN
 40.9445  61.4402    0.4  23.8   19.9  19.1308  30.3 ------	UNKNOWN
357.9866  67.6430    2.8  35.4  -11.5   2.9164   4.1 ------	UNKNOWN
309.9905  72.4478    2.8  51.9  -11.6   5.5958   4.1 ------	UNKNOWN