Analysis Summary
Notes:
- 1) No attempt has been made to eliminate the non-significant decimal places.
- 2) This batgrbproduct analysis is done using the HEASARC data.
- 3) This batgrbproduct analysis is using the flight position for the mask-weighting calculation.
======================================================================
BAT GRB EVENT DATA PROCESSING REPORT
Process Script Ver: batgrbproduct v2.46
Process Start Time: Sun Mar 17 22:53:57 EDT 2019
Host Name: bat1
Current Working Dir: /local/data/bat1/alien/Swift_3rdBATcatalog/event/batevent_reproc/trigger882809
======================================================================
Trigger: 00882809 Segment: 000
BAT Trigger Time: 568727791.424 [s; MET]
Trigger Stop: 568727792.448 [s; MET]
UTC: 2019-01-09T11:56:09.203160 [includes UTCF correction]
Where From?: TDRSS position message
BAT
RA: 55.5953879141201 Dec: 63.5778852049672 [deg; J2000]
Catalogged Source?: NO
Point Source?: YES
GRB Indicated?: YES [ by BAT flight software ]
Image S/N Ratio: 8.64
Image Trigger?: NO
Rate S/N Ratio: 15.0332963783729 [ if not an image trigger ]
Image S/N Ratio: 8.64
Analysis Position: [ source = BAT ]
RA: 55.5953879141201 Dec: 63.5778852049672 [deg; J2000]
Refined Position: [ source = BAT pre-slew burst ]
RA: 55.5531692571662 Dec: 63.595502333732 [deg; J2000]
{ 03h 42m 12.8s , +63d 35' 43.8" }
+/- 1.42340065785624 [arcmin] (estimated 90% radius based on SNR)
+/- 0.558298739749023 [arcmin] (formal 1-sigma fit error)
SNR: 18.3687488754915
Angular difference between the analysis and refined position is 1.545017 arcmin
Partial Coding Fraction: 0.609375 [ including projection effects ]
Duration
T90: 6.51199996471405 +/- 0.79070601675249
Measured from: -3.56000006198883
to: 2.95199990272522 [s; relative to TRIGTIME]
T50: 2.81599986553192 +/- 0.862229655679745
Measured from: -1.19599997997284
to: 1.61999988555908 [s; relative to TRIGTIME]
Fluence
Peak Flux (peak 1 second)
Measured from: -0.124000072479248
to: 0.875999927520752 [s; relative to TRIGTIME]
Total Fluence
Measured from: -4.25999999046326
to: 3.30799996852875 [s; relative to TRIGTIME]
Band 1 Band 2 Band 3 Band 4
15-25 25-50 50-100 100-350 keV
Total 0.228417 0.280549 0.213941 0.054848
0.023925 0.024257 0.020550 0.016799 [error]
Peak 0.056678 0.068414 0.060676 0.010642
0.009377 0.009620 0.008211 0.006128 [error]
[ fluence units of on-axis counts / fully illuminated detector ]
======================================================================
====== Table of the duration information =============================
Value tstart tstop
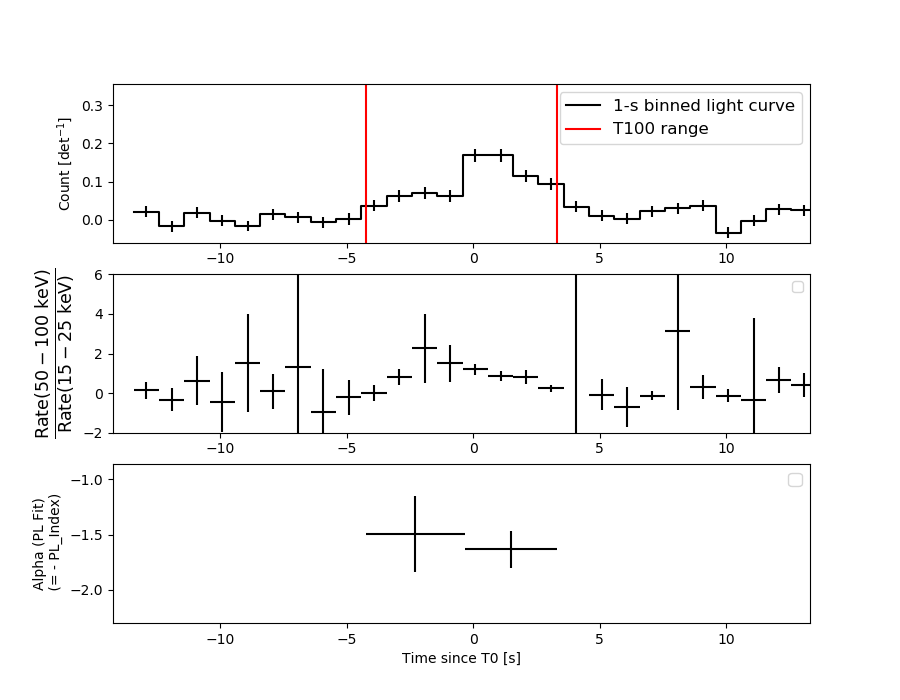
T100 7.568 -4.260 3.308
T90 6.512 -3.560 2.952
T50 2.816 -1.196 1.620
Peak 1.000 -0.124 0.876
====== Spectral Analysis Summary =====================================
Model : spectral model: simple power-law (PL) and cutoff power-law (CPL)
Ph_index : photon index: E^{Ph_index}
Ph_90err : 90% error of the photon index
Epeak : Epeak in keV
Epeak_90err: 90% error of Epeak
Norm : normalization at 50 keV in both the PL model and CPL model
Nomr_90err : 90% error of the normalization
chi2 : Chi-Squared
dof : degree of freedo
=== Time-averaged spectral analysis ===
(Best model with acceptable fit: PL)
Model Ph_index Ph_90err_low Ph_90err_hi Epeak Epeak_90err_low Epeak_90err_hi Norm Nomr_90err_low Norm_90err_hi chi2 dof
PL -1.591 -0.160 0.158 - - - 6.73e-03 -6.40e-04 6.36e-04 65.690 57
CPL -1.217 -0.455 0.716 101.068 -39.385 -101.068 1.06e-02 -4.31e-03 1.40e-02 64.650 56
=== 1-s peak spectral analysis ===
(Best model with acceptable fit: PL)
Model Ph_index Ph_90err_low Ph_90err_hi Epeak Epeak_90err_low Epeak_90err_hi Norm Nomr_90err_low Norm_90err_hi chi2 dof
PL -1.515 -0.230 0.227 - - - 1.34e-02 -1.86e-03 1.85e-03 63.350 57
CPL -1.131 -0.454 0.959 112.562 -51.879 -112.562 2.10e-02 -9.27e-03 4.26e-02 62.700 56
=== Fluence/Peak Flux Summary ===
Model Band1 Band2 Band3 Band4 Band5 Total
15-25 25-50 50-100 100-350 15-150 15-350 keV
Fluence PL 7.09e-08 1.23e-07 1.64e-07 4.43e-07 4.77e-07 8.01e-07 erg/cm2
90%_error_low -1.05e-08 -1.16e-08 -2.04e-08 -1.06e-07 -4.85e-08 -1.25e-07 erg/cm2
90%_error_hi 1.09e-08 1.15e-08 2.03e-08 1.27e-07 4.90e-08 1.41e-07 erg/cm2
Peak flux PL 5.58e-01 5.56e-01 3.89e-01 4.31e-01 1.67e+00 1.93e+00 ph/cm2/s
90%_error_low -1.24e-01 -8.07e-02 -6.73e-02 -1.33e-01 -2.31e-01 -2.65e-01 ph/cm2/s
90%_error_hi 1.31e-01 7.99e-02 6.65e-02 1.65e-01 2.32e-01 2.66e-01 ph/cm2/s
Fluence CPL 6.71e-08 1.28e-07 1.67e-07 2.49e-07 4.63e-07 6.11e-07 erg/cm2
90%_error_low -1.23e-08 -1.44e-08 -2.16e-08 -1.46e-07 -5.46e-08 -1.56e-07 erg/cm2
90%_error_hi 1.24e-08 1.49e-08 2.20e-08 2.30e-07 5.44e-08 2.43e-07 erg/cm2
Peak flux CPL 5.23e-01 5.79e-01 4.03e-01 2.79e-01 1.65e+00 1.78e+00 ph/cm2/s
90%_error_low -1.43e-01 -9.33e-02 -7.36e-02 -1.69e-01 -2.36e-01 -3.03e-01 ph/cm2/s
90%_error_hi 1.48e-01 9.78e-02 7.63e-02 2.04e-01 2.36e-01 3.26e-01 ph/cm2/s
======================================================================
Image
Pre-slew 15.0-350.0 keV image (Event data)
#   RAcent    DECcent   POSerr    Theta     Phi              Peak Cts       SNR   Name
   55.5532    63.5955   0.0105    28.7958    31.2639         0.8041735     18.369 TRIG_00882809

Foreground time interval of the image:
 -4.260   3.308 (delta_t =   7.568 [sec])
Background time interval of the image:
-239.424  -4.260 (delta_t = 235.164 [sec])
Light Curves
Note: The mask-weighted lightcurves have units of either count/det or counts/sec/det, where a det is 0.4 x 0.4 = 0.16 sq cm.
Full-time range; 1 s binning
Other quick-look light curves:
- 64 ms binning (zoomed)
- 16 ms binning (zoomed)
- 8 ms binning (zoomed)
- 2 ms binning (zoomed)
- SN=5 or 10 s binning (full-time range)
- Raw light curve
Spectra
- 64 ms binning (zoomed)
- 16 ms binning (zoomed)
- 8 ms binning (zoomed)
- 2 ms binning (zoomed)
- SN=5 or 10 s binning (full-time range)
- Raw light curve
Spectra
Notes:
- 1) The fitting includes the systematic errors.
- 2) When the burst includes telescope slew time periods, the fitting uses an average response file made from multiple 5-s response files through out the slew time plus single time preiod for the non-slew times, and weighted by the total counts in the corresponding time period using addrmf. An average response file is needed becuase a spectral fit using the pre-slew DRM will introduce some errors in both a spectral shape and a normalization if the PHA file contains a lot of the slew/post-slew time interval.
- 3) For fits to more complicated models (e.g. a power-law over a cutoff power-law), the BAT team has decided to require a chi-square improvement of more than 6 for each extra dof.
Time averaged spectrum fit using the average DRM
Power-law model

Time interval is from   -4.260 sec. to    3.308 sec.

Spectral model in power-law:
------------------------------------------------------------
Parameters  : value       lower 90%   higher 90%
Photon index: -1.59103     ( -0.159718   0.157829 )
Norm@50keV  : 6.73366E-03    ( -0.000640211   0.000635611 )
------------------------------------------------------------
#Fit statistic : Chi-Squared =          65.69 using 59 PHA bins.
# Reduced chi-squared =          1.152 for     57 degrees of freedom
# Null hypothesis probability =   2.011149e-01

Photon flux (15-150 keV)    in 7.568 sec: 0.862949 ( -0.079953  0.080062 ) ph/cm2/s
Energy fluence (15-150 keV)             : 4.77179e-07 ( -4.85011e-08  4.90213e-08 ) ergs/cm2
Cutoff power-law model
Time interval is from   -4.260 sec. to    3.308 sec.
Spectral model in the cutoff power-law:
------------------------------------------------------------
Parameters  : value       lower 90%   higher 90%
Photon index: -1.21736     ( -0.454527   0.71624 )
Epeak [keV] : 101.068      ( -39.3872 -101.07 )
Norm@50keV  : 1.05521E-02    ( -0.00430543   0.0139967 )
------------------------------------------------------------
#Fit statistic : Chi-Squared =          64.65 using 59 PHA bins.
# Reduced chi-squared =          1.154 for     56 degrees of freedom
# Null hypothesis probability =   2.002077e-01

Photon flux (15-150 keV)    in 7.568 sec: 0.849427 ( -0.083486  0.083066 ) ph/cm2/s
Energy fluence (15-150 keV)             : 4.62776e-07 ( -5.46158e-08  5.44386e-08 ) ergs/cm2
1-s peak spectrum fit
Power-law model
Time interval is from   -0.124 sec. to    0.876 sec.

Spectral model in power-law:
------------------------------------------------------------
Parameters  : value       lower 90%   higher 90%
Photon index: -1.51542     ( -0.229944   0.227149 )
Norm@50keV  : 1.33518E-02    ( -0.00186385   0.00185082 )
------------------------------------------------------------
#Fit statistic : Chi-Squared =          63.35 using 59 PHA bins.
# Reduced chi-squared =          1.111 for     57 degrees of freedom
# Null hypothesis probability =   2.624219e-01

Photon flux (15-150 keV)    in 1 sec: 1.67388 ( -0.23135  0.23171 ) ph/cm2/s
Energy fluence (15-150 keV)             : 1.26366e-07 ( -1.90165e-08  1.92034e-08 ) ergs/cm2
Cutoff power-law model

Time interval is from   -0.124 sec. to    0.876 sec.
Spectral model in the cutoff power-law:
------------------------------------------------------------
Parameters  : value       lower 90%   higher 90%
Photon index: -1.13125     ( -0.453801   0.958755 )
Epeak [keV] : 112.562      ( -51.8791 -112.562 )
Norm@50keV  : 2.10264E-02    ( -0.00927163   0.0426193 )
------------------------------------------------------------
#Fit statistic : Chi-Squared =          62.70 using 59 PHA bins.
# Reduced chi-squared =          1.120 for     56 degrees of freedom
# Null hypothesis probability =   2.507521e-01

Photon flux (15-150 keV)    in 1 sec: 1.65283 ( -0.23597  0.23595 ) ph/cm2/s
Energy fluence (15-150 keV)             : 1.23254e-07 ( -2.04169e-08  2.03181e-08 ) ergs/cm2
Time-resolved spectra
Distribution
T90 vs. Hardness ratio plot
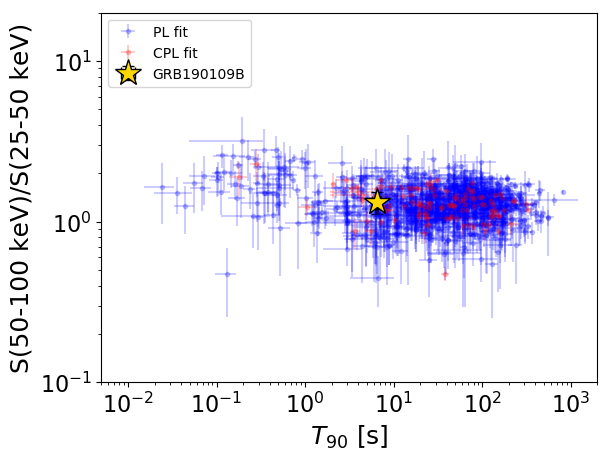
T90                                   = 6.512 sec.
Hardness ratio (energy fluence ratio) = 1.32776083156
S(15-50 keV) vs. S(50-150 keV) plot
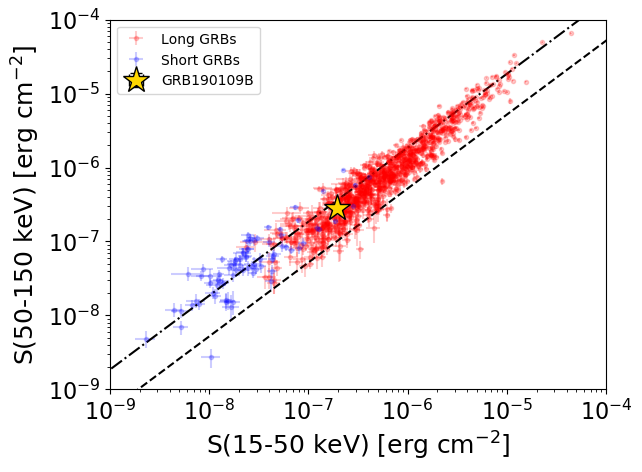
S(15-50 keV)  = 1.9407815e-07
S(50-150 keV) = 2.831033e-07
The dash-dotted line and the dashed line traces the fluences calculated from the Band function with Epeak = 15 and 150 keV, respectively. Both lines assume a canonical values of alpha = -1 and beta = -2.5.
Mask shadow pattern
IMX = 4.698404545818621E-01, IMY = -2.852622809348173E-01
Spacecraft aspect plot
Bright source in the pre-burst/pre-slew/post-slew images
Pre-burst image of 15-350 keV band
Time interval of the image:
-239.424000 -4.260000

# RAcent  DECcent POSerr Theta    Phi  PeakCts   SNR AngSep     Name
#  [deg]    [deg]    ['] [deg]  [deg]                   [']
 40.9369  61.4302    0.5  23.8   19.9   5.3637  24.3 ------	UNKNOWN
349.2280  75.7389    2.7  42.5   -4.0   1.4761   4.3 ------	UNKNOWN
 36.8211  -4.6307    2.4  42.9 -174.6   1.9713   4.9 ------	UNKNOWN
Pre-slew background subtracted image of 15-350 keV band
Time interval of the image:
-4.260000 3.308000

# RAcent  DECcent POSerr Theta    Phi  PeakCts   SNR AngSep     Name
#  [deg]    [deg]    ['] [deg]  [deg]                   [']
 55.5532  63.5955    0.6  28.8   31.3   0.8040  18.4 ------	UNKNOWN
333.7544  50.9720    2.3  43.0  -41.9   0.3348   5.0 ------	UNKNOWN
Post-slew image of 15-350 keV band
Time interval of the image:
71.076600 962.660900

# RAcent  DECcent POSerr Theta    Phi  PeakCts   SNR AngSep     Name
#  [deg]    [deg]    ['] [deg]  [deg]                   [']
159.9101  56.8508    2.8  46.4   25.0   5.6112   4.1 ------	UNKNOWN
 97.5659  61.3008    3.4  19.2   55.6   2.4457   3.4 ------	UNKNOWN
 40.9262  61.4328    0.3   7.1 -123.1  21.2468  35.3 ------	UNKNOWN