Analysis Summary
Notes:
- 1) No attempt has been made to eliminate the non-significant decimal places.
- 2) This batgrbproduct analysis is done using the HEASARC data.
- 3) This batgrbproduct analysis is using the flight position for the mask-weighting calculation.
======================================================================
BAT GRB EVENT DATA PROCESSING REPORT
Process Script Ver: batgrbproduct v2.46
Process Start Time: Thu Mar 21 17:40:51 EDT 2019
Host Name: bat1
Current Working Dir: /local/data/bat1/alien/Swift_3rdBATcatalog/event/batevent_reproc/trigger883012
======================================================================
Trigger: 00883012 Segment: 000
BAT Trigger Time: 568833910.528 [s; MET]
Trigger Stop: 568833911.04 [s; MET]
UTC: 2019-01-10T17:24:48.300500 [includes UTCF correction]
Where From?: TDRSS position message
BAT
RA: 276.881511087457 Dec: -53.6765232636808 [deg; J2000]
Catalogged Source?: NO
Point Source?: YES
GRB Indicated?: YES [ by BAT flight software ]
Image S/N Ratio: 7.06
Image Trigger?: NO
Rate S/N Ratio: 14.7309198626562 [ if not an image trigger ]
Image S/N Ratio: 7.06
Analysis Position: [ source = BAT ]
RA: 276.881511087457 Dec: -53.6765232636808 [deg; J2000]
Refined Position: [ source = BAT pre-slew burst ]
RA: 276.937349271676 Dec: -53.6425548905936 [deg; J2000]
{ 18h 27m 45.0s , -53d 38' 33.2" }
+/- 0.798626147699119 [arcmin] (estimated 90% radius based on SNR)
+/- 0.27757308637701 [arcmin] (formal 1-sigma fit error)
SNR: 41.9399230801361
Angular difference between the analysis and refined position is 2.845236 arcmin
Partial Coding Fraction: 0.4335938 [ including projection effects ]
Duration
T90: 9.30400002002716 +/- 0.839094768973495
Measured from: 0.151999950408936
to: 9.4559999704361 [s; relative to TRIGTIME]
T50: 3.09999990463257 +/- 0.289806726624847
Measured from: 2.70000004768372
to: 5.79999995231628 [s; relative to TRIGTIME]
Fluence
Peak Flux (peak 1 second)
Measured from: 4.71599996089935
to: 5.71599996089935 [s; relative to TRIGTIME]
Total Fluence
Measured from: -0.796000003814697
to: 10.9960000514984 [s; relative to TRIGTIME]
Band 1 Band 2 Band 3 Band 4
15-25 25-50 50-100 100-350 keV
Total 1.096527 1.512993 1.040996 0.220600
0.052561 0.047340 0.040523 0.029454 [error]
Peak 0.230468 0.415133 0.305783 0.091921
0.018361 0.019382 0.017403 0.011466 [error]
[ fluence units of on-axis counts / fully illuminated detector ]
======================================================================
====== Table of the duration information =============================
Value tstart tstop
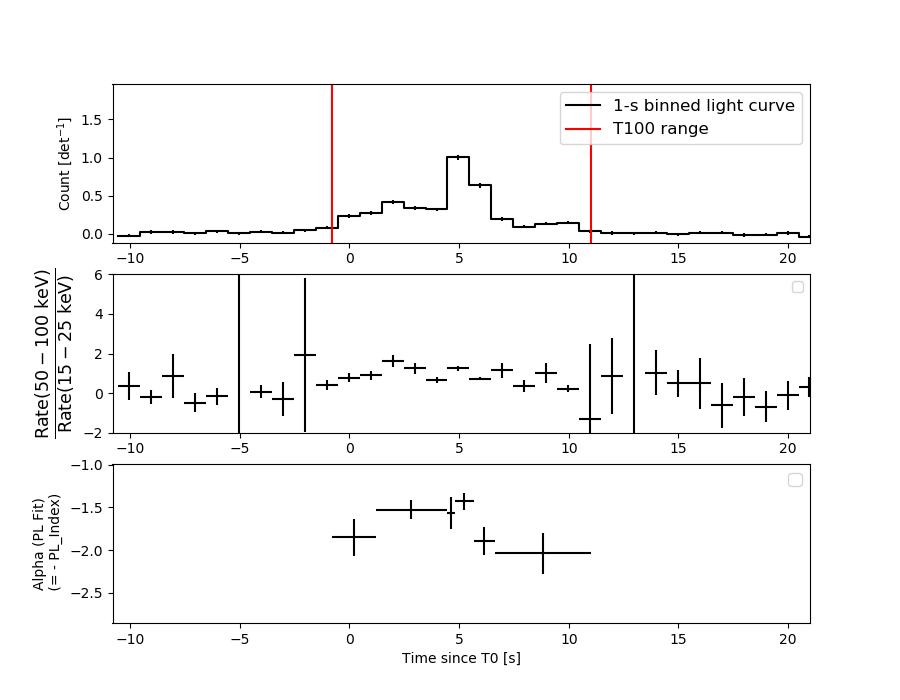
T100 11.792 -0.796 10.996
T90 9.304 0.152 9.456
T50 3.100 2.700 5.800
Peak 1.000 4.716 5.716
====== Spectral Analysis Summary =====================================
Model : spectral model: simple power-law (PL) and cutoff power-law (CPL)
Ph_index : photon index: E^{Ph_index}
Ph_90err : 90% error of the photon index
Epeak : Epeak in keV
Epeak_90err: 90% error of Epeak
Norm : normalization at 50 keV in both the PL model and CPL model
Nomr_90err : 90% error of the normalization
chi2 : Chi-Squared
dof : degree of freedo
=== Time-averaged spectral analysis ===
(Best model with acceptable fit: PL)
Model Ph_index Ph_90err_low Ph_90err_hi Epeak Epeak_90err_low Epeak_90err_hi Norm Nomr_90err_low Norm_90err_hi chi2 dof
PL -1.663 -0.070 0.070 - - - 2.26e-02 -8.66e-04 8.65e-04 51.830 57
CPL -1.367 -0.273 0.291 111.682 -31.579 484.718 3.13e-02 -8.00e-03 1.16e-02 48.390 56
=== 1-s peak spectral analysis ===
(Best model with acceptable fit: PL)
Model Ph_index Ph_90err_low Ph_90err_hi Epeak Epeak_90err_low Epeak_90err_hi Norm Nomr_90err_low Norm_90err_hi chi2 dof
PL -1.430 -0.093 0.093 - - - 7.34e-02 -3.98e-03 3.98e-03 45.380 57
CPL -1.278 -0.202 0.371 250.199 -250.199 -250.199 8.71e-02 -1.70e-02 4.38e-02 44.830 56
=== Fluence/Peak Flux Summary ===
Model Band1 Band2 Band3 Band4 Band5 Total
15-25 25-50 50-100 100-350 15-150 15-350 keV
Fluence PL 3.96e-07 6.58e-07 8.32e-07 2.10e-06 2.47e-06 3.98e-06 erg/cm2
90%_error_low -2.75e-08 -2.74e-08 -4.09e-08 -2.19e-07 -9.86e-08 -2.48e-07 erg/cm2
90%_error_hi 2.82e-08 2.73e-08 4.08e-08 2.35e-07 9.89e-08 2.60e-07 erg/cm2
Peak flux PL 2.83e+00 2.96e+00 2.20e+00 2.64e+00 9.01e+00 1.06e+01 ph/cm2/s
90%_error_low -2.80e-01 -1.83e-01 -1.42e-01 -3.39e-01 -5.12e-01 -5.78e-01 ph/cm2/s
90%_error_hi 2.89e-01 1.82e-01 1.41e-01 3.68e-01 5.13e-01 5.79e-01 ph/cm2/s
Fluence CPL 3.72e-07 6.74e-07 8.50e-07 1.40e-06 2.42e-06 3.30e-06 erg/cm2
90%_error_low -3.42e-08 -3.09e-08 -4.46e-08 -4.16e-07 -1.09e-07 -4.28e-07 erg/cm2
90%_error_hi 3.49e-08 3.13e-08 4.51e-08 6.32e-07 1.09e-07 6.31e-07 erg/cm2
Peak flux CPL 2.25e+00 1.63e+00 7.90e-01 6.50e-01 5.01e+00 4.61e+00 ph/cm2/s
90%_error_low -3.16e-01 -1.98e-01 -1.73e-01 -1.33e-01 -6.39e-01 -4.06e-02 ph/cm2/s
90%_error_hi 3.78e-01 2.22e-01 1.20e-01 1.84e-01 6.23e-01 1.39e+00 ph/cm2/s
======================================================================
Image
Pre-slew 15.0-350.0 keV image (Event data)
#   RAcent    DECcent   POSerr    Theta     Phi              Peak Cts       SNR   Name
  276.9373   -53.6426   0.0046    35.1681   -48.9788         4.3489255     41.940 TRIG_00883012

Foreground time interval of the image:
 -0.796  10.996 (delta_t =  11.792 [sec])
Background time interval of the image:
-239.528  -0.796 (delta_t = 238.732 [sec])
Light Curves
Note: The mask-weighted lightcurves have units of either count/det or counts/sec/det, where a det is 0.4 x 0.4 = 0.16 sq cm.
Full-time range; 1 s binning
Other quick-look light curves:
- 64 ms binning (zoomed)
- 16 ms binning (zoomed)
- 8 ms binning (zoomed)
- 2 ms binning (zoomed)
- SN=5 or 10 s binning (full-time range)
- Raw light curve
Spectra
- 64 ms binning (zoomed)
- 16 ms binning (zoomed)
- 8 ms binning (zoomed)
- 2 ms binning (zoomed)
- SN=5 or 10 s binning (full-time range)
- Raw light curve
Spectra
Notes:
- 1) The fitting includes the systematic errors.
- 2) When the burst includes telescope slew time periods, the fitting uses an average response file made from multiple 5-s response files through out the slew time plus single time preiod for the non-slew times, and weighted by the total counts in the corresponding time period using addrmf. An average response file is needed becuase a spectral fit using the pre-slew DRM will introduce some errors in both a spectral shape and a normalization if the PHA file contains a lot of the slew/post-slew time interval.
- 3) For fits to more complicated models (e.g. a power-law over a cutoff power-law), the BAT team has decided to require a chi-square improvement of more than 6 for each extra dof.
Time averaged spectrum fit using the average DRM
Power-law model
Time interval is from   -0.796 sec. to   10.996 sec.

Spectral model in power-law:
------------------------------------------------------------
Parameters  : value       lower 90%   higher 90%
Photon index: -1.66255     ( -0.069849   0.0695597 )
Norm@50keV  : 2.25587E-02    ( -0.000866192   0.00086533 )
------------------------------------------------------------
#Fit statistic : Chi-Squared =          51.83 using 59 PHA bins.
# Reduced chi-squared =         0.9094 for     57 degrees of freedom
# Null hypothesis probability =   6.686763e-01

Photon flux (15-150 keV)    in 11.79 sec: 2.95803 ( -0.12268  0.1231 ) ph/cm2/s
Energy fluence (15-150 keV)             : 2.47089e-06 ( -9.8621e-08  9.89373e-08 ) ergs/cm2
Cutoff power-law model
Time interval is from   -0.796 sec. to   10.996 sec.
Spectral model in the cutoff power-law:
------------------------------------------------------------
Parameters  : value       lower 90%   higher 90%
Photon index: -1.36677     ( -0.272546   0.291101 )
Epeak [keV] : 111.682      ( -31.5797 484.718 )
Norm@50keV  : 3.13382E-02    ( -0.00800443   0.0116357 )
------------------------------------------------------------
#Fit statistic : Chi-Squared =          48.39 using 59 PHA bins.
# Reduced chi-squared =         0.8640 for     56 degrees of freedom
# Null hypothesis probability =   7.552493e-01

Photon flux (15-150 keV)    in 11.79 sec: 2.90060 ( -0.13272  0.13316 ) ph/cm2/s
Energy fluence (15-150 keV)             : 2.42138e-06 ( -1.09351e-07  1.08869e-07 ) ergs/cm2
1-s peak spectrum fit
Power-law model
Time interval is from    4.716 sec. to    5.716 sec.

Spectral model in power-law:
------------------------------------------------------------
Parameters  : value       lower 90%   higher 90%
Photon index: -1.43002     ( -0.0933957   0.0934425 )
Norm@50keV  : 7.34309E-02    ( -0.00398025   0.00397768 )
------------------------------------------------------------
#Fit statistic : Chi-Squared =          45.38 using 59 PHA bins.
# Reduced chi-squared =         0.7962 for     57 degrees of freedom
# Null hypothesis probability =   8.662063e-01

Photon flux (15-150 keV)    in 1 sec: 9.00555 ( -0.51185  0.51272 ) ph/cm2/s
Energy fluence (15-150 keV)             : 7.05407e-07 ( -4.11441e-08  4.12824e-08 ) ergs/cm2
Cutoff power-law model
Time interval is from    4.716 sec. to    5.716 sec.
Spectral model in the cutoff power-law:
------------------------------------------------------------
Parameters  : value       lower 90%   higher 90%
Photon index: -1.27771     ( -0.201629   0.371361 )
Epeak [keV] : 250.199      ( -250.212 -250.212 )
Norm@50keV  : 8.71339E-02    ( -0.0169751   0.0437542 )
------------------------------------------------------------
#Fit statistic : Chi-Squared =          44.83 using 59 PHA bins.
# Reduced chi-squared =         0.8005 for     56 degrees of freedom
# Null hypothesis probability =   8.579353e-01

Photon flux (15-150 keV)    in 1 sec: 5.01071 ( -0.63919  0.62336 ) ph/cm2/s
Energy fluence (15-150 keV)             : 6.99471e-07 ( -4.37033e-08  4.34284e-08 ) ergs/cm2
Time-resolved spectra
Distribution
T90 vs. Hardness ratio plot
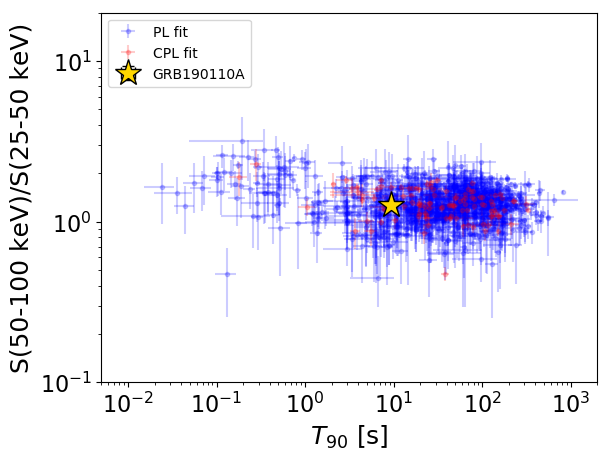
T90                                   = 9.304 sec.
Hardness ratio (energy fluence ratio) = 1.26357201135
S(15-50 keV) vs. S(50-150 keV) plot
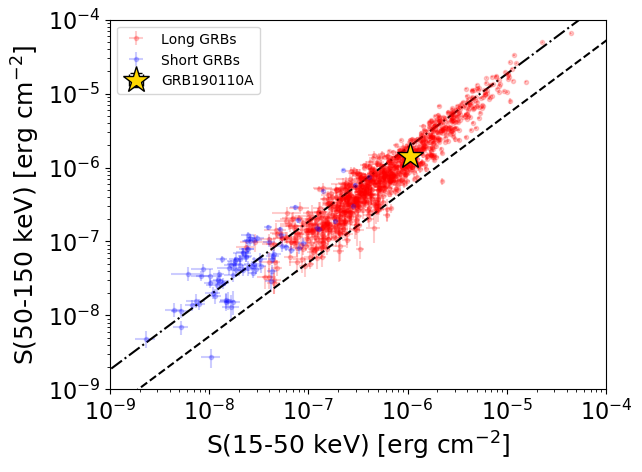
S(15-50 keV)  = 1.0540736e-06
S(50-150 keV) = 1.4168386e-06
The dash-dotted line and the dashed line traces the fluences calculated from the Band function with Epeak = 15 and 150 keV, respectively. Both lines assume a canonical values of alpha = -1 and beta = -2.5.
Mask shadow pattern
IMX = 4.624486795109473E-01, IMY = 5.315895794643281E-01
Spacecraft aspect plot
Bright source in the pre-burst/pre-slew/post-slew images
Pre-burst image of 15-350 keV band
Time interval of the image:
-239.528000 -0.796000

# RAcent  DECcent POSerr Theta    Phi  PeakCts   SNR AngSep     Name
#  [deg]    [deg]    ['] [deg]  [deg]                   [']
170.3196 -60.6230  136.6  52.7   25.4   0.1665   0.1    0.1	Cen X-3
186.6224 -62.6780    2.8  45.5   21.0   3.6028   4.1    5.6	GX 301-2
244.9743 -15.6433    0.1  16.6 -168.9  32.3409  79.9    0.4	Sco X-1
256.0145 -37.8630  150.7  15.5  -69.9  -0.0320  -0.1    1.7	4U 1700-377
256.4133 -36.4288  252.9  15.4  -75.4   0.0191   0.0    1.1	GX 349+2
262.8549 -24.8867   11.9  22.0 -110.6   0.4571   1.0   11.9	GX 1+4
264.7454 -44.3077   13.9  24.0  -59.6   0.4095   0.8    8.5	4U 1735-44
268.4874  -1.3643   21.7  40.9 -140.8  -0.3910  -0.5    8.9	SW J1753.5-0127
270.4659 -25.1933   29.4  28.3 -104.1   0.2318   0.4   12.0	GX 5-1
270.3496 -25.7839    4.2  28.0 -103.0   1.6259   2.8    3.5	GRS 1758-258
274.1773 -14.1614   13.8  36.5 -119.5   0.6291   0.8   12.5	GX 17+2
275.9871 -30.4875    4.1  31.7  -91.3   2.1249   2.8    7.9	H1820-303
262.9847 -33.8356   48.2  20.4  -86.1  -0.1164  -0.2    0.2	GX 354-0
201.6867 -22.8549    2.3  34.0   85.4   4.1809   5.0 ------	UNKNOWN
222.8405 -34.0402    2.6  13.8   64.6   1.8793   4.4 ------	UNKNOWN
220.6696 -57.6123    3.5  29.2   10.5   1.6125   3.3 ------	UNKNOWN
250.4216  23.3608    3.1  55.7 -176.9   6.6022   3.7 ------	UNKNOWN
261.2342 -14.5275    2.4  26.4 -134.0   2.3017   4.8 ------	UNKNOWN
279.6716 -48.9400    3.1  35.2  -57.7   2.7931   3.8 ------	UNKNOWN
280.6687 -39.7480    2.3  34.7  -73.8   3.8947   5.1 ------	UNKNOWN
Pre-slew background subtracted image of 15-350 keV band
Time interval of the image:
-0.796000 10.996000

# RAcent  DECcent POSerr Theta    Phi  PeakCts   SNR AngSep     Name
#  [deg]    [deg]    ['] [deg]  [deg]                   [']
170.3395 -60.5789   15.5  52.7   25.4   0.1975   0.7    2.7	Cen X-3
186.3433 -62.7686   21.3  45.6   20.9   0.0651   0.5    8.6	GX 301-2
244.8780 -15.5708    3.3  16.6 -169.3  -0.2285  -3.5    7.2	Sco X-1
256.0835 -37.9859  136.1  15.6  -69.5  -0.0058  -0.1    9.7	4U 1700-377
256.4198 -36.4707    5.7  15.4  -75.3   0.1316   2.0    3.0	GX 349+2
262.9338 -24.6055   10.4  22.2 -111.2  -0.0855  -1.1    9.4	GX 1+4
264.9531 -44.4880    6.1  24.2  -59.3   0.1506   1.9    9.3	4U 1735-44
268.4833  -1.3315    0.0  41.0 -140.9   0.0844   0.6   10.0	SW J1753.5-0127
270.1378 -25.2213    0.0  28.0 -104.3  -0.1711  -1.7   11.7	GX 5-1
270.1422 -25.6191    7.3  27.9 -103.5   0.1574   1.6   11.4	GRS 1758-258
273.8641 -14.0105    9.3  36.3 -120.0   0.1549   1.2    8.4	GX 17+2
275.9040 -30.3309   23.8  31.6  -91.6  -0.0564  -0.5    2.4	H1820-303
263.1596 -33.6847    0.0  20.5  -86.5   0.1466   1.8   12.4	GX 354-0
193.7472 -26.5451    4.3  39.6   75.4   0.5774   2.7 ------	UNKNOWN
211.9301  -7.3170    2.4  34.8  118.2   0.5697   4.8 ------	UNKNOWN
171.6765 -62.3223    2.5  52.2   23.2   0.9960   4.5 ------	UNKNOWN
276.9373 -53.6426    0.3  35.2  -49.0   4.3494  42.0 ------	UNKNOWN
Post-slew image of 15-350 keV band
Time interval of the image: