Analysis Summary
Notes:
- 1) No attempt has been made to eliminate the non-significant decimal places.
- 2) This batgrbproduct analysis is done using the HEASARC data.
- 3) This batgrbproduct analysis is using the flight position for the mask-weighting calculation.
======================================================================
                  BAT GRB EVENT DATA PROCESSING REPORT
    Process Script Ver: batgrbproduct v2.46
    Process Start Time: Sun Mar 17 22:48:00 EDT 2019
             Host Name: bat1
   Current Working Dir: /local/data/bat1/alien/Swift_3rdBATcatalog/event/batevent_reproc/trigger883600
======================================================================

  Trigger: 00883600      Segment: 000

  BAT Trigger Time: 569128272   [s; MET]
      Trigger Stop: 569128448   [s; MET]
               UTC: 2019-01-14T03:10:49.754020    [includes UTCF correction]
       Where From?: TDRSS position message

  BAT
    RA: 65.5439596830878   Dec: 2.16981163299757  [deg; J2000]

     Catalogged Source?: NO
     Point Source?:      YES
     GRB Indicated?:     YES    [ by BAT flight software ]
     Image S/N Ratio:    7.28
     Image Trigger?:     YES
     Rate S/N Ratio:     0  [ if not an image trigger ]
     Image S/N Ratio:    7.28

  Analysis Position:   [ source = BAT ]
    RA: 65.5439596830878   Dec: 2.16981163299757  [deg; J2000]

  Refined Position:   [ source = BAT pre-slew burst ]
    RA: 65.5427191335137   Dec: 2.19548877595504  [deg; J2000]
        { 04h 22m 10.3s , +02d 11' 43.8" }
         +/- 1.65619964690288 [arcmin] (estimated 90% radius based on SNR)
         +/- 0.87371716239663 [arcmin] (formal 1-sigma fit error)
    SNR: 14.7944987225082

  Angular difference between the analysis and refined position is 1.542423 arcmin

  Partial Coding Fraction: 0.7890625    [ including projection effects ]

  Duration
     T90: 67.095999956131 +/- 9.82942278698472
        Measured from: 128.067999958992
                   to: 195.163999915123     [s; relative to TRIGTIME]
     T50: 37.0239999294281 +/- 7.78437533283271
        Measured from: 137.212000012398
                   to: 174.235999941826     [s; relative to TRIGTIME]


  Fluence
     Peak Flux  (peak 1 second)
        Measured from: 151.075999975204
                   to: 152.075999975204     [s; relative to TRIGTIME]
     Total Fluence
        Measured from: 126.399999976158
                   to: 199.580000042915     [s; relative to TRIGTIME]

             Band 1     Band 2     Band 3     Band 4
              15-25      25-50     50-100    100-350     keV
 Total     0.637893   0.554813   0.319688  -0.028791
           0.059708   0.061753   0.054119   0.046843 [error]
 Peak      0.023823   0.019453   0.017094   0.006931
           0.007658   0.007591   0.006786   0.005583 [error]

     [ fluence units of on-axis counts / fully illuminated detector ]

======================================================================


====== Table of the duration information =============================

        Value   tstart    tstop
T100   73.180  126.400  199.580
T90    67.096  128.068  195.164
T50    37.024  137.212  174.236
Peak    1.000  151.076  152.076


====== Spectral Analysis Summary =====================================

Model      : spectral model: simple power-law (PL) and cutoff power-law (CPL)
Ph_index   : photon index: E^{Ph_index}
Ph_90err   : 90% error of the photon index
Epeak      : Epeak in keV
Epeak_90err: 90% error of Epeak
Norm       : normalization at 50 keV in both the PL model and CPL model
Nomr_90err : 90% error of the normalization
chi2       : Chi-Squared
dof        : degree of freedo

=== Time-averaged spectral analysis ===
(Best model with acceptable fit: PL)

Model Ph_index Ph_90err_low Ph_90err_hi  Epeak  Epeak_90err_low  Epeak_90err_hi  Norm       Nomr_90err_low    Norm_90err_hi    chi2    dof
PL      -2.055    -0.226      0.211       -           -               -         1.19e-03     -1.86e-04          1.81e-04      48.290   57
CPL     -1.388    -0.722      0.964       36.531     -30.013       -36.531      2.97e-03     -2.97e-03          8.33e-03      46.230   56


=== 1-s peak spectral analysis ===
(Best model with acceptable fit: PL)

Model Ph_index Ph_90err_low Ph_90err_hi  Epeak  Epeak_90err_low  Epeak_90err_hi  Norm       Nomr_90err_low    Norm_90err_hi    chi2    dof
PL      -1.508     -0.672     0.648       -           -               -         4.34e-03     -1.56e-03          1.47e-03      39.610   57
CPL     -1.533     -0.650     0.679     9999.360    -9999.360      -9999.360      4.30e-03        N/A               N/A         39.620   56


=== Fluence/Peak Flux Summary ===

              Model    Band1     Band2     Band3     Band4     Band5     Total
                       15-25     25-50    50-100    100-350    15-150    15-350    keV
Fluence         PL   1.87e-07  2.46e-07  2.36e-07  4.05e-07  8.03e-07  1.07e-06   erg/cm2
      90%_error_low -2.82e-08 -2.89e-08 -4.92e-08 -1.43e-07 -1.14e-07 -2.08e-07   erg/cm2
      90%_error_hi   2.87e-08  2.87e-08  5.10e-08  1.88e-07  1.17e-07  2.43e-07   erg/cm2
Peak flux       PL   1.80e-01  1.80e-01  1.27e-01  1.42e-01  5.44e-01  6.29e-01   ph/cm2/s
      90%_error_low -9.70e-02 -6.53e-02 -5.80e-02 -9.78e-02 -1.80e-01 -2.09e-01   ph/cm2/s
      90%_error_hi   1.10e-01  6.17e-02  5.50e-02  1.80e-01  1.80e-01  2.14e-01   ph/cm2/s

Fluence        CPL   1.79e-07  2.67e-07  2.24e-07  1.26e-07  7.49e-07  7.97e-07   erg/cm2
      90%_error_low -3.09e-08 -3.58e-08 -6.05e-08 -9.44e-08 -1.21e-07 -1.60e-07   erg/cm2
      90%_error_hi   3.07e-08  3.92e-08  5.73e-08  3.86e-07  1.31e-07  4.02e-07   erg/cm2
Peak flux      CPL   1.85e-01  1.80e-01  1.26e-01  1.61e-01  5.46e-01  6.36e-01   ph/cm2/s
      90%_error_low     N/A   -6.52e-02     N/A       N/A   -1.84e-01 -2.24e-01   ph/cm2/s
      90%_error_hi      N/A    6.40e-02     N/A       N/A    1.80e-01  2.09e-01   ph/cm2/s

======================================================================
Image
Pre-slew 15.0-350.0 keV image (Event data)
#   RAcent    DECcent   POSerr    Theta     Phi              Peak Cts       SNR   Name
   65.5427     2.1955   0.0130    23.1849    34.3301         1.4600142     14.794 TRIG_00883600

Foreground time interval of the image:
126.400 185.101 (delta_t =  58.701 [sec])
Background time interval of the image:
-239.000 126.400 (delta_t = 365.400 [sec])
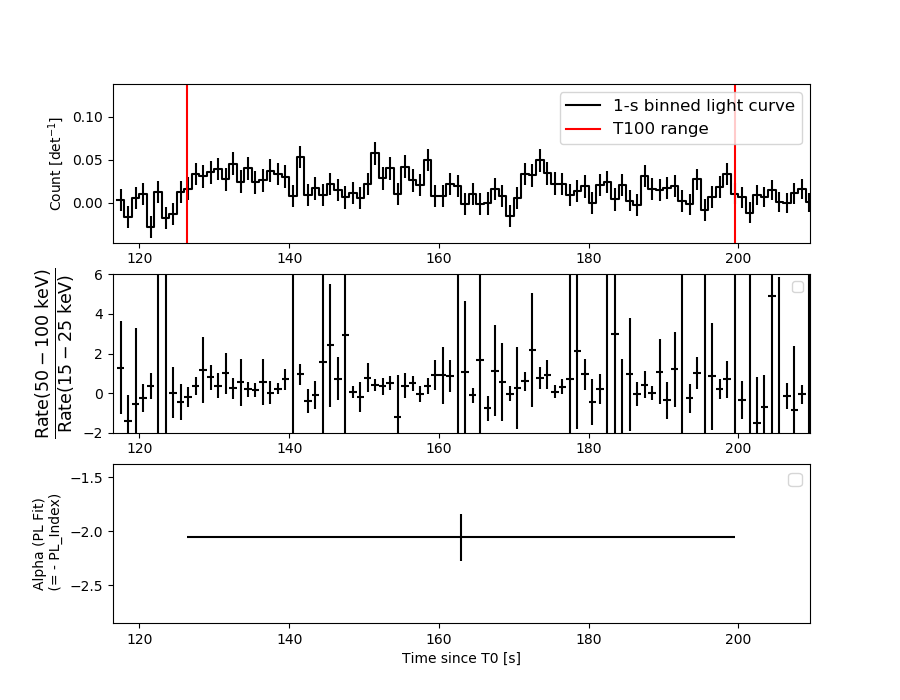
Light Curves
Note: The mask-weighted lightcurves have units of either count/det or counts/sec/det, where a det is 0.4 x 0.4 = 0.16 sq cm.
Full-time range; 1 s binning
Other quick-look light curves:
- 64 ms binning (zoomed)
- 16 ms binning (zoomed)
- 8 ms binning (zoomed)
- 2 ms binning (zoomed)
- SN=5 or 10 s binning (full-time range)
- Raw light curve
Spectra
- 64 ms binning (zoomed)
- 16 ms binning (zoomed)
- 8 ms binning (zoomed)
- 2 ms binning (zoomed)
- SN=5 or 10 s binning (full-time range)
- Raw light curve
Spectra
Notes:
- 1) The fitting includes the systematic errors.
- 2) When the burst includes telescope slew time periods, the fitting uses an average response file made from multiple 5-s response files through out the slew time plus single time preiod for the non-slew times, and weighted by the total counts in the corresponding time period using addrmf. An average response file is needed becuase a spectral fit using the pre-slew DRM will introduce some errors in both a spectral shape and a normalization if the PHA file contains a lot of the slew/post-slew time interval.
- 3) For fits to more complicated models (e.g. a power-law over a cutoff power-law), the BAT team has decided to require a chi-square improvement of more than 6 for each extra dof.
Time averaged spectrum fit using the average DRM
Power-law model
Time interval is from  126.400 sec. to  199.580 sec.

Spectral model in power-law:
------------------------------------------------------------
Parameters  : value       lower 90%   higher 90%
Photon index: -2.0555     ( -0.225798   0.210763 )
Norm@50keV  : 1.18608E-03    ( -0.000185557   0.000181408 )
------------------------------------------------------------
#Fit statistic : Chi-Squared =          48.29 using 59 PHA bins.
# Reduced chi-squared =         0.8472 for     57 degrees of freedom
# Null hypothesis probability =   7.875519e-01

Photon flux (15-150 keV)    in 73.18 sec: 0.182622 ( -0.020737  0.020738 ) ph/cm2/s
Energy fluence (15-150 keV)             : 8.03472e-07 ( -1.13785e-07  1.1713e-07 ) ergs/cm2
Cutoff power-law model

Time interval is from  126.400 sec. to  199.580 sec.
Spectral model in the cutoff power-law:
------------------------------------------------------------
Parameters  : value       lower 90%   higher 90%
Photon index: -1.38802     ( -0.722075   0.963758 )
Epeak [keV] : 36.5311      ( -30.0131 -36.5311 )
Norm@50keV  : 2.97046E-03    ( -0.00297044   0.00832533 )
------------------------------------------------------------
#Fit statistic : Chi-Squared =          46.23 using 59 PHA bins.
# Reduced chi-squared =         0.8255 for     56 degrees of freedom
# Null hypothesis probability =   8.209707e-01

Photon flux (15-150 keV)    in 73.18 sec: 0.178868 ( -0.021039  0.021116 ) ph/cm2/s
Energy fluence (15-150 keV)             : 7.49173e-07 ( -1.20967e-07  1.3103e-07 ) ergs/cm2
1-s peak spectrum fit
Power-law model
Time interval is from  151.076 sec. to  152.076 sec.

Spectral model in power-law:
------------------------------------------------------------
Parameters  : value       lower 90%   higher 90%
Photon index: -1.50802     ( -0.671833   0.647681 )
Norm@50keV  : 4.34450E-03    ( -0.00155799   0.00146642 )
------------------------------------------------------------
#Fit statistic : Chi-Squared =          39.61 using 59 PHA bins.
# Reduced chi-squared =         0.6950 for     57 degrees of freedom
# Null hypothesis probability =   9.614146e-01

Photon flux (15-150 keV)    in 1 sec: 0.543557 ( -0.179698  0.179947 ) ph/cm2/s
Energy fluence (15-150 keV)             : 4.11652e-08 ( -1.55227e-08  1.59353e-08 ) ergs/cm2
Cutoff power-law model
Time interval is from  151.076 sec. to  152.076 sec.
Spectral model in the cutoff power-law:
------------------------------------------------------------
Parameters  : value       lower 90%   higher 90%
Photon index: -2.20719     ( -0.651457   0.677248 )
Epeak [keV] : 76.3959      ( -9999.36 -9999.36 )
Norm@50keV  : 1.85165E-03    (     )
------------------------------------------------------------
#Fit statistic : Chi-Squared =          39.17 using 59 PHA bins.
# Reduced chi-squared =         0.6994 for     56 degrees of freedom
# Null hypothesis probability =   9.573356e-01

Photon flux (15-150 keV)    in 1 sec: 0.545585 ( -0.184032  0.179953 ) ph/cm2/s
Energy fluence (15-150 keV)             : 2.30877e-08 ( -1.82104e-08  1.21218e-08 ) ergs/cm2
Time-resolved spectra
Distribution
T90 vs. Hardness ratio plot
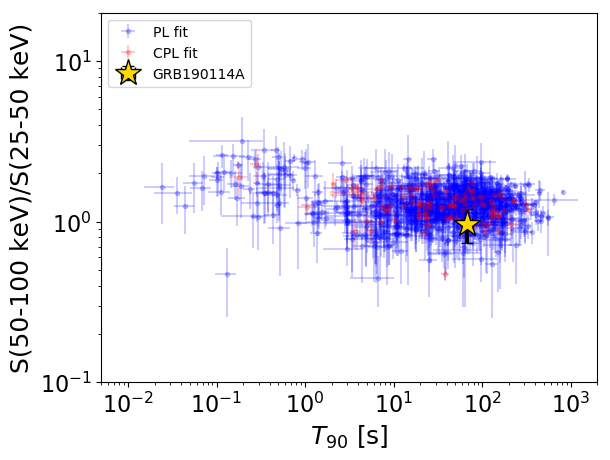
T90                                   = 67.096 sec.
Hardness ratio (energy fluence ratio) = 0.962299200894
S(15-50 keV) vs. S(50-150 keV) plot
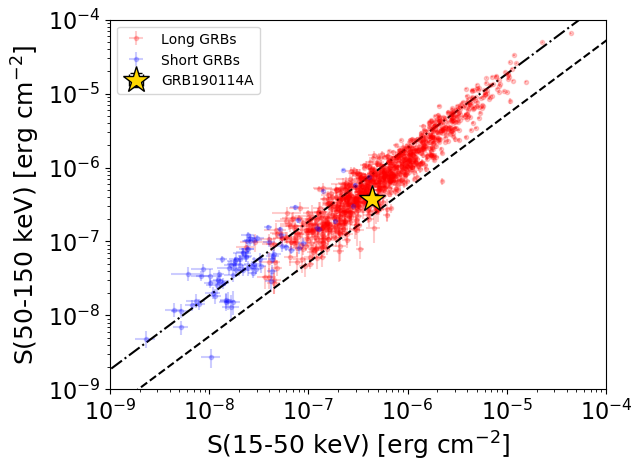
S(15-50 keV)  = 4.329158e-07
S(50-150 keV) = 3.705658e-07
The dash-dotted line and the dashed line traces the fluences calculated from the Band function with Epeak = 15 and 150 keV, respectively. Both lines assume a canonical values of alpha = -1 and beta = -2.5.
Mask shadow pattern
IMX = 3.536813571934281E-01, IMY = -2.415373204495026E-01
Spacecraft aspect plot
Bright source in the pre-burst/pre-slew/post-slew images
Pre-burst image of 15-350 keV band
Time interval of the image:
-239.000000 126.400000

# RAcent  DECcent POSerr Theta    Phi  PeakCts   SNR AngSep     Name
#  [deg]    [deg]    ['] [deg]  [deg]                   [']
133.0720 -43.2197    3.0  56.8  173.8   6.6132   3.8 ------	UNKNOWN
 27.8846   1.1571    3.9  46.4  -22.2   1.7659   3.0 ------	UNKNOWN
 30.0919 -45.5934    4.2  40.9  -92.1   4.0189   2.8 ------	UNKNOWN
Pre-slew background subtracted image of 15-350 keV band
Time interval of the image:
126.400000 185.100590

# RAcent  DECcent POSerr Theta    Phi  PeakCts   SNR AngSep     Name
#  [deg]    [deg]    ['] [deg]  [deg]                   [']
 65.5428   2.1955    0.8  23.2   34.3   1.4600  14.8 ------	UNKNOWN
118.6291 -41.6408    2.5  46.1  173.5   1.0018   4.6 ------	UNKNOWN
 34.3262 -11.8391    2.4  35.0  -36.1   0.6544   4.9 ------	UNKNOWN
Post-slew image of 15-350 keV band
Time interval of the image:
235.500600 963.123700

# RAcent  DECcent POSerr Theta    Phi  PeakCts   SNR AngSep     Name
#  [deg]    [deg]    ['] [deg]  [deg]                   [']
 83.6329  22.0204    0.3  26.5   65.9  30.7920  35.9    0.4	Crab
 82.0057 -37.6819    3.2  42.7 -173.6   4.5376   3.6 ------	UNKNOWN
 28.1613  -1.1086    4.2  37.5  -68.9   5.0106   2.7 ------	UNKNOWN
 62.1261 -54.4953    3.2  56.7 -151.9  15.4541   3.6 ------	UNKNOWN