Analysis Summary
Notes:
- 1) No attempt has been made to eliminate the non-significant decimal places.
- 2) This batgrbproduct analysis is done using the HEASARC data.
- 3) This batgrbproduct analysis is using the flight position for the mask-weighting calculation.
======================================================================
BAT GRB EVENT DATA PROCESSING REPORT
Process Script Ver: batgrbproduct v2.46
Process Start Time: Sun Mar 17 22:45:22 EDT 2019
Host Name: bat1
Current Working Dir: /local/data/bat1/alien/Swift_3rdBATcatalog/event/batevent_reproc/trigger883818
======================================================================
Trigger: 00883818 Segment: 000
BAT Trigger Time: 569187094.336 [s; MET]
Trigger Stop: 569187110.72 [s; MET]
UTC: 2019-01-14T19:31:12.086340 [includes UTCF correction]
Where From?: TDRSS position message
BAT
RA: 174.882937593776 Dec: 18.8766590141854 [deg; J2000]
Catalogged Source?: NO
Point Source?: YES
GRB Indicated?: YES [ by BAT flight software ]
Image S/N Ratio: 7.12
Image Trigger?: NO
Rate S/N Ratio: 9.48683298050514 [ if not an image trigger ]
Image S/N Ratio: 7.12
Analysis Position: [ source = BAT ]
RA: 174.882937593776 Dec: 18.8766590141854 [deg; J2000]
Refined Position: [ source = BAT pre-slew burst ]
RA: 174.86793074047 Dec: 18.8814949319361 [deg; J2000]
{ 11h 39m 28.3s , +18d 52' 53.4" }
+/- 2.2922620327574 [arcmin] (estimated 90% radius based on SNR)
+/- 1.20712298966811 [arcmin] (formal 1-sigma fit error)
SNR: 9.29940473488376
Angular difference between the analysis and refined position is 0.900026 arcmin
Partial Coding Fraction: 0.6328125 [ including projection effects ]
Duration
T90: 26.4919999837875 +/- 6.69042210499976
Measured from: 0.167999982833862
to: 26.6599999666214 [s; relative to TRIGTIME]
T50: 13.0479999780655 +/- 4.12861484108176
Measured from: 4.44400000572205
to: 17.4919999837875 [s; relative to TRIGTIME]
Fluence
Peak Flux (peak 1 second)
Measured from: 3.62400007247925
to: 4.62400007247925 [s; relative to TRIGTIME]
Total Fluence
Measured from: -1.16399991512299
to: 27.8999999761581 [s; relative to TRIGTIME]
Band 1 Band 2 Band 3 Band 4
15-25 25-50 50-100 100-350 keV
Total 0.309884 0.423022 0.143154 0.045916
0.046547 0.049057 0.044696 0.043927 [error]
Peak 0.028981 0.013750 0.017731 0.025360
0.008819 0.009573 0.008593 0.008429 [error]
[ fluence units of on-axis counts / fully illuminated detector ]
======================================================================
====== Table of the duration information =============================
Value tstart tstop
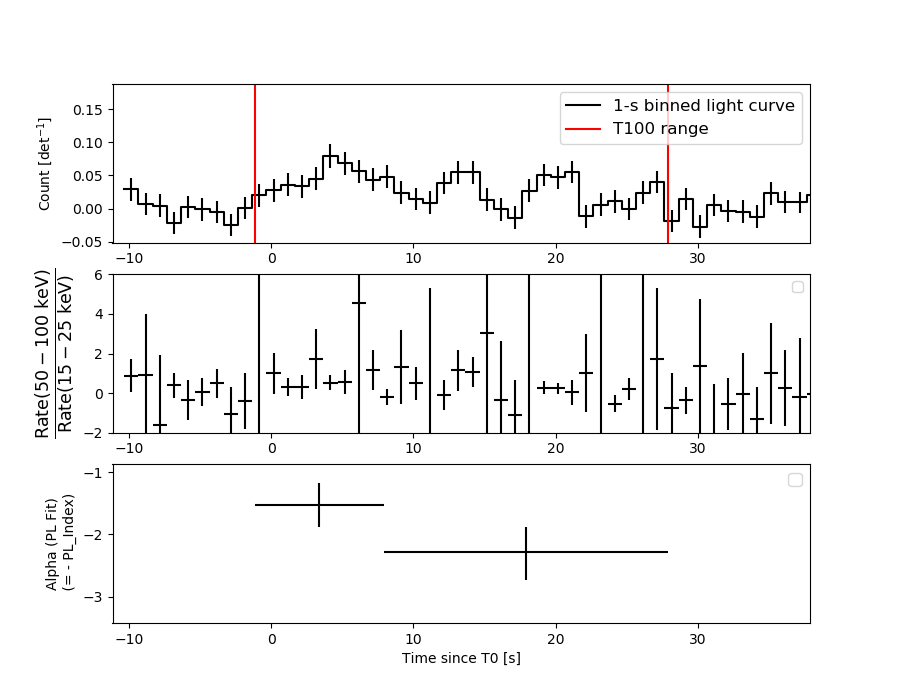
T100 29.064 -1.164 27.900
T90 26.492 0.168 26.660
T50 13.048 4.444 17.492
Peak 1.000 3.624 4.624
====== Spectral Analysis Summary =====================================
Model : spectral model: simple power-law (PL) and cutoff power-law (CPL)
Ph_index : photon index: E^{Ph_index}
Ph_90err : 90% error of the photon index
Epeak : Epeak in keV
Epeak_90err: 90% error of Epeak
Norm : normalization at 50 keV in both the PL model and CPL model
Nomr_90err : 90% error of the normalization
chi2 : Chi-Squared
dof : degree of freedo
=== Time-averaged spectral analysis ===
(Best model with acceptable fit: PL)
Model Ph_index Ph_90err_low Ph_90err_hi Epeak Epeak_90err_low Epeak_90err_hi Norm Nomr_90err_low Norm_90err_hi chi2 dof
PL -1.977 -0.294 0.273 - - - 1.91e-03 -3.79e-04 3.68e-04 54.720 57
CPL -1.324 -0.813 2.698 39.231 -36.235 -39.231 4.83e-03 -4.83e-03 2.64e-01 54.120 56
=== 1-s peak spectral analysis ===
(Best model with acceptable fit: N/A)
Model Ph_index Ph_90err_low Ph_90err_hi Epeak Epeak_90err_low Epeak_90err_hi Norm Nomr_90err_low Norm_90err_hi chi2 dof
PL -2.004 -1.362 1.036 - - - 3.56e-03 -3.56e-03 2.08e-03 60.730 57
CPL -2.068 -0.938 2.068 41.305 N/A N/A 3.30e-03 N/A N/A 60.620 56
=== Fluence/Peak Flux Summary ===
Model Band1 Band2 Band3 Band4 Band5 Total
15-25 25-50 50-100 100-350 15-150 15-350 keV
Fluence PL 1.11e-07 1.53e-07 1.56e-07 2.88e-07 5.12e-07 7.08e-07 erg/cm2
90%_error_low -2.25e-08 -2.34e-08 -4.07e-08 -1.25e-07 -9.42e-08 -1.78e-07 erg/cm2
90%_error_hi 2.30e-08 2.32e-08 4.24e-08 1.77e-07 9.76e-08 2.19e-07 erg/cm2
Peak flux PL 2.38e-01 1.78e-01 8.88e-02 6.31e-02 5.35e-01 5.69e-01 ph/cm2/s
90%_error_low -2.38e-01 -8.75e-02 -8.88e-02 -6.31e-02 -2.31e-01 -2.52e-01 ph/cm2/s
90%_error_hi 1.59e-01 7.79e-02 7.83e-02 1.99e-01 2.31e-01 2.58e-01 ph/cm2/s
Fluence CPL 1.08e-07 1.66e-07 1.43e-07 8.02e-08 4.67e-07 4.99e-07 erg/cm2
90%_error_low -2.47e-08 -4.68e-08 -7.80e-08 -7.82e-08 -1.25e-07 -1.56e-07 erg/cm2
90%_error_hi 2.42e-08 4.12e-08 5.14e-08 2.42e-07 1.27e-07 3.49e-07 erg/cm2
Peak flux CPL 2.13e-01 1.56e-01 7.87e-02 6.68e-02 4.76e-01 5.14e-01 ph/cm2/s
90%_error_low N/A -1.56e-01 -7.87e-02 -6.68e-02 -4.76e-01 N/A ph/cm2/s
90%_error_hi N/A 9.61e-02 5.18e-02 3.56e-02 2.86e-01 N/A ph/cm2/s
======================================================================
Image
Pre-slew 15.0-350.0 keV image (Event data)
#   RAcent    DECcent   POSerr    Theta     Phi              Peak Cts       SNR   Name
  174.8679    18.8815   0.0207    35.8443     2.3629         0.9408097      9.299 TRIG_00883818

Foreground time interval of the image:
 -1.164  27.900 (delta_t =  29.064 [sec])
Background time interval of the image:
-239.336  -1.164 (delta_t = 238.172 [sec])
Light Curves
Note: The mask-weighted lightcurves have units of either count/det or counts/sec/det, where a det is 0.4 x 0.4 = 0.16 sq cm.
Full-time range; 1 s binning
Other quick-look light curves:
- 64 ms binning (zoomed)
- 16 ms binning (zoomed)
- 8 ms binning (zoomed)
- 2 ms binning (zoomed)
- SN=5 or 10 s binning (full-time range)
- Raw light curve
Spectra
- 64 ms binning (zoomed)
- 16 ms binning (zoomed)
- 8 ms binning (zoomed)
- 2 ms binning (zoomed)
- SN=5 or 10 s binning (full-time range)
- Raw light curve
Spectra
Notes:
- 1) The fitting includes the systematic errors.
- 2) When the burst includes telescope slew time periods, the fitting uses an average response file made from multiple 5-s response files through out the slew time plus single time preiod for the non-slew times, and weighted by the total counts in the corresponding time period using addrmf. An average response file is needed becuase a spectral fit using the pre-slew DRM will introduce some errors in both a spectral shape and a normalization if the PHA file contains a lot of the slew/post-slew time interval.
- 3) For fits to more complicated models (e.g. a power-law over a cutoff power-law), the BAT team has decided to require a chi-square improvement of more than 6 for each extra dof.
Time averaged spectrum fit using the average DRM
Power-law model
Time interval is from   -1.164 sec. to   27.900 sec.

Spectral model in power-law:
------------------------------------------------------------
Parameters  : value       lower 90%   higher 90%
Photon index: -1.97693     ( -0.293731   0.272865 )
Norm@50keV  : 1.91405E-03    ( -0.00037894   0.000367713 )
------------------------------------------------------------
#Fit statistic : Chi-Squared =          54.72 using 59 PHA bins.
# Reduced chi-squared =         0.9599 for     57 degrees of freedom
# Null hypothesis probability =   5.612851e-01

Photon flux (15-150 keV)    in 29.06 sec: 0.284124 ( -0.042406  0.042407 ) ph/cm2/s
Energy fluence (15-150 keV)             : 5.12467e-07 ( -9.42178e-08  9.76393e-08 ) ergs/cm2
Cutoff power-law model
Time interval is from   -1.164 sec. to   27.900 sec.
Spectral model in the cutoff power-law:
------------------------------------------------------------
Parameters  : value       lower 90%   higher 90%
Photon index: -1.32448     ( -0.818616   2.69269 )
Epeak [keV] : 39.2310      ( -36.1731 -39.1694 )
Norm@50keV  : 4.83357E-03    ( -0.00491556   0.263807 )
------------------------------------------------------------
#Fit statistic : Chi-Squared =          54.12 using 59 PHA bins.
# Reduced chi-squared =         0.9664 for     56 degrees of freedom
# Null hypothesis probability =   5.464953e-01

Photon flux (15-150 keV)    in 29.06 sec: 0.277288 ( -0.046203  0.045038 ) ph/cm2/s
Energy fluence (15-150 keV)             : 4.67041e-07 ( -1.24781e-07  1.26644e-07 ) ergs/cm2
1-s peak spectrum fit
Power-law model
Time interval is from    3.624 sec. to    4.624 sec.

Spectral model in power-law:
------------------------------------------------------------
Parameters  : value       lower 90%   higher 90%
Photon index: -2.00433     ( -1.3614   1.03696 )
Norm@50keV  : 3.55813E-03    ( -0.00355692   0.00208544 )
------------------------------------------------------------
#Fit statistic : Chi-Squared =          60.73 using 59 PHA bins.
# Reduced chi-squared =          1.065 for     57 degrees of freedom
# Null hypothesis probability =   3.431013e-01

Photon flux (15-150 keV)    in 1 sec: 0.534821 ( -0.231008  0.23098 ) ph/cm2/s
Energy fluence (15-150 keV)             : 3.28148e-08 ( -1.82095e-08  2.05457e-08 ) ergs/cm2
Cutoff power-law model
Time interval is from    3.624 sec. to    4.624 sec.
Spectral model in the cutoff power-law:
------------------------------------------------------------
Parameters  : value       lower 90%   higher 90%
Photon index: -2.10573     ( -0.900979   2.10575 )
Epeak [keV] : 44.4878      (   )
Norm@50keV  : 2.75659E-03    (     )
------------------------------------------------------------
#Fit statistic : Chi-Squared =          60.46 using 59 PHA bins.
# Reduced chi-squared =          1.080 for     56 degrees of freedom
# Null hypothesis probability =   3.178922e-01

Photon flux (15-150 keV)    in 1 sec: 0.475655 ( -0.475655  0.28638 ) ph/cm2/s
Energy fluence (15-150 keV)             : 0 ( 0  0 ) ergs/cm2
Time-resolved spectra
Distribution
T90 vs. Hardness ratio plot
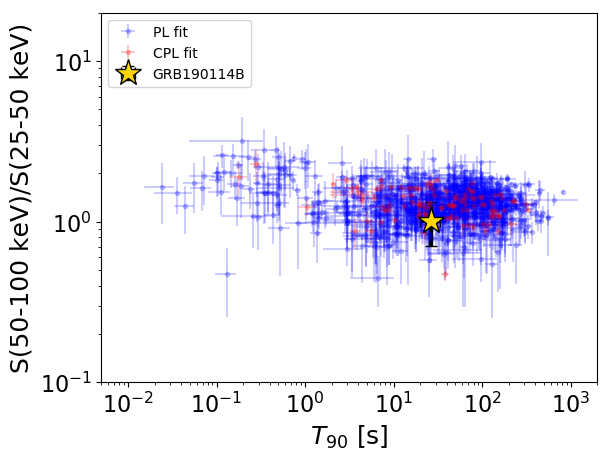
T90                                   = 26.492 sec.
Hardness ratio (energy fluence ratio) = 1.01615538305
S(15-50 keV) vs. S(50-150 keV) plot
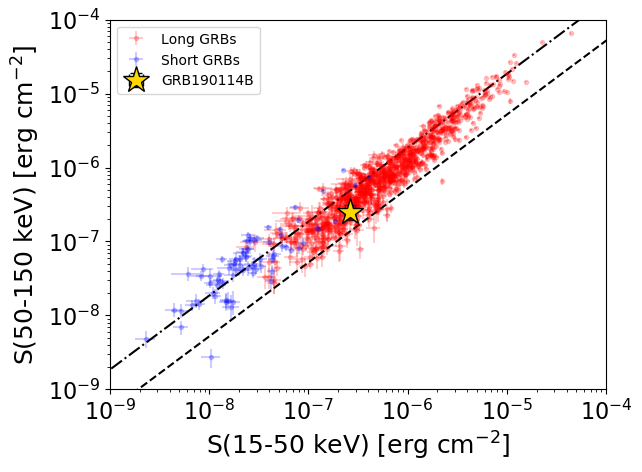
S(15-50 keV)  = 2.64565e-07
S(50-150 keV) = 2.4790747e-07
The dash-dotted line and the dashed line traces the fluences calculated from the Band function with Epeak = 15 and 150 keV, respectively. Both lines assume a canonical values of alpha = -1 and beta = -2.5.
Mask shadow pattern
IMX = 7.217858374019105E-01, IMY = -2.978403258128292E-02
Spacecraft aspect plot
Bright source in the pre-burst/pre-slew/post-slew images
Pre-burst image of 15-350 keV band
Time interval of the image:
-239.336000 -1.164000

# RAcent  DECcent POSerr Theta    Phi  PeakCts   SNR AngSep     Name
#  [deg]    [deg]    ['] [deg]  [deg]                   [']
 41.0282  61.3932    2.5  55.9 -178.3   5.1531   4.5 ------	UNKNOWN
174.0115  32.8705    2.9  22.7   -8.0   0.9473   4.0 ------	UNKNOWN
180.6633  32.6107    2.4  26.0  -19.1   1.2548   4.7 ------	UNKNOWN
Pre-slew background subtracted image of 15-350 keV band
Time interval of the image:
-1.164000 27.900000

# RAcent  DECcent POSerr Theta    Phi  PeakCts   SNR AngSep     Name
#  [deg]    [deg]    ['] [deg]  [deg]                   [']
174.8681  18.8814    1.2  35.8    2.4   0.9520   9.4 ------	UNKNOWN
131.3818  68.8508    2.2  20.9 -172.0   0.3915   5.3 ------	UNKNOWN
181.6292  14.3285    2.1  42.5   -4.6   0.6392   5.4 ------	UNKNOWN
148.7744  69.5958    2.3  18.3 -155.2   0.3558   5.0 ------	UNKNOWN
187.6714  11.7017    1.9  47.3  -10.6   0.7837   6.1 ------	UNKNOWN
181.3797  51.6652    2.4  15.5  -66.8   0.3612   4.8 ------	UNKNOWN
 27.3035  64.0473    2.3  57.7 -170.5   2.0904   5.0 ------	UNKNOWN
Post-slew image of 15-350 keV band
Time interval of the image:
141.164620 962.714000

# RAcent  DECcent POSerr Theta    Phi  PeakCts   SNR AngSep     Name
#  [deg]    [deg]    ['] [deg]  [deg]                   [']
144.1040  -3.4900    3.1  37.7   43.7   4.4730   3.7 ------	UNKNOWN
235.2149  52.5725    3.9  57.2 -154.1  14.8196   3.0 ------	UNKNOWN